5.3.21 Changelog
about 5 years ago
Lots of exciting ships this week!
What's new
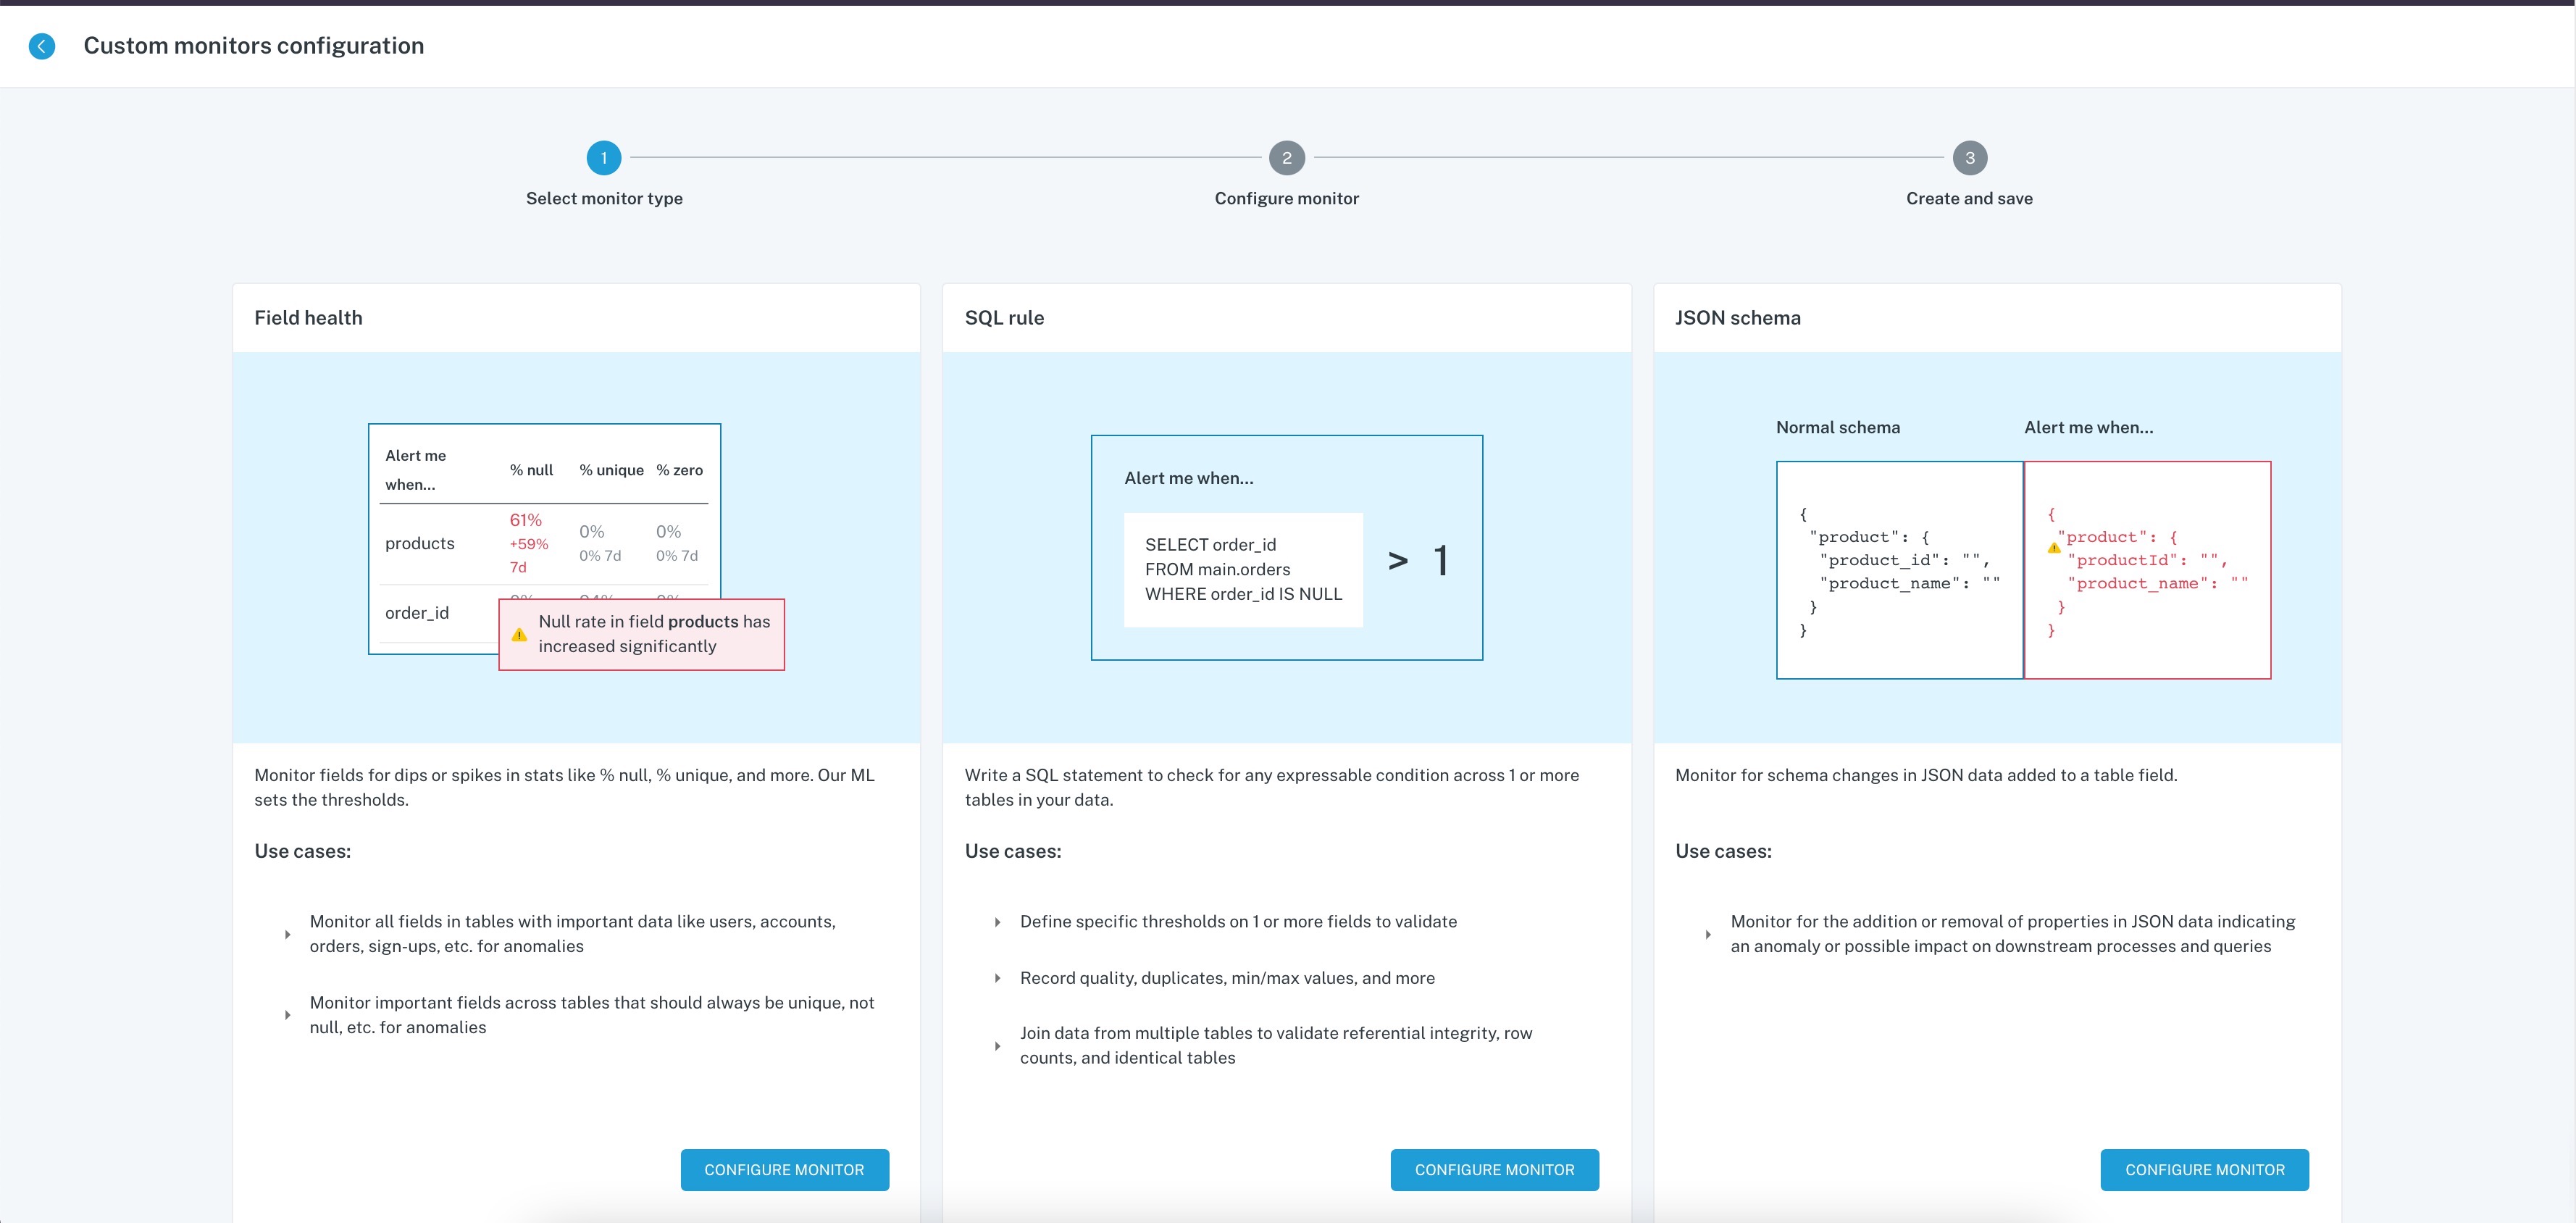
- New Custom Monitors summary table and description cards: To make it easier to manage your growing list of Field Health, Dimension Tracking, etc. monitors, all custom monitors can now be managed from a single sortable table. We also redesigned the workflow to create new custom monitors, including descriptive cards that explain what each custom monitor does.
- Multi-warehouse support: For customers with multiple data warehouses, you can now connect them to a single Monte Carlo account. With this feature you can manage and create custom monitors, browse the catalog, view Pipelines and more, all from a single Monte Carlo account.
- Data consumer role: When assigned to a user, the Data Consumer role ONLY has permission to access the Catalog, Pipelines and Dashboard tabs in the Monte Carlo app. This role is ideal for data consumers at your company that would benefit from accessing the catalog and pipelines in Monte Carlo, but do not need access to Incidents, Monitors or Settings.
Improvements and fixes*
- Redshift Field Health percentile support: We now collect percentile data via our Field Health monitors in Redshift, which previously was unsupported.
- CLI multi-warehouse compatibility: We updated the CLI used to deploy Monte Carlo crawlers to support multi-warehouse connections. Learn more here.
- Automatically mute
pg_temp*tables in Redshift: To reduce catalog clutter and simplify the lineage graphs, we now automatically mute all pg\_temp tables created by Redshift.
What's next
- Custom monitors workflows: We have more improvements to make to the new custom monitors flow including new builders for each of the custom monitors, advanced sorting and filters in the Custom Monitors summary table and more. Let us know if you have any other feedback!
- Data Insights tab: Our data science team is kicking off a project to allow customers to export data generated by Monte Carlo. Exports include the Key Asset report which calculates an importance score for all tables and views in a warehouse, the Incident Event report which lists all anomaly events and relevant data, and more!