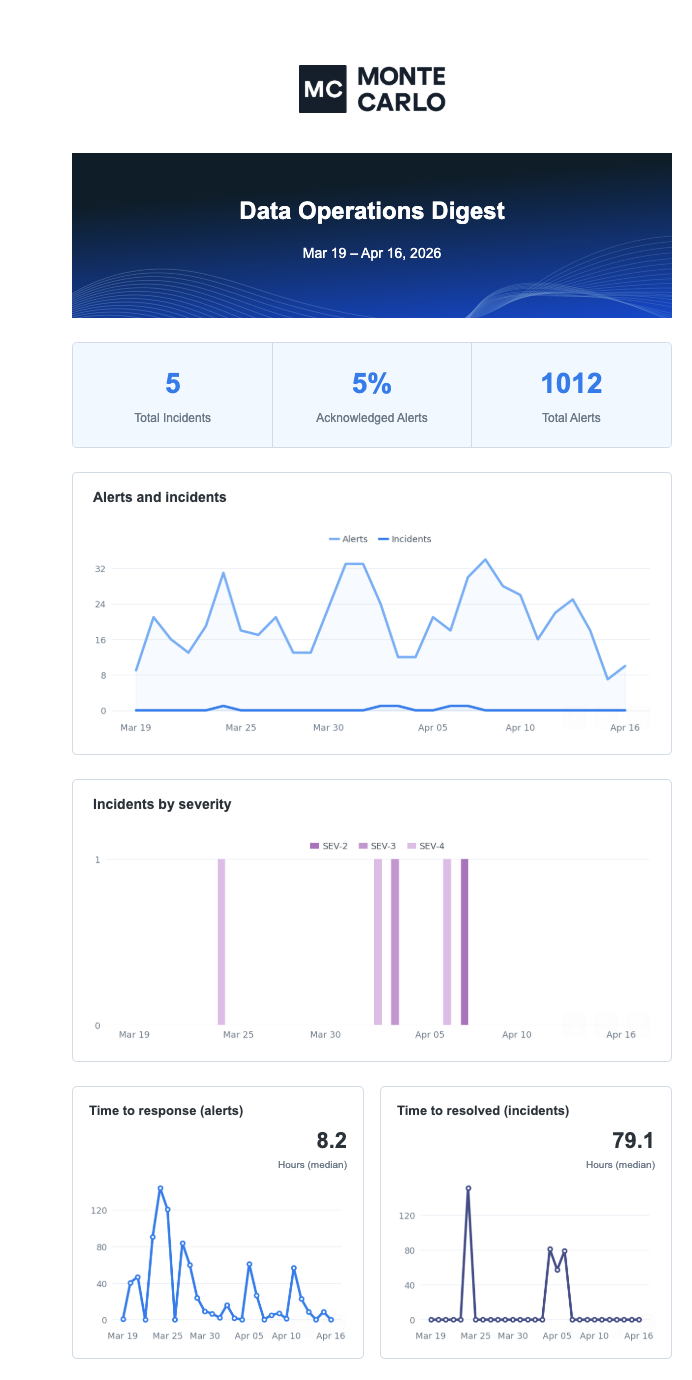
We’re rolling out an important update today to help you better manage and report on incidents. Now, when marking incidents, you’ll have the option to either create a new incident or merge alerts into an existing one. This change is designed to improve your workflow and ensure more accurate incident tracking on the data operations dashboard.

Sometimes, alerts from different monitors point to the same root cause. By merging related alerts into a single incident, you can group them together for clearer insights and more precise reporting over time. This complements the existing capability of splitting alerts.

Additionally, you can now mark alerts as incidents directly from the alert feed. Learn more about marking alerts as incidents.

The data quality dashboard provides a way to view the health of a set of monitors. In tandem with the the recent release of Monitor tags, you can now granularly measure data quality for a set of Monte Carlo validation, comparison, custom sql monitors. Use the data quality dashboard to report on:

  • SLAs: report on the current state and trend of specific monitors, rather than all monitors.
  • Critical data elements: report on a set of validations or metric monitors for a critical data element, applying tags like cde:total_revenue.
  • Data contracts: tag monitors with a specific tag per data contract or simply data-contract.

Learn more on the Data quality dashboard documentation.

In metric monitors, the relative row count metric will alert to sudden shifts in the distribution of values in categorical fields. It tracks the percentage of rows in a given segment compared to the overall number of rows, and alerts when the percentage for a segment suddenly spikes higher or drops lower. Learn more.

Some common examples where this is valuable:

  • An events table has an app_version field. The user would like to be alerted if any app_version is suddenly receiving a disproportionately high or low number of rows relative to overall volume, as it may indicate issues with that version.
  • An orders table has a country field. The user would like to be alerted if any country is suddenly receiving a disproportionately high or low number of rows relative to overall volume, as it may indicate an issue with processing order from that country.

Historically, this use case was addressed with dimension tracking. Existing dimension tracking monitors will continue to function, but to streamline the user experience, the creation of new dimension tracking monitors through the UI will be blocked. Fewer distinct monitor types makes it easier for new users to learn the platform and to maintain feature parity.

Several longstanding requests for dimension tracking are now resolved by including this in the metric monitor:

  • Visible thresholds
  • Sensitivity options
  • Showing more than 10 segments at once
  • Joins when choosing data the monitor
  • Supporting higher cardinality fields

Monte Carlo now supports routing alerts and incidents to incident.io. Incident.io is an incident management platform that helps customers declare, collaborate, communicate around and learn from events that disturb their normal course of business - from critical infrastructure being down, to data breaches and security incidents.

Get started in the Incident.io documentation.

In addition to assets, custom monitors now have their own dedicated tags. Monitor tags are intentionally versatile to support a variety of use-cases.

  • Data quality reporting and SLAS: report on specific monitors, rather than all monitors for a set of tables on the upcoming Data quality dashboard.
  • Critical data elements: report on a set of validations or metric monitors for a critical data element, applying tags like cde:total_revenue.
  • Enforcing data contracts: with a data-contract tag.
  • Team organization: for monitors that are owned by the finance team, applying tags like team:finance.
  • Use case organization: for organizing specific use-cases or data products, applying tags like data-product:salesforce_revenue or project:revenue_reliability.

Learn more in the Monitor tags documentation!

SQL data sources are now available for metric monitoring. This functionality enables joining, filtering, and transforming tables in SQL before defining alert conditions without having to create views in the data warehouse.

Our new Create data product wizard provides a cleaner, more initiative process to help you create Data products in Monte Carlo. Start by going to "Create data product" under the Data product tab in the top menu.

  1. Add a Name and Description that will make this Data Product easily identifiable by other users viewing this across your workspace.

  2. Search for assets that you would like to add to this Data Product. Table and Reports can be added. Click "+" under "Add" column to add them to the Data Product.

  3. As you add Tables and Reports, you will see them appear on the right side.

    1. The number behind "Included assets", e.g. "8" in screenshot below, represents the total number of unique tables necessary to build the data product. It includes all tables used directly by the product, as well as their upstream dependencies.

    2. For tables and reports where upstream lineage is available, you will see a column for the number of upstream tables connected to that asset that will be included in the Data Product, e.g. "4 upstream tables".

  4. Click "Next: Review"

  5. In the Review step, you will be able to see all Tables and Reports to be included in your Data Product. The tables and reports you included in the previous step and all their upstream tables have been included in the Data Product. Refer to Why Include All Upstream Tables in Data Products.

    1. Use the "Lineage" and "List" view to see the Data Product in different visual layouts

    2. Use the Filters at the top to filter both of these views by the monitoring status of each of the tables included in the Data Product.

      1. Monitored - tables that are currently already monitored through other monitoring inclusion rules in the Usage UI
      2. Not monitored - tables that are not monitored or explicitly excluded from monitoring.
      3. Not supported - tables that exist in the lineage but monitoring through Monte Carlo is not supported
    3. Click "Create and Monitor" to create the Data Product and monitor all "Not monitored" tables. Note: the

Once a Data Product is created, all tables in the Data Product will be automatically tagged with a Table tag.

See more details on Data products in our documentation: https://docs.getmontecarlo.com/docs/using-data-product-dashboards

Similar to the daylight savings support that already exists on custom monitors, we've now added daylight savings support to explicit thresholds for Freshness and Volume.

Some customers run their data pipelines in their local timezone. This setting makes sure the schedule (or CRON) of their explicit thresholds also adheres to that local timezone.

Custom monitors have a toggle to turn failure notifications on or off. When on, the monitor will send an alert to if the monitor fails to complete. This is different than the monitor triggering an anomaly alert. Instead, the job of a failure notification is to indicate that monitor was not able to check the quality of the data. When creating a new monitor, the default setting is ‘on’.

We'll now alert to cases where the “run” of the monitor never even starts. For example:

  • Table not monitored: the table is not included for “monitoring” in Settings
  • No connection found: the connection to the data source no longer exists
  • Sampling is disabled for a value-based rule: data sampling has been turned off in your environment. This type of rule is disallowed when sampling is off.

Previously, we alerted just to cases where it started but then failed for some reason. To limit noise from repeatedly failing monitors, we’ll send no more than 1 failure notification per monitor per week.

For accounts where this will significantly increase the number of failure notifications being sent, a proactive message was delivered to Account Owners on September 25.