Data Explorer (beta) is now available, to help customers investigate and profile tables
Data Explorer is a new tab on Assets that makes it easy to profile the contents of a table or view. This is helpful when investigating a data quality issue reported by a business partner, when considering which monitors to create, or when getting familiar with the contents of a table.
The experience is interactive and no-code, making it approachable for less technical roles. Users can point and click to adjust the time range of data and filter down for particular segments. In the future, we'd like to make it easy to compare multiple segments of data side-by-side.
Currently, Data Explorer is available for just a subset of customers and for the Snowflake integration only. Your Monte Carlo Agent must be version 16624 or higher. To learn more, check out our documentation.
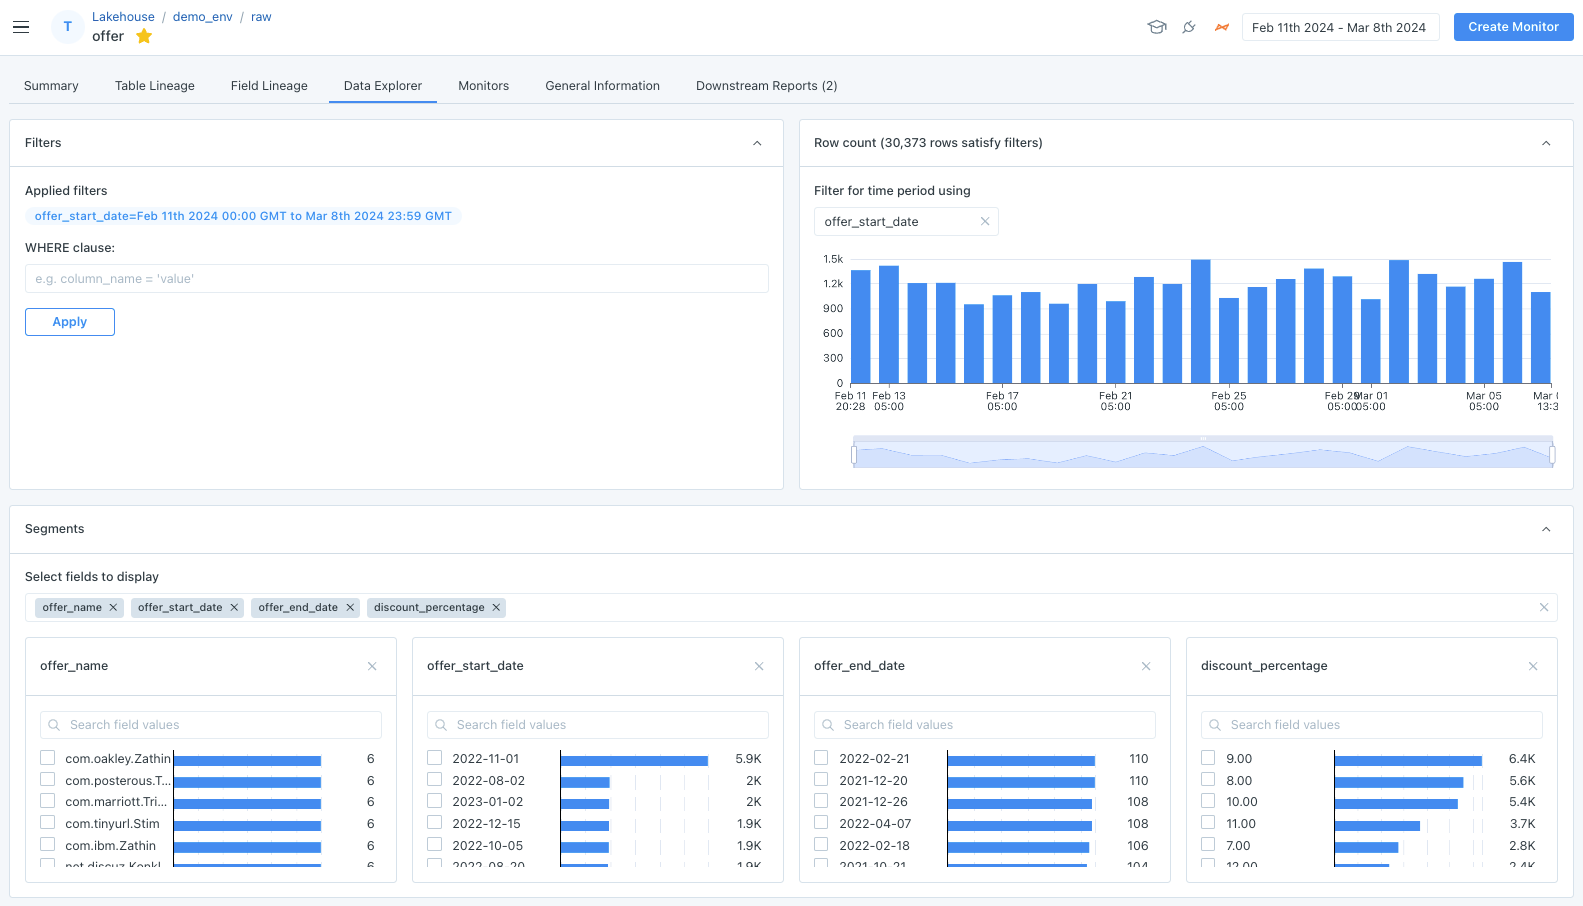
Filters, Row count, and Segments sections of Data Explorer. Adjust the slider in Row count and click on values in Segments to filter the rest of the data in the dashboard.
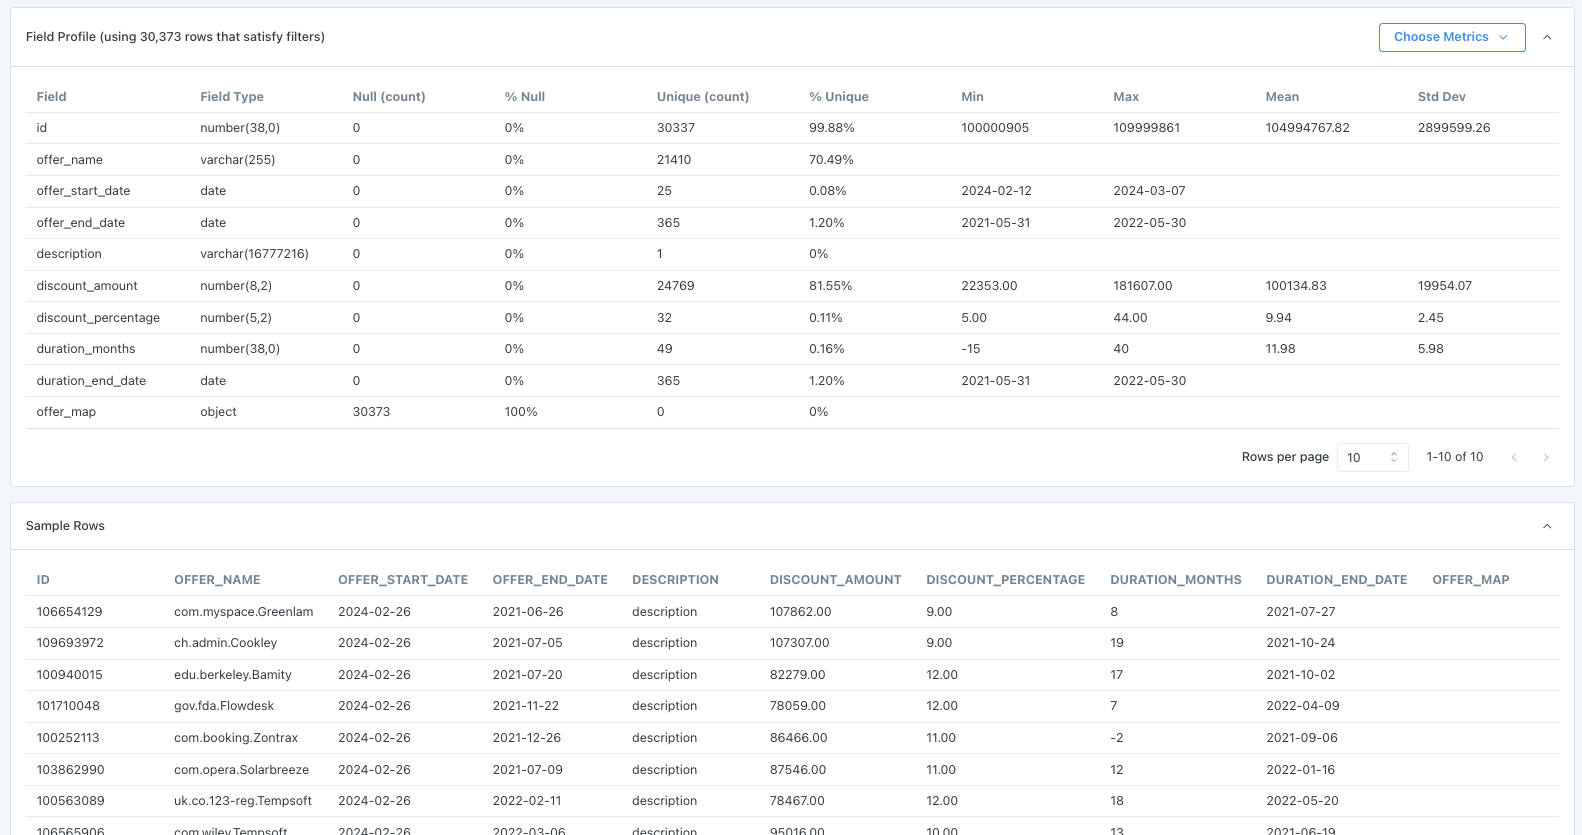
Field profile and Sample rows sections of Data Explorer.