New charts for volume
over 2 years ago
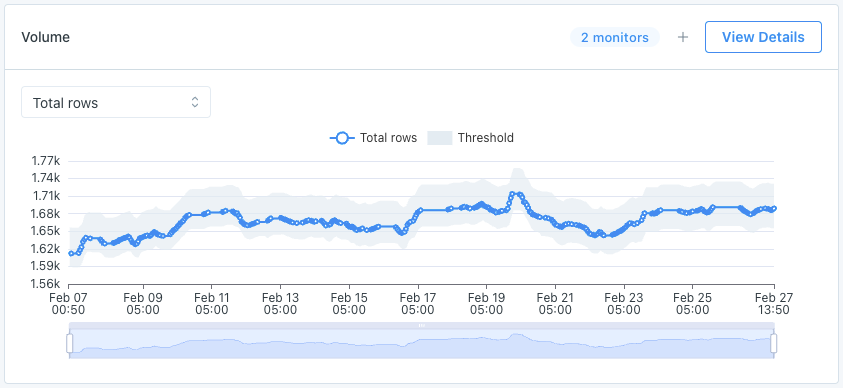
We’re refreshing charts across the app so they all have 1) a clearly defined metric, 2) a clear threshold, 3) a legend, 4) properly scaled and labeled axis, 5) clearly marked anomalies.
New volume charts show just that – clear metrics (toggle between row count, or change in row count), clear thresholds, an interactive legend, better axis scaling, and clear anomalies. This improves usability and interpretability, so that understanding an anomaly is simple.