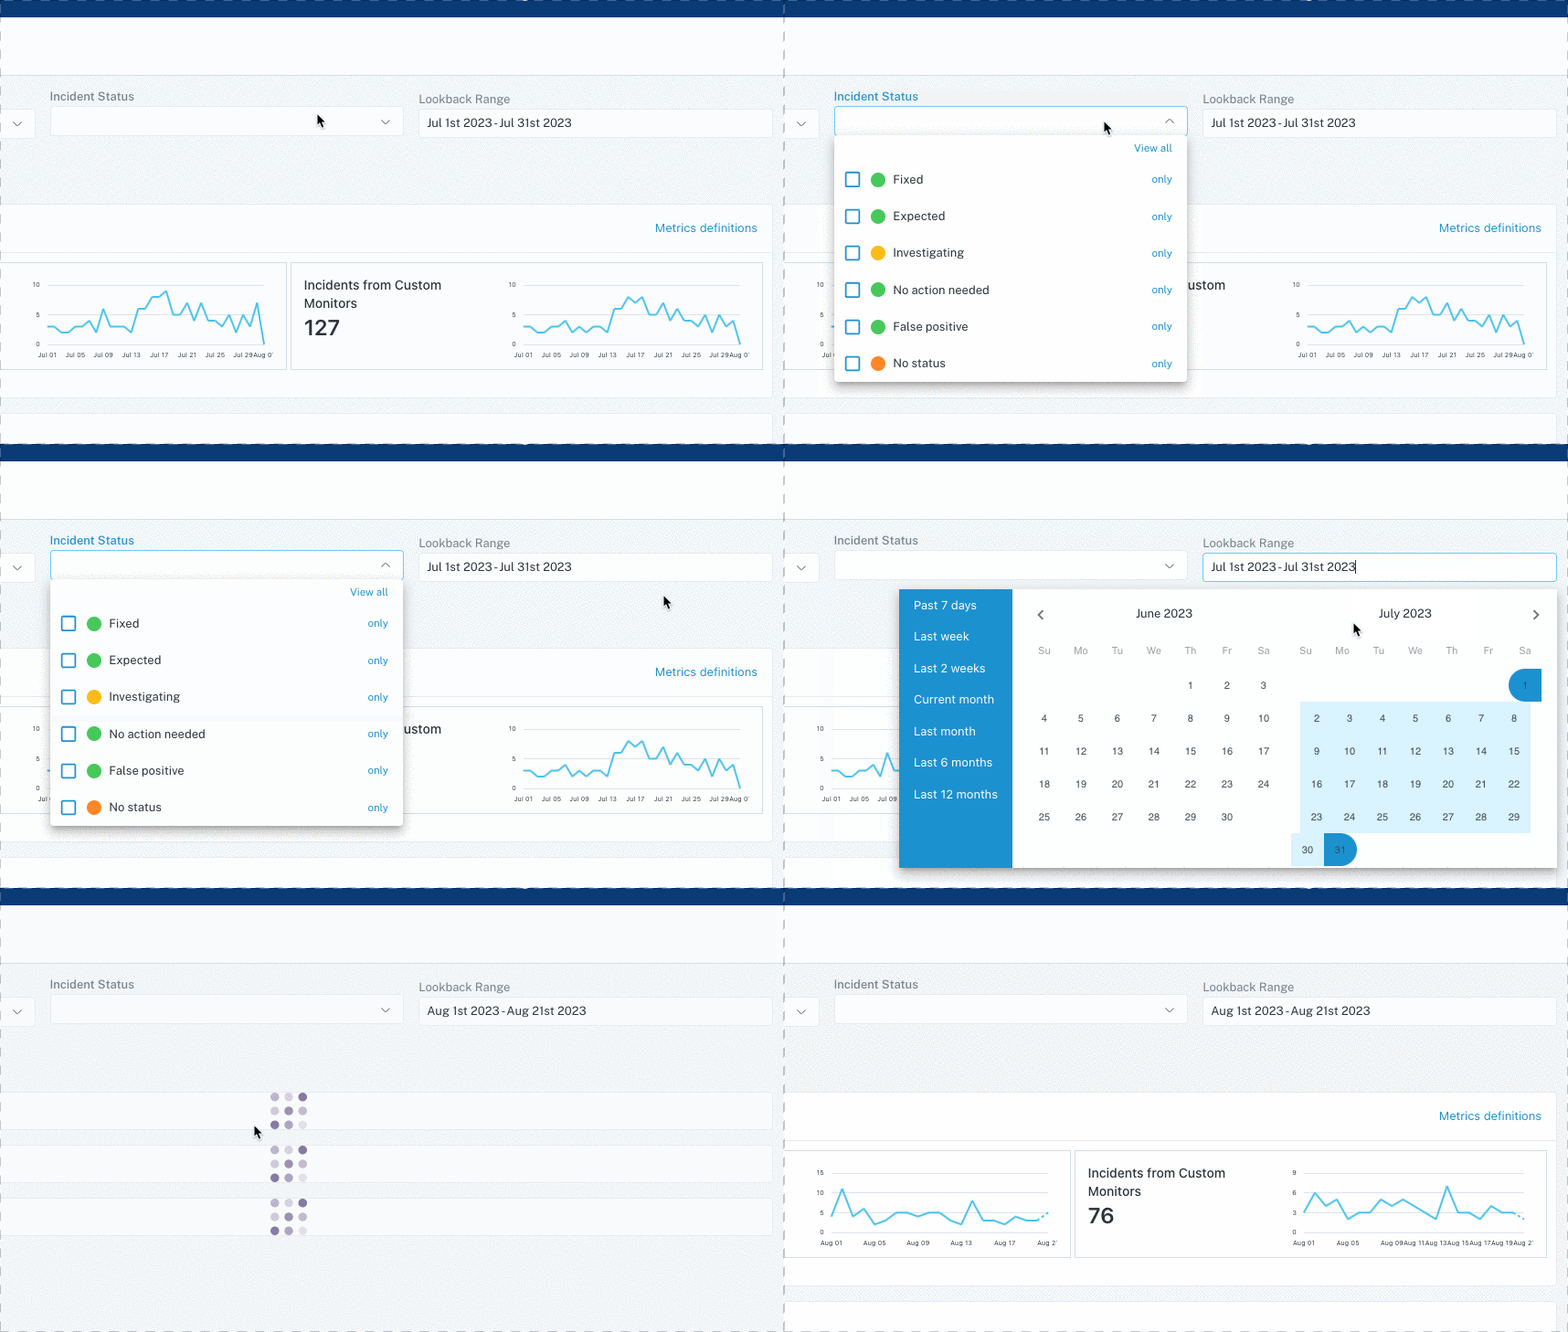
For Field Health monitors with segmentation fields selected, the initial execution of the monitor will now collect metrics from the trailing 7 days. This jumpstarts the training of the machine learning detectors, shortening the amount of time they need to 'warm up' and allowing users to receive meaningful anomalies, faster.

undefined

You'll see this on the Assets page, Incidents, Freshness and Volume Rule builder, and anywhere else where Freshness or Volume charts are displayed. The new look and feel allows for more better navigation and easier interpretation of the metrics being displayed by these monitor types, including:

  • Adjustable time-window slider on the X-axis
  • Cleaner, more reactive, and more informative tooltip
  • Synchronized actions between Freshness and Volume charts on the Assets page

Referential Integrity is a common test to ensure that the values in a field always have corresponding records in another table. For example, make sure that the customer field in orders table all have a matching customer in the customer_fact table.

You can now set these up through Monte Carlo without needing to write any SQL.

undefined

MC is releasing a brand new dashboard with the aim of helping you understand performance issues in your data stack. The dashboard allows you to explore the performance of "write" queries run in the past 4 weeks with a number of different filters as well as dig into each query’s deeper context through a detail drawer with volume correlation, runtime breakdown, and other metadata. This is currently only enabled for Snowflake customers, however, we plan to release the dashboard for BigQuery and Redshift soon.

To use the Performance Dashboard, please click on the Performance tab in the MC UI.

For more information about the Performance dashboard, please visit https://docs.getmontecarlo.com/docs/performance-beta

Often checking the data output is not enough to fully understand a data incident. With the Monte Carlo Airflow Integration, you can quickly determine what Airflow DAG potentially caused an Incident. Root cause and time to resolution can happen faster than ever when you can get visibility between Airflow and your Data Warehouse in a single pane of glass. See more about the Airflow integrations in docs.

Add annotations to your queries to get Lineage with: https://docs.getmontecarlo.com/docs/airflow-in-lineage

Add callbacks to get DAG observability with: https://docs.getmontecarlo.com/docs/airflow-incidents-dags-and-tasks

undefined

There is now a chart that displays dbt test run data for a model in the assets page for a table. This makes it a lot easier to spot test performance trends for a particular model!

undefined

We have introduced a new chart that appears above the dbt model run data table in the Assets page for a particular table in an effort to help you spot performance trends and anomalous runs.

undefined

You are now able connect your dbt Cloud account with MC through our UI on the Integrations page within Settings. This change makes the process to integrate a lot speedier and more intuitive as well as making it easier to create dbt Cloud integrations with webhooks, which enables us to get your dbt data in real-time.

undefined

A new tab is now available Monitor Details called Change Log, that shows the history of changes to that monitor since it was created.

This was built to help answer a few common problems from customers:

  • “This monitor looks different… did something change? Who changed it?”

  • “We need to track changes for compliance reasons.”

    • Historically, we’d suggest Monitors-as-Code for this use case. Now it's possible for monitors made through the UI as well.
  • “Based on how this monitor is configured today, it didn’t do what I expected when an issue occurred 6 weeks ago. Was something changed since then?”

Changes are logged automatically. No configuration needed. Logging starts June 22, 2023, so changes from before then are not logged.

Previously, Pause was only available for Field Health and Dimension Tracking. Now renamed Disable, this option is available for all Custom Monitor types.

A disabled monitor won’t run, won’t gather metrics, won’t trigger incidents, and won’t send notifications. It remains in this state indefinitely until a user re-enables it or deletes it.

This is in contrast to ‘Snooze’, where a Rule will continue to run & gather metrics (incurring compute costs), but won’t create incidents or send notifications.

There are many reason to Disable a monitor, such as:

Still developing/iterating on the rule

Treating it as a template

Want it ‘off’ while your refactoring pipelines for weeks/months and don’t want it racking up queries