Intro to automated monitoring
Monte Carlo's automated monitoring (also known as out-of-the-box monitoring) is the base level of data observability that provide on all tables in your data warehouse that your Monte Carlo service account has access to.
Automated monitors are built using our ML-based detectors that learn patterns in your data and alert you to anomalous events. You can learn more about these detectors here.
Our automated monitors use data warehouse metadata (like Snowflake's information_schema) rather than querying tables directly, which allows to have a broad coverage for your tables without increasing computation costs.
See the [frequently asked questions] section for specific answers!
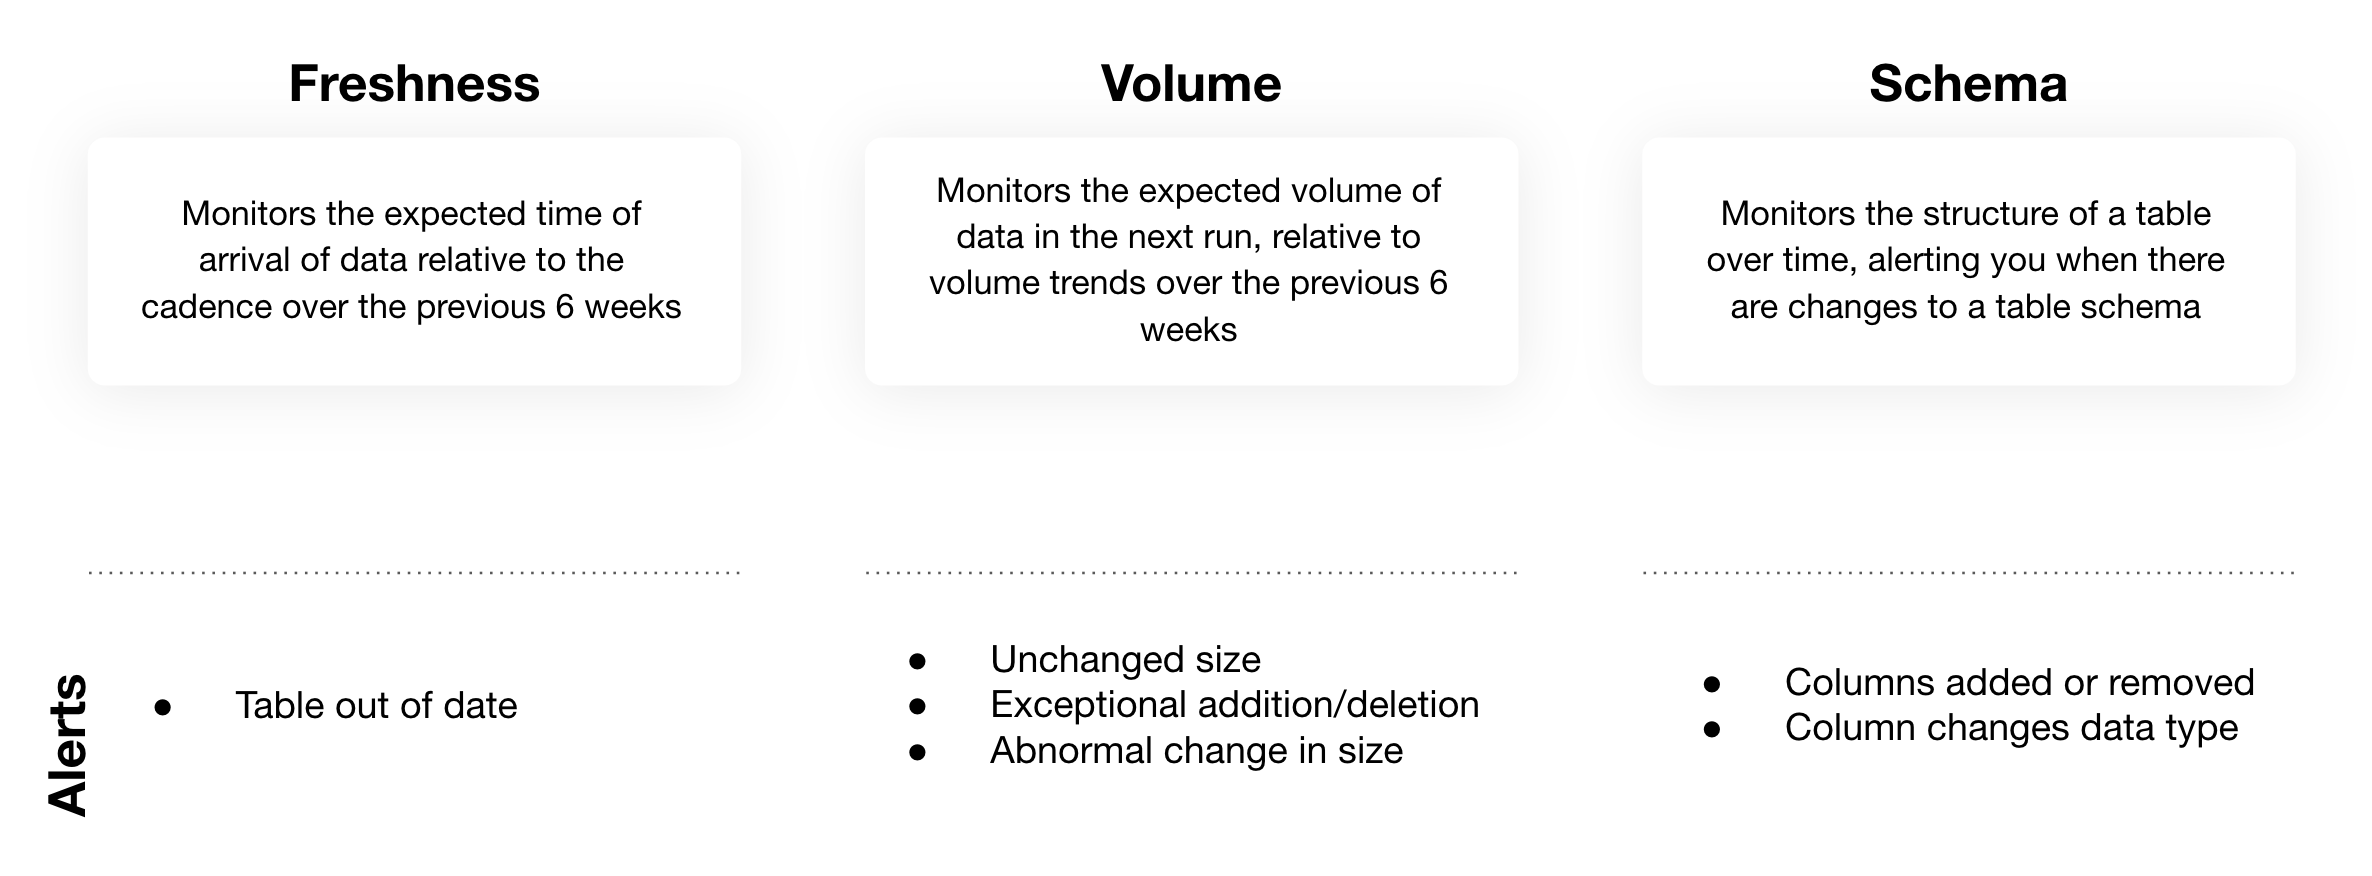
Summary of Monte Carlos automated monitors
There are three different types of automated monitoring alerts. Learn more about each below.
1. Freshness
Our automated freshness monitoring looks at the cadence of updates on a table that have occurred over a period of several weeks, and alerts you when the most current update is out of date by triggering a data incident. Learn more about data incidents here.
You can view the freshness pattern of a table by going to its Assets page and clicking on the Freshness tab.
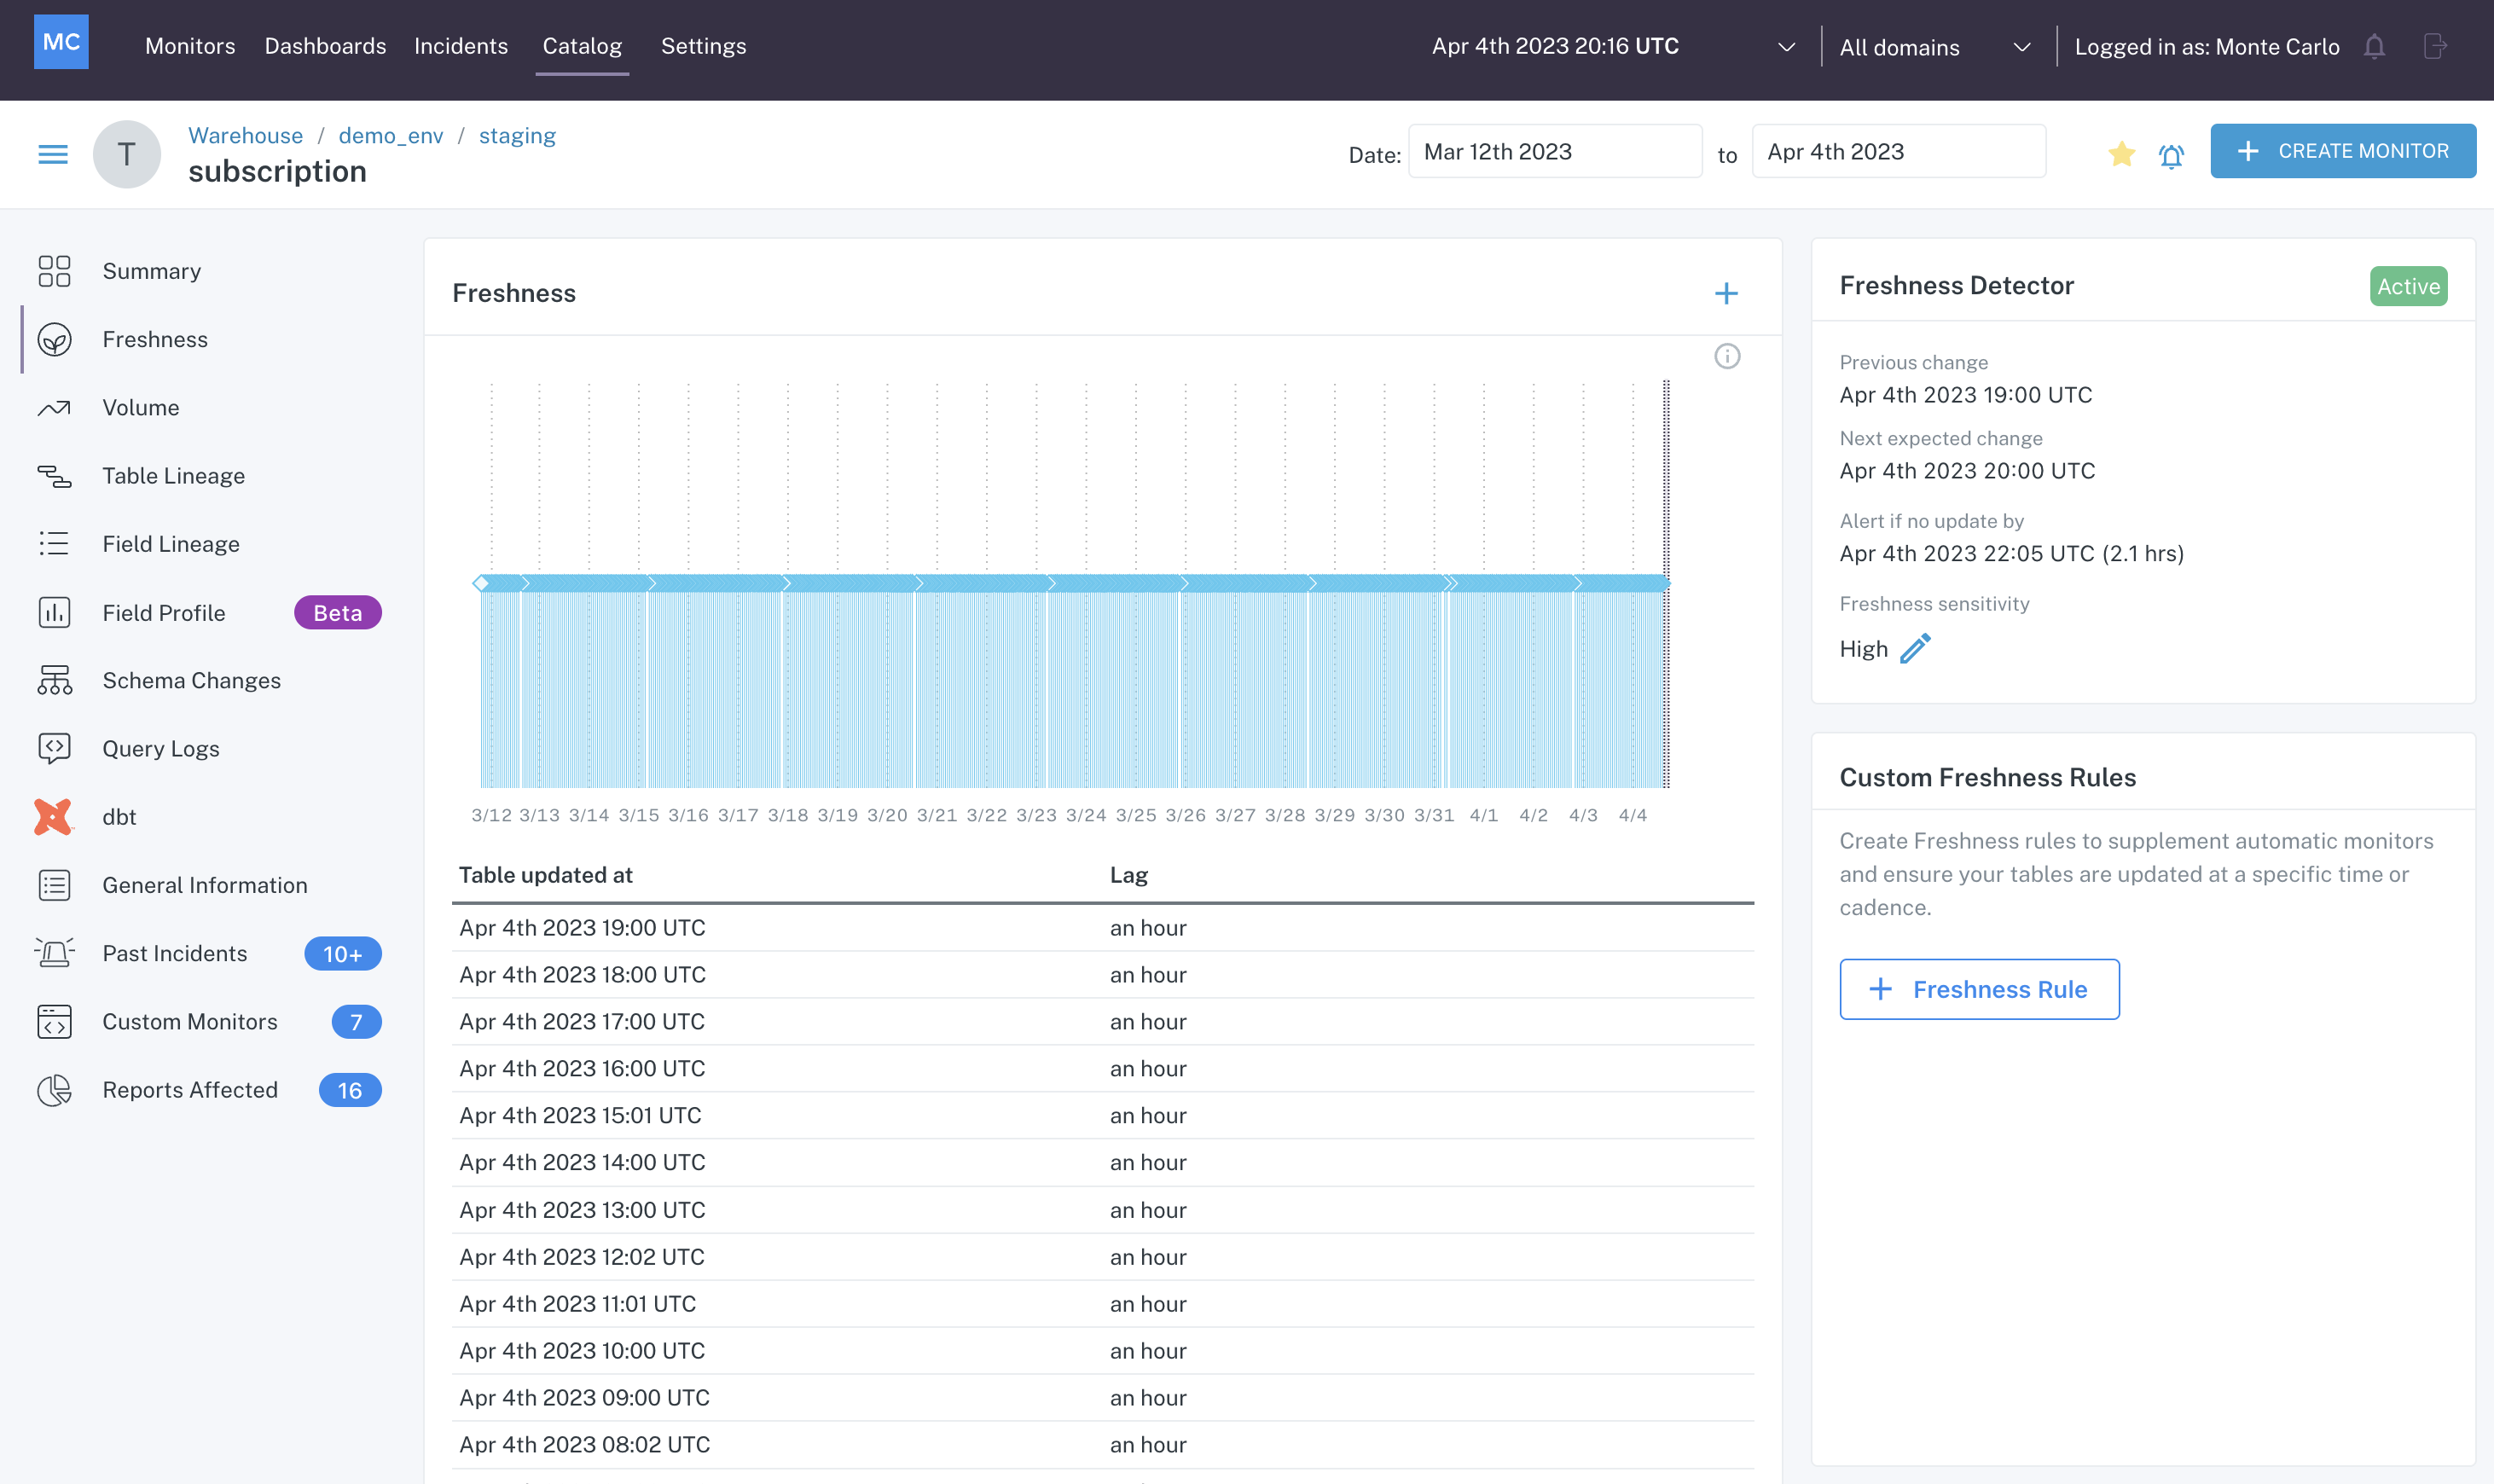
Freshness tab of a table's Assets page
In this case, we can see from the graph that the table subscription updates consistently every hour. To the right of the graph, we can see that the Freshness Detector is active, and look at the last change, the next expected change, and the time threshold that if surpassed will create an incident in Monte Carlo.
From this information we can see that Monte Carlo will create an incident if it has been more than 2.1 hours since the last update. You can also see that this detector has a sensitivity control on it set to High. You can find more about fine tuning automated freshness alerts here.
An example of an automated freshness incident is below.
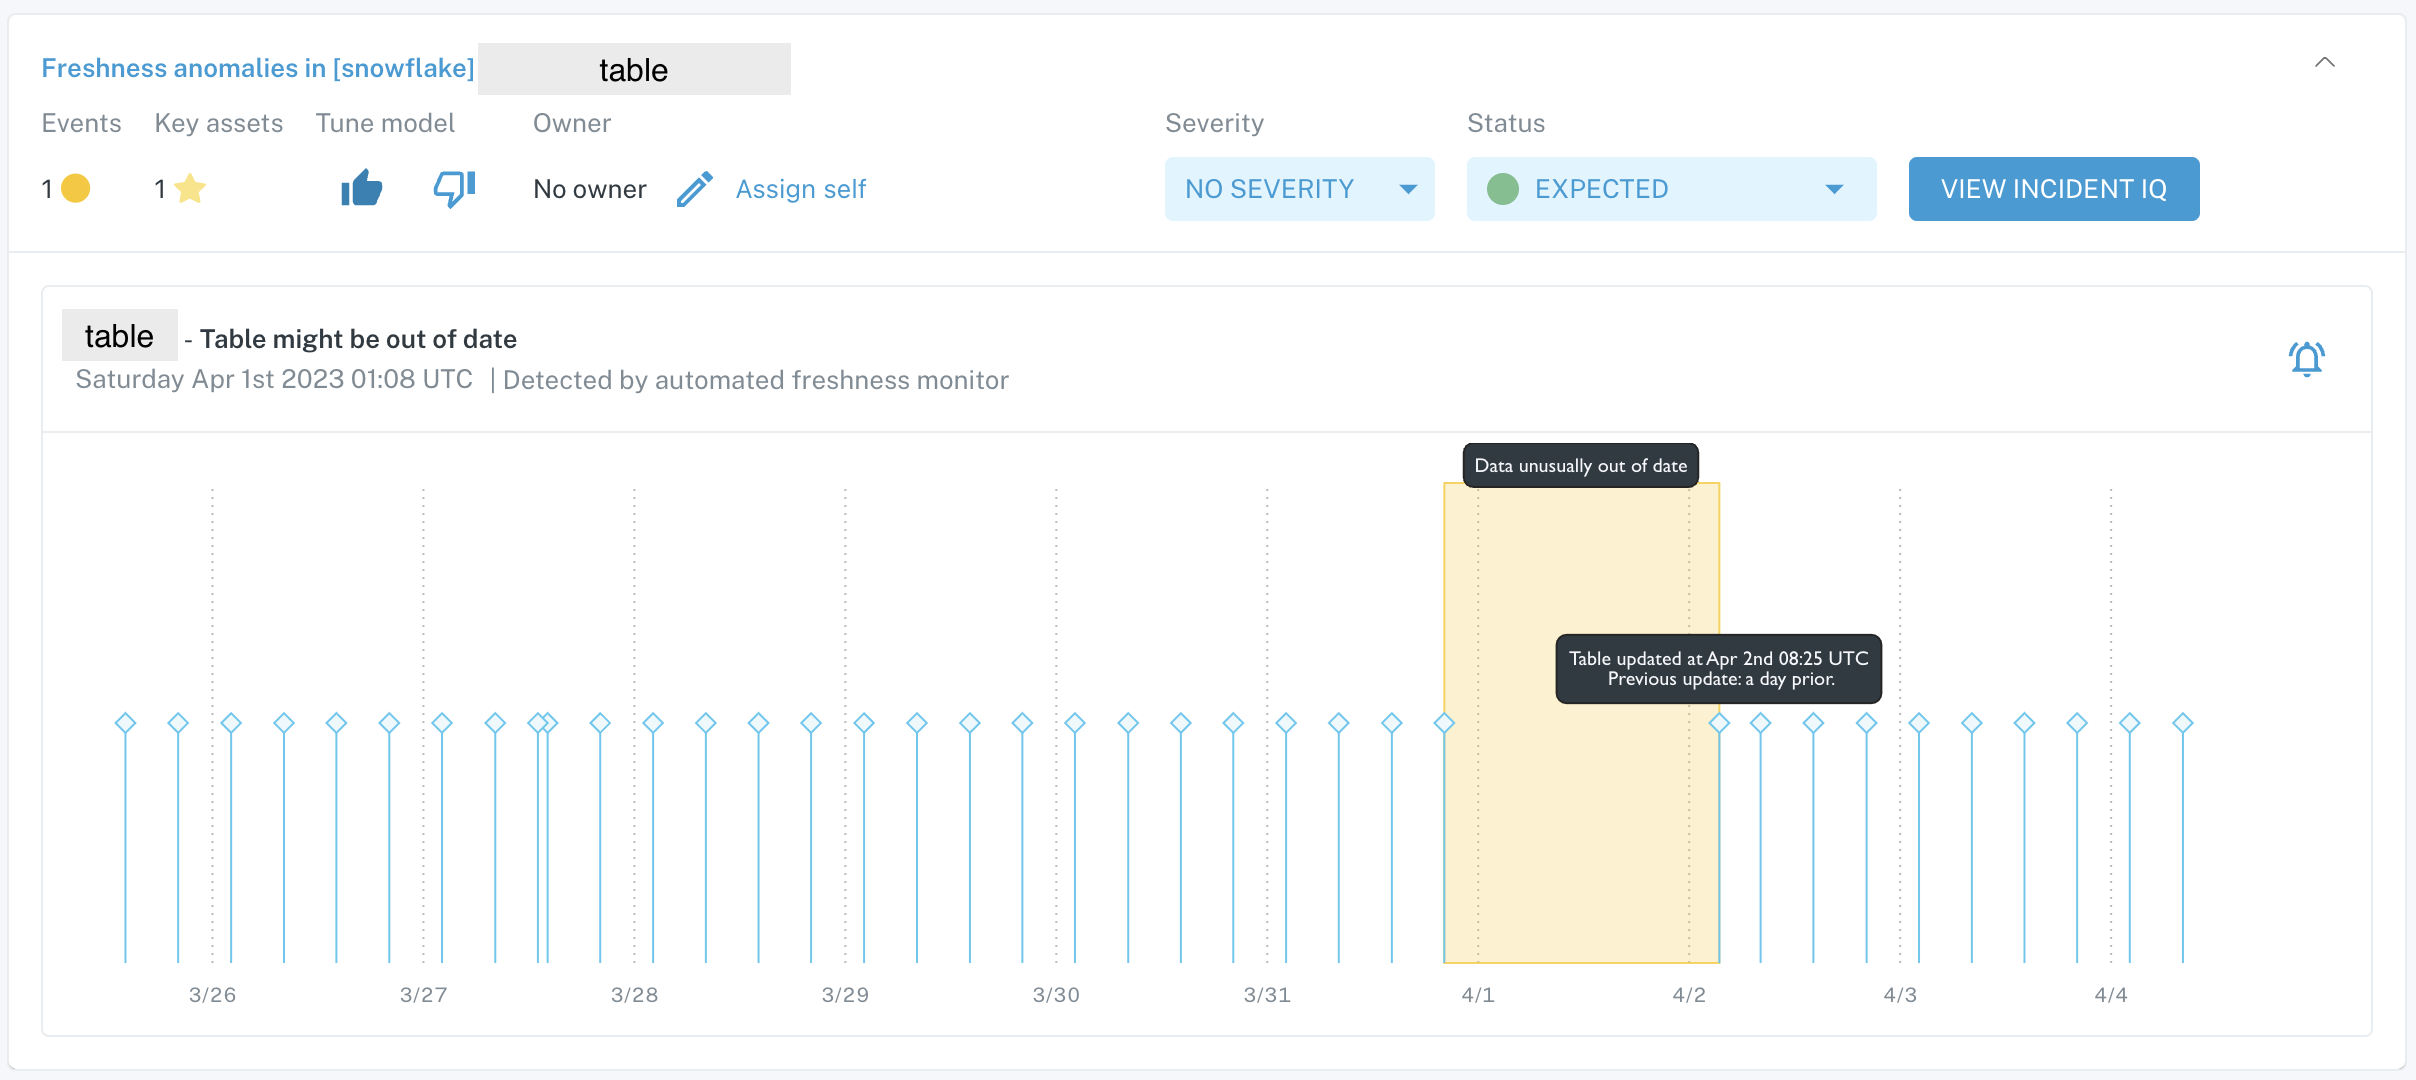
Automated freshness incident card on Incidents feed
This table typically updates every 6 hours and did not receive an update for a 24-hour period which caused Monte Carlo to create an incident. The table then resumed its update pattern, but the lapse in updates during that period of time would need to be check in case of missing data.
2. Volume
Our automated volume monitoring looks at the changes of rows to the table over a period of several weeks, and alerts you when there is no change in table size, there is an exceptional volume addition or deletion or an otherwise irregular row change pattern.
You can view the volume pattern of a table by going to its Assets page and clicking on the Volume tab.
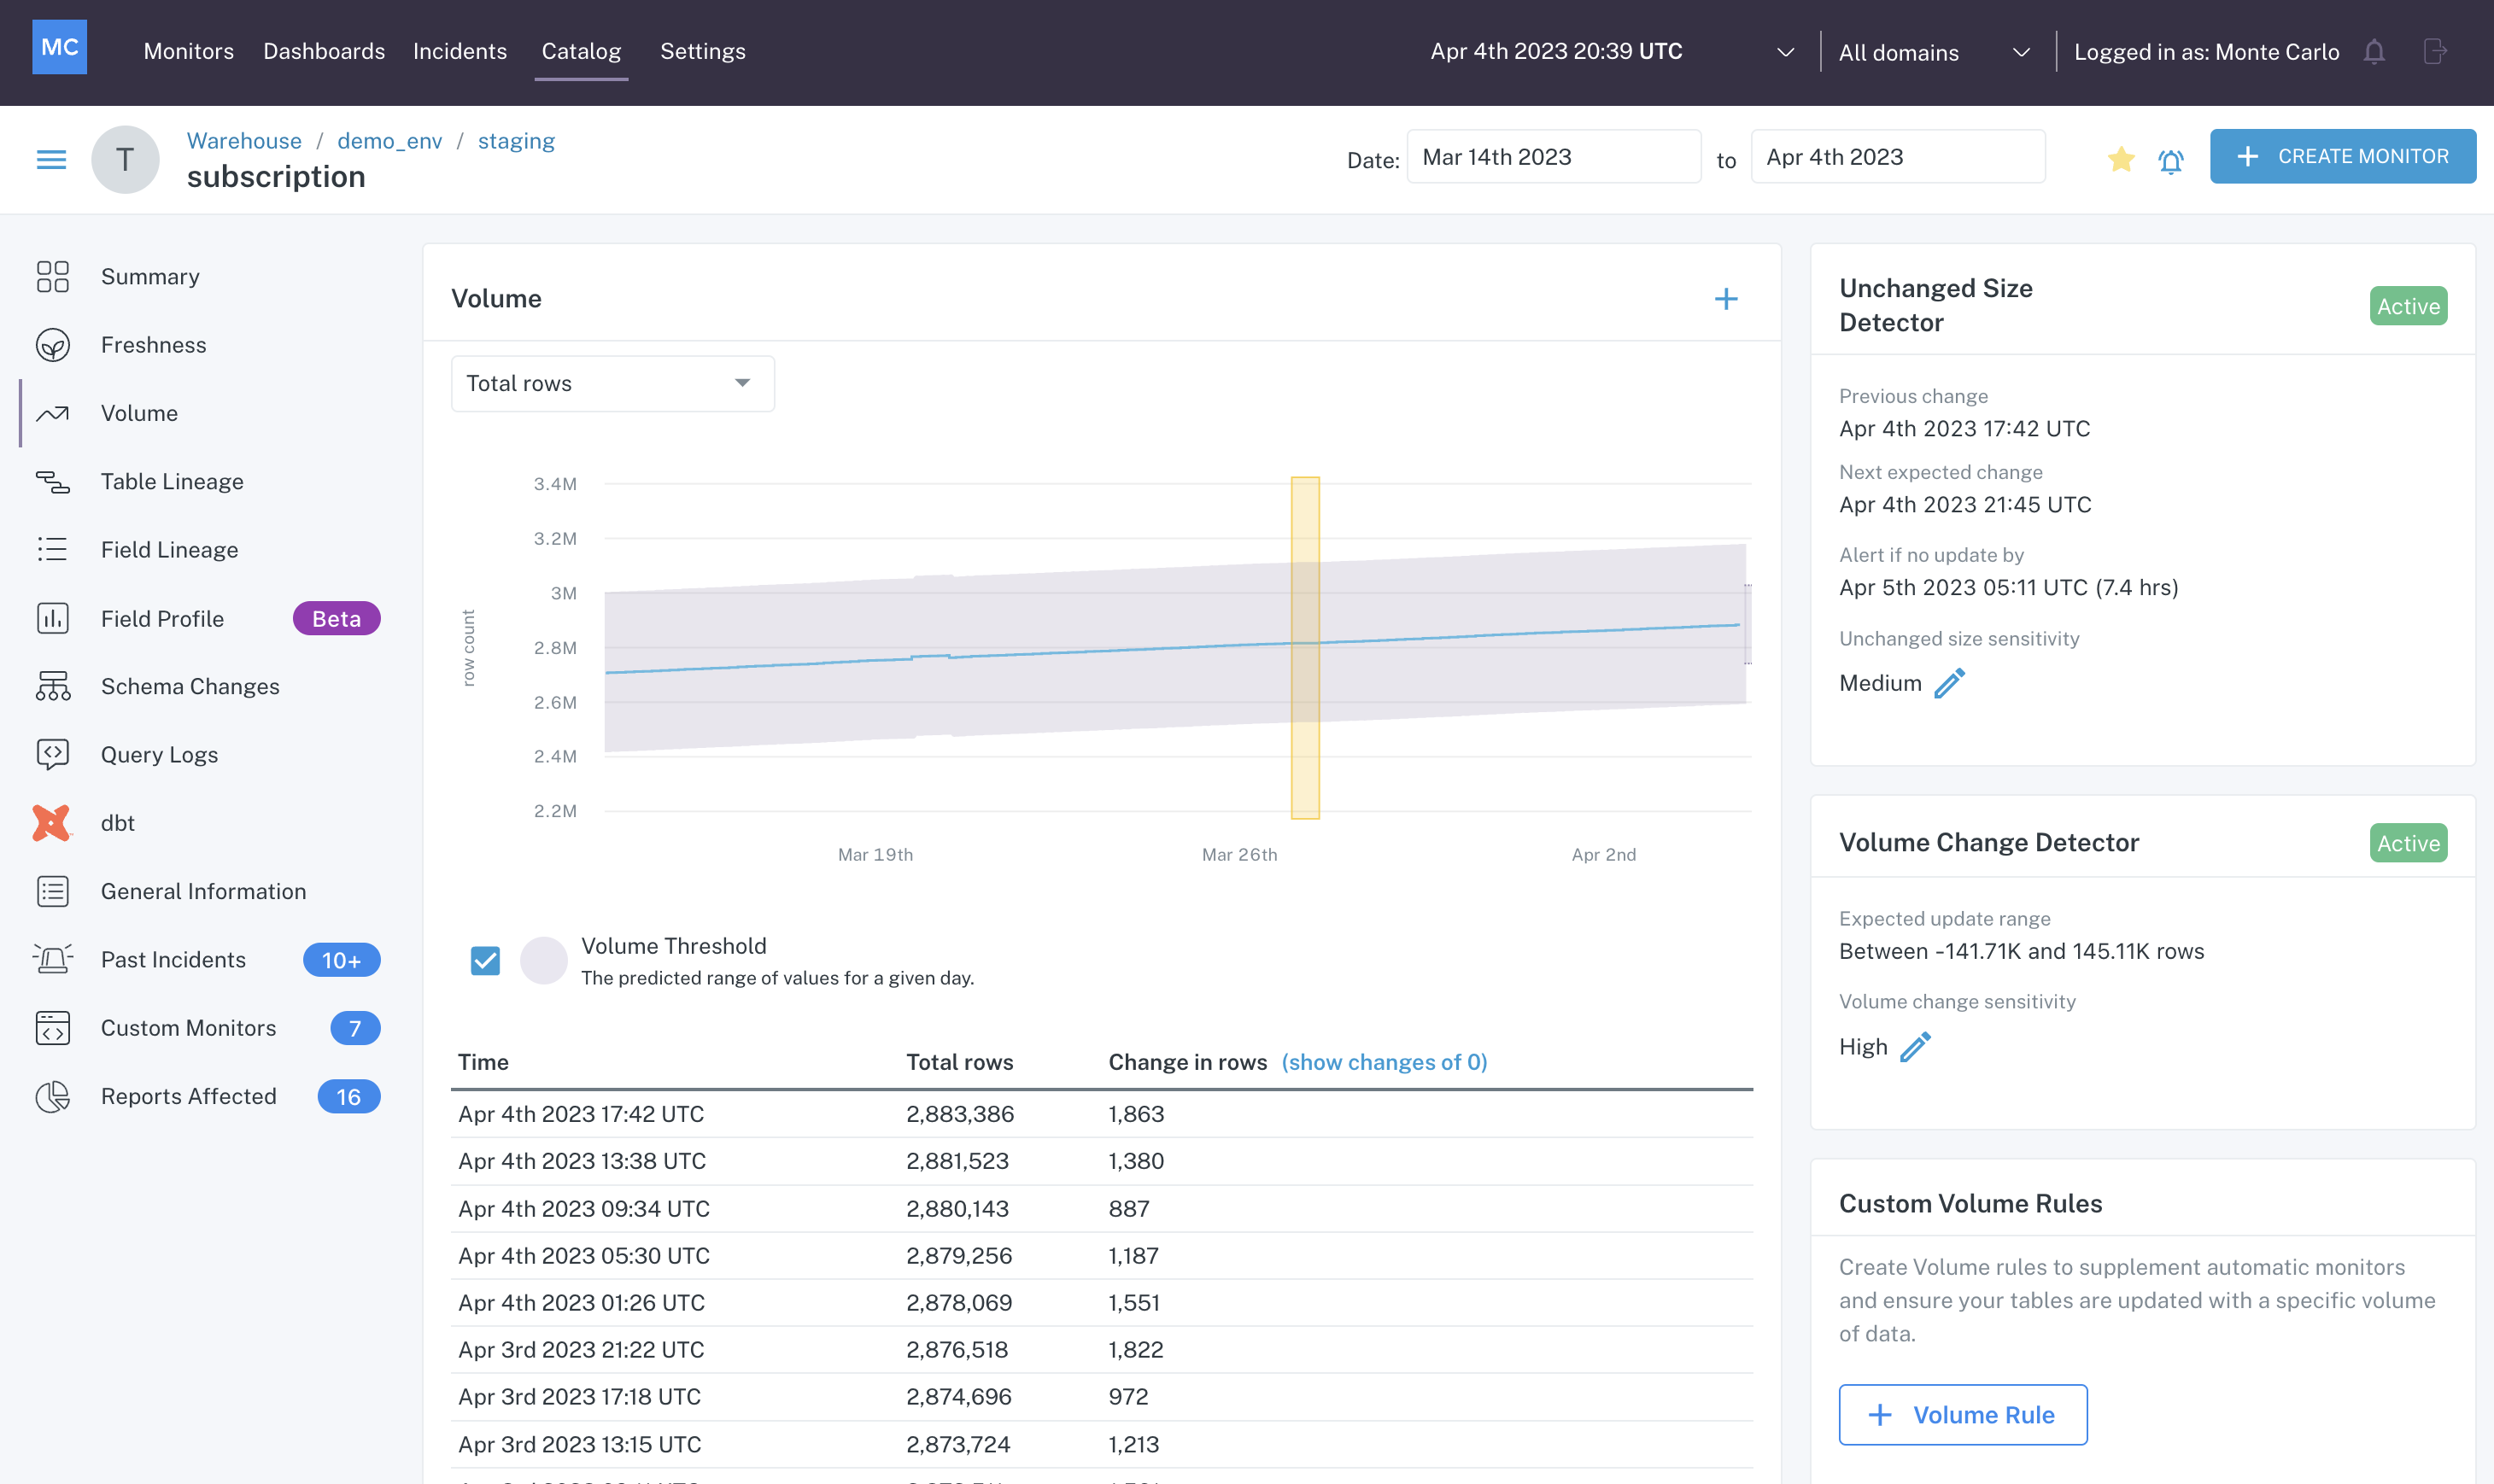
Volume tab of a table's Assets page
In this case, you can see that the table receives a few updates a day where it is consistently adding rows. There are two detectors for our automated volume monitoring — unchanged size and volume change.
The unchanged size detector builds a threshold to alert by a certain time if there is no change in rows seen, and the volume change detector builds a threshold to alert if the row change that does come falls outside of the expected upper and lower bounds.
You can find out more about these detectors here: volume change detector, unchanged size detector.
An example of an automated volume incident is below.
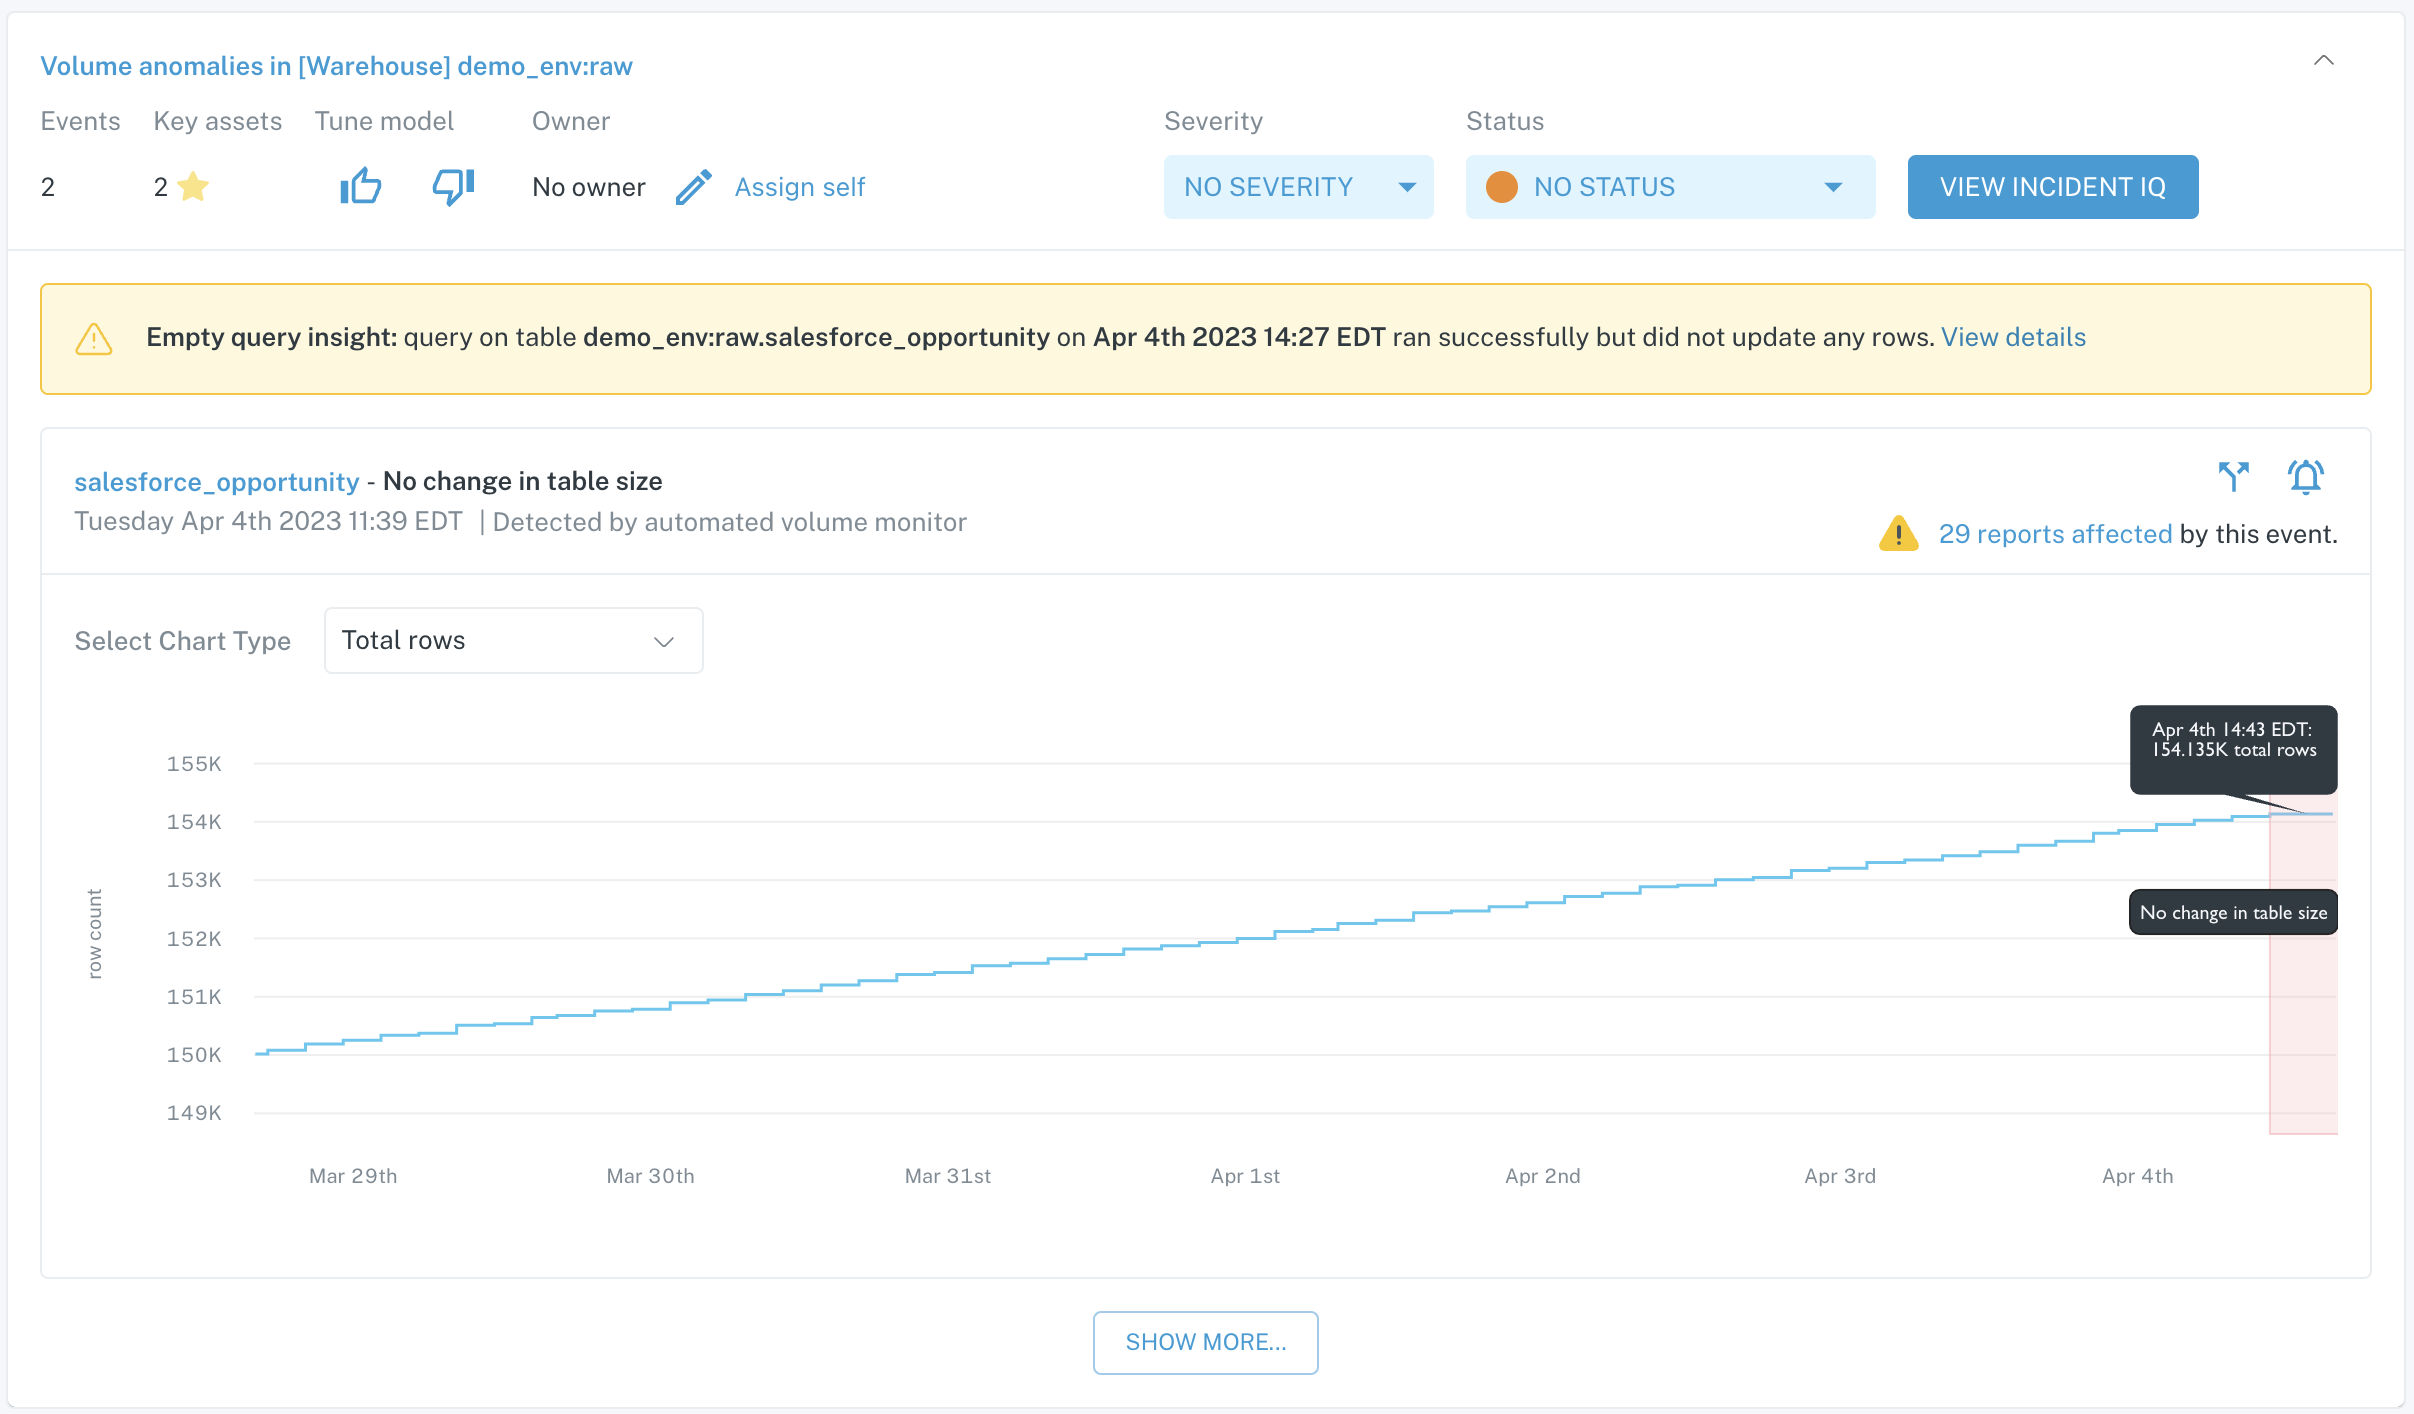
Automated volume incident card on Incidents feed
This incident was created because there was no change in table size for an unexpected period of time. Checking on the expected thresholds in the Volume tab of this table's Assets page would give us a better idea of what updates were expected that did not occur for this incident to be created.
3. Schema
Our automated schema monitoring looks for changes in the structure of a table or view, like columns added or removed, or their data types changed.
You can view the current composition of a table (and the lineage of fields) on the Field Lineage tab of the table's Assets page:
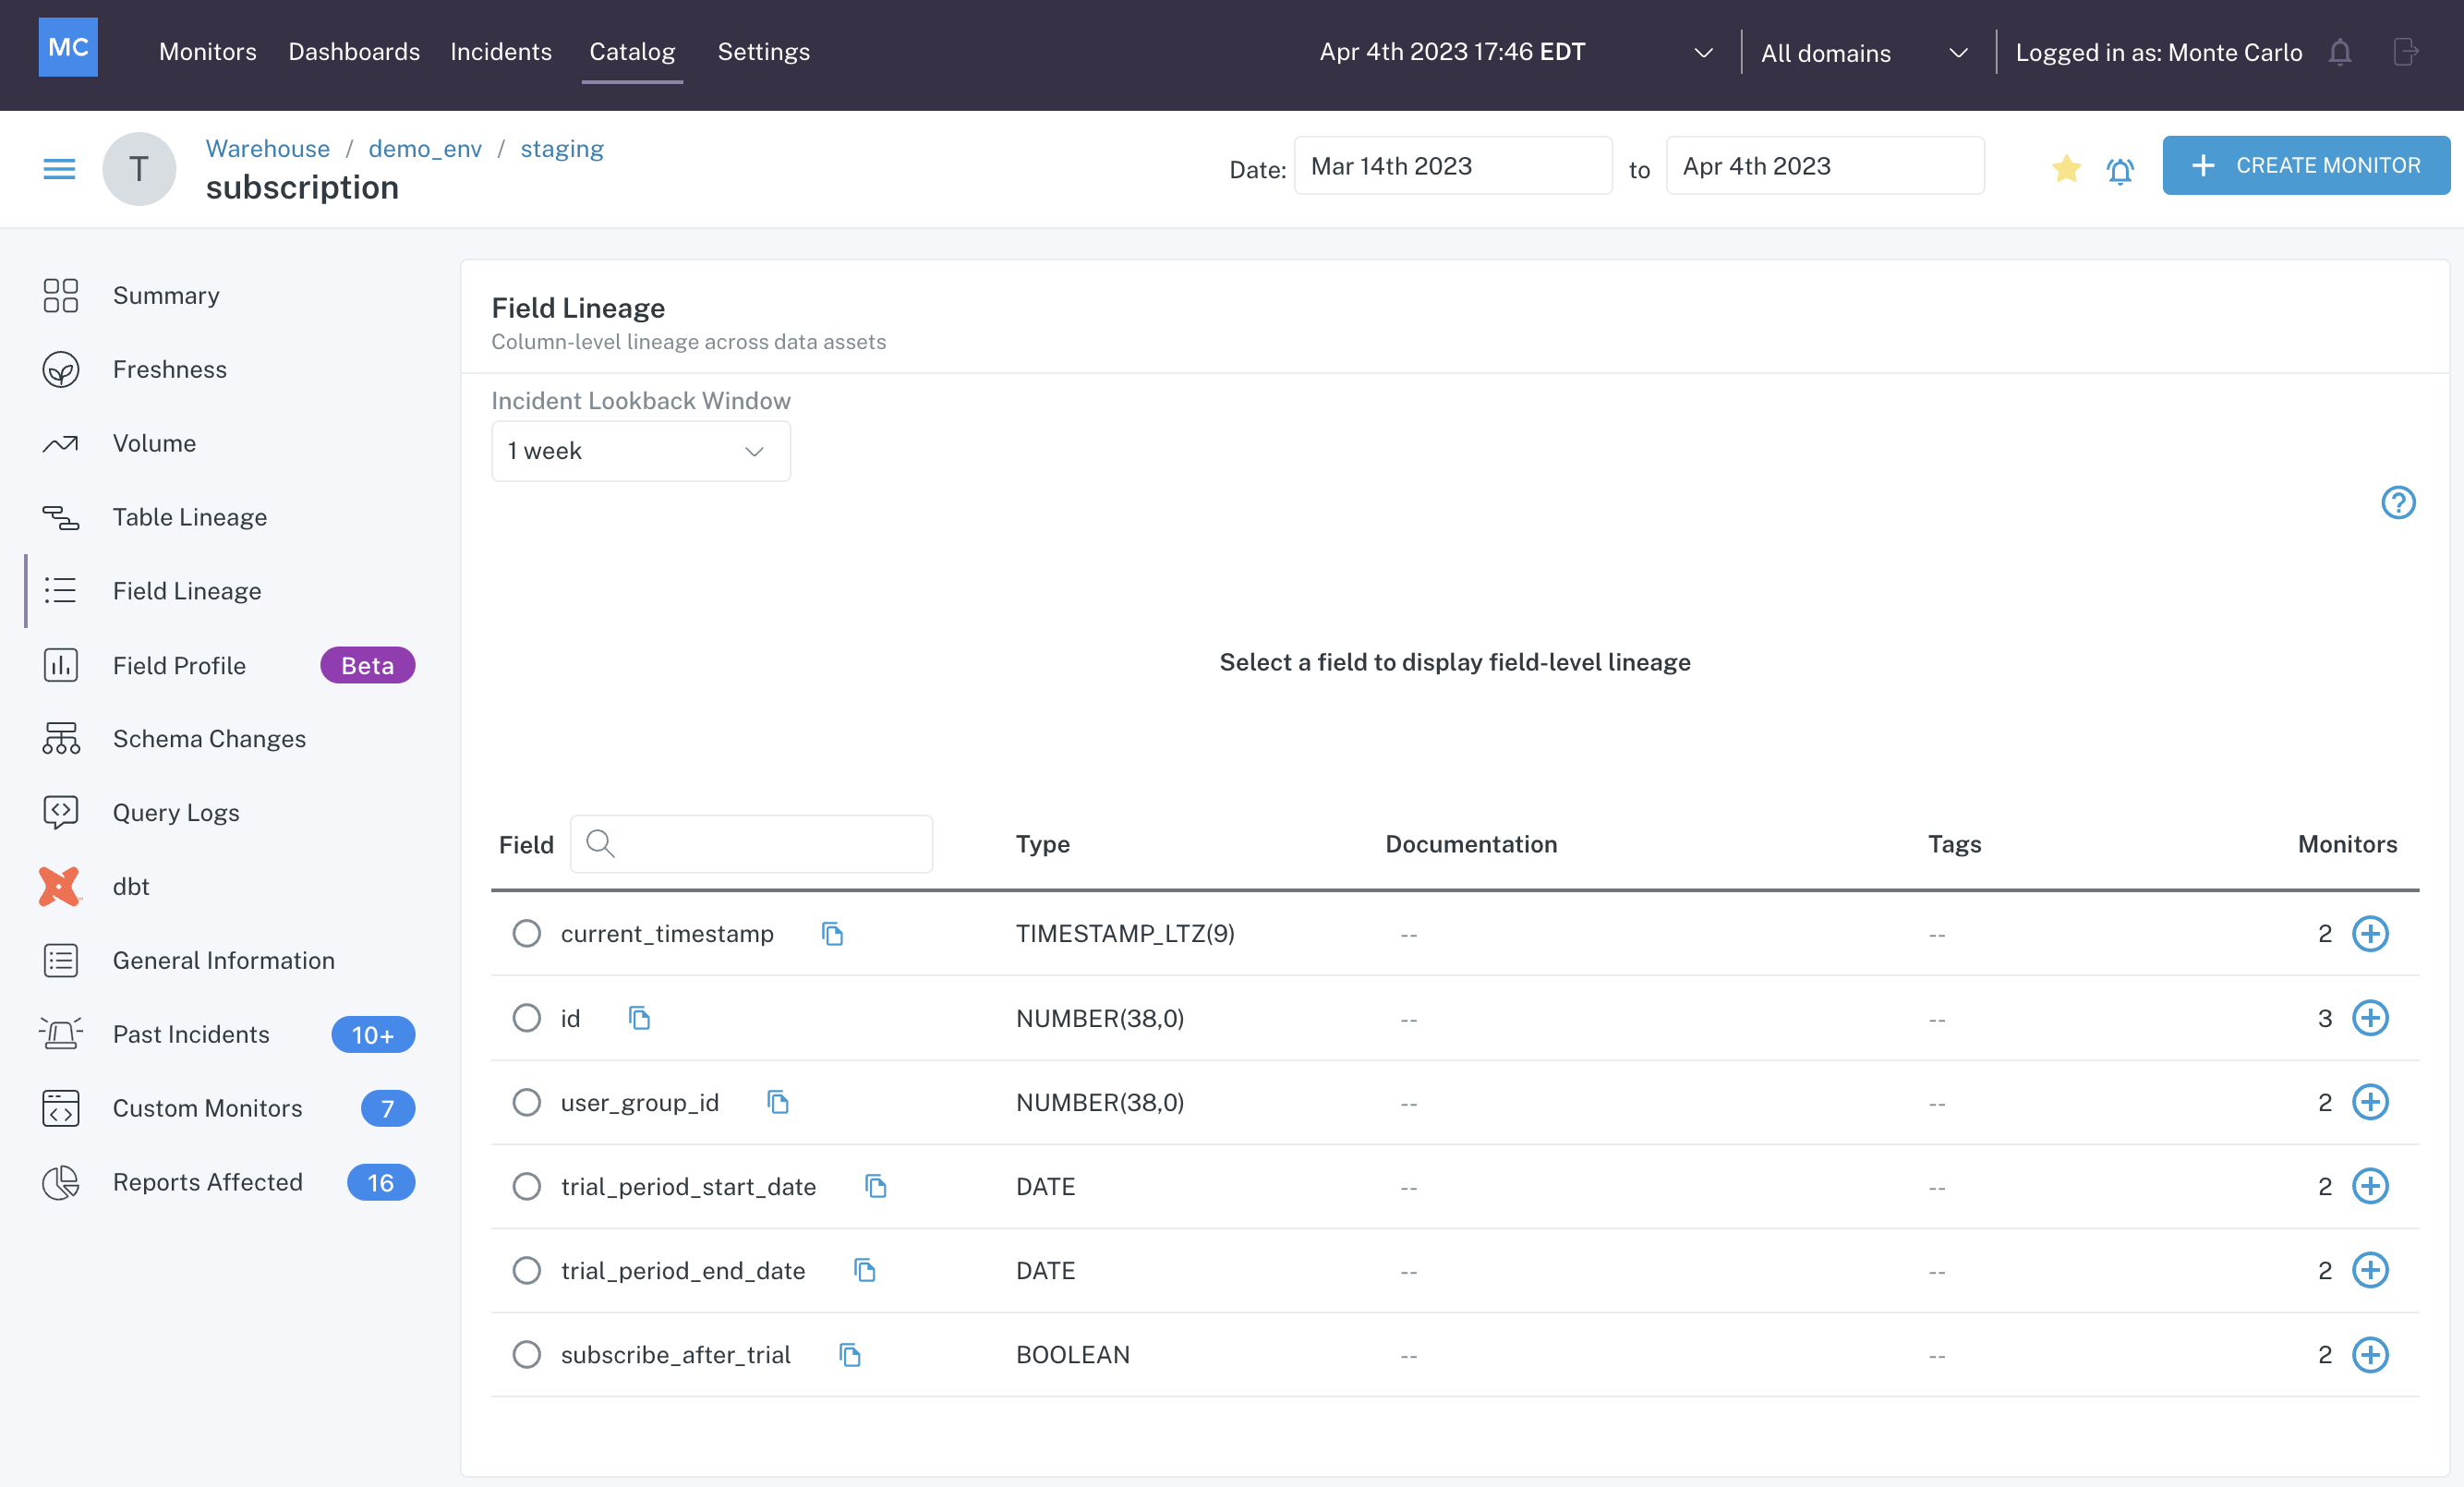
Field Lineage tab of a table's Assets page
This view shows you what columns are in the table and what their data types are. You can also click on an individual field to see how it is used upstream and downstream of this table.
The Schema Changes tab will show you any changes to columns that have occurred in the past. The View Current Schema button is another place where you can see a list of columns and their data types.
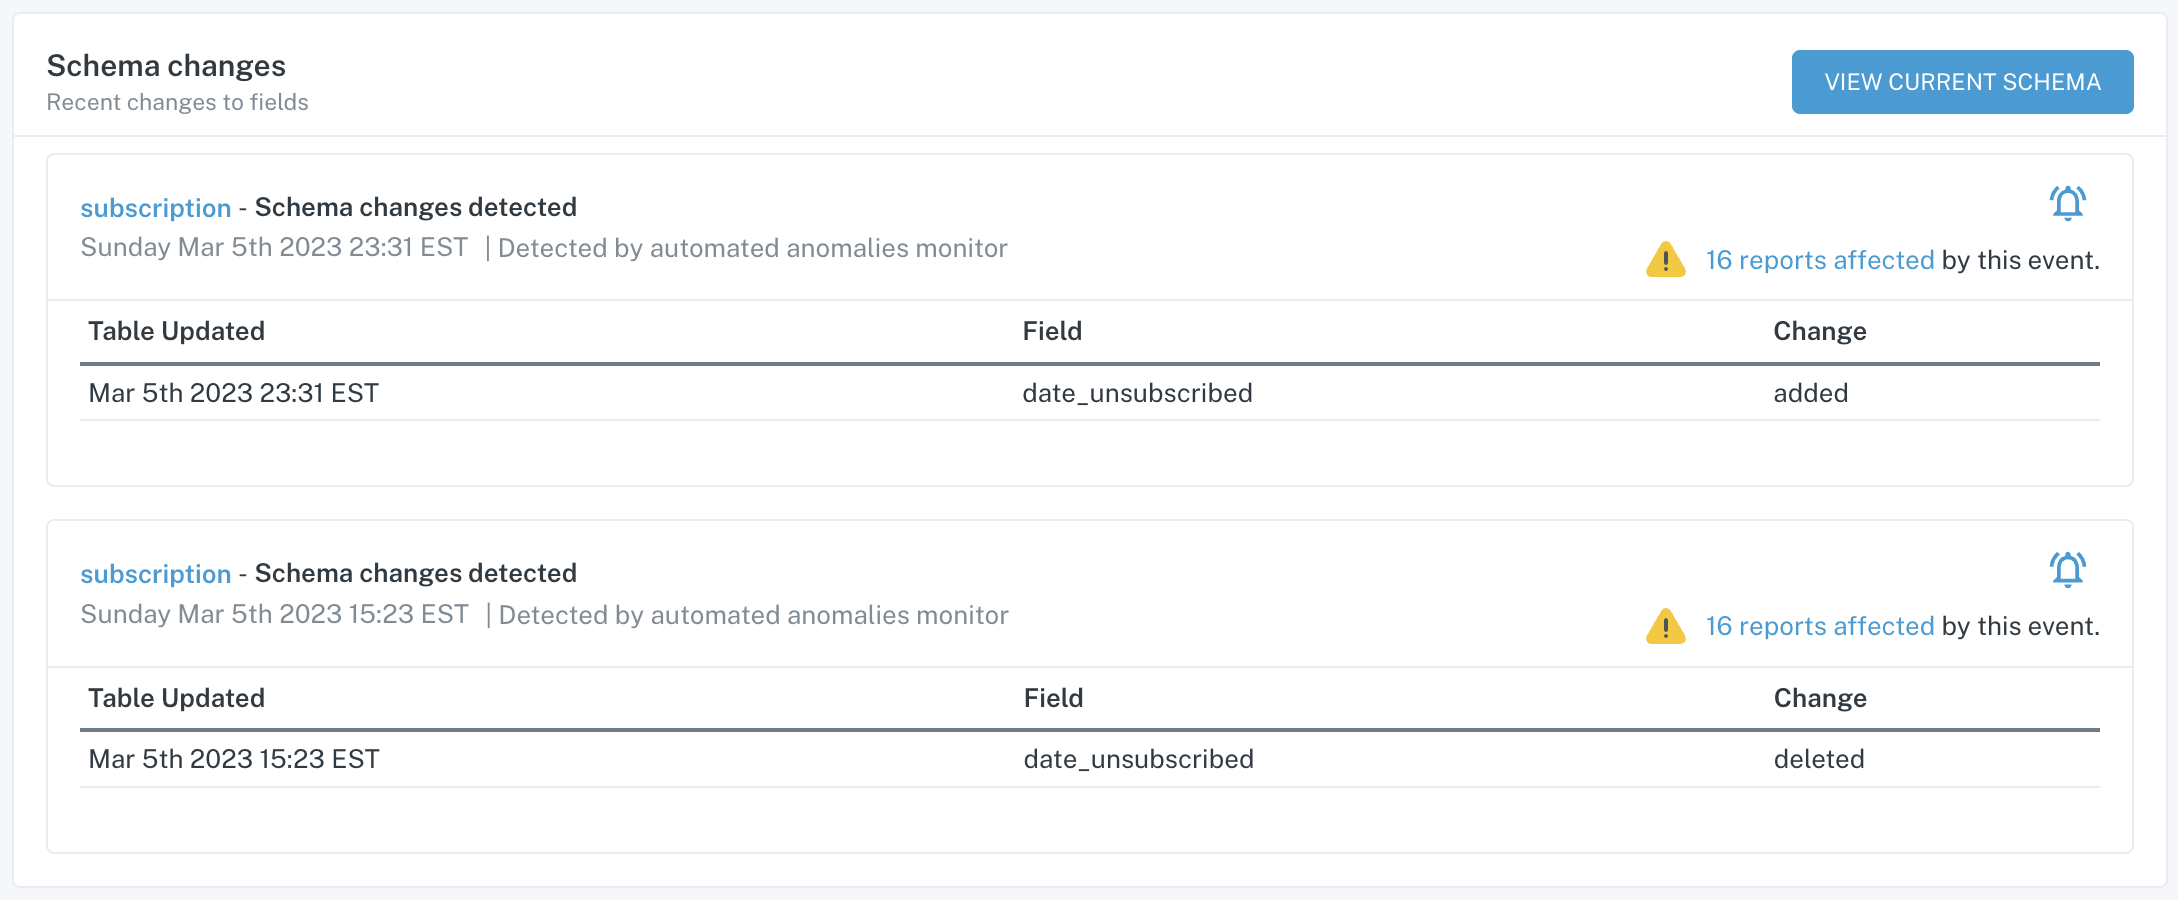
Schema Changes tab of a table's Assets page
An example of an automated schema change incident is below.
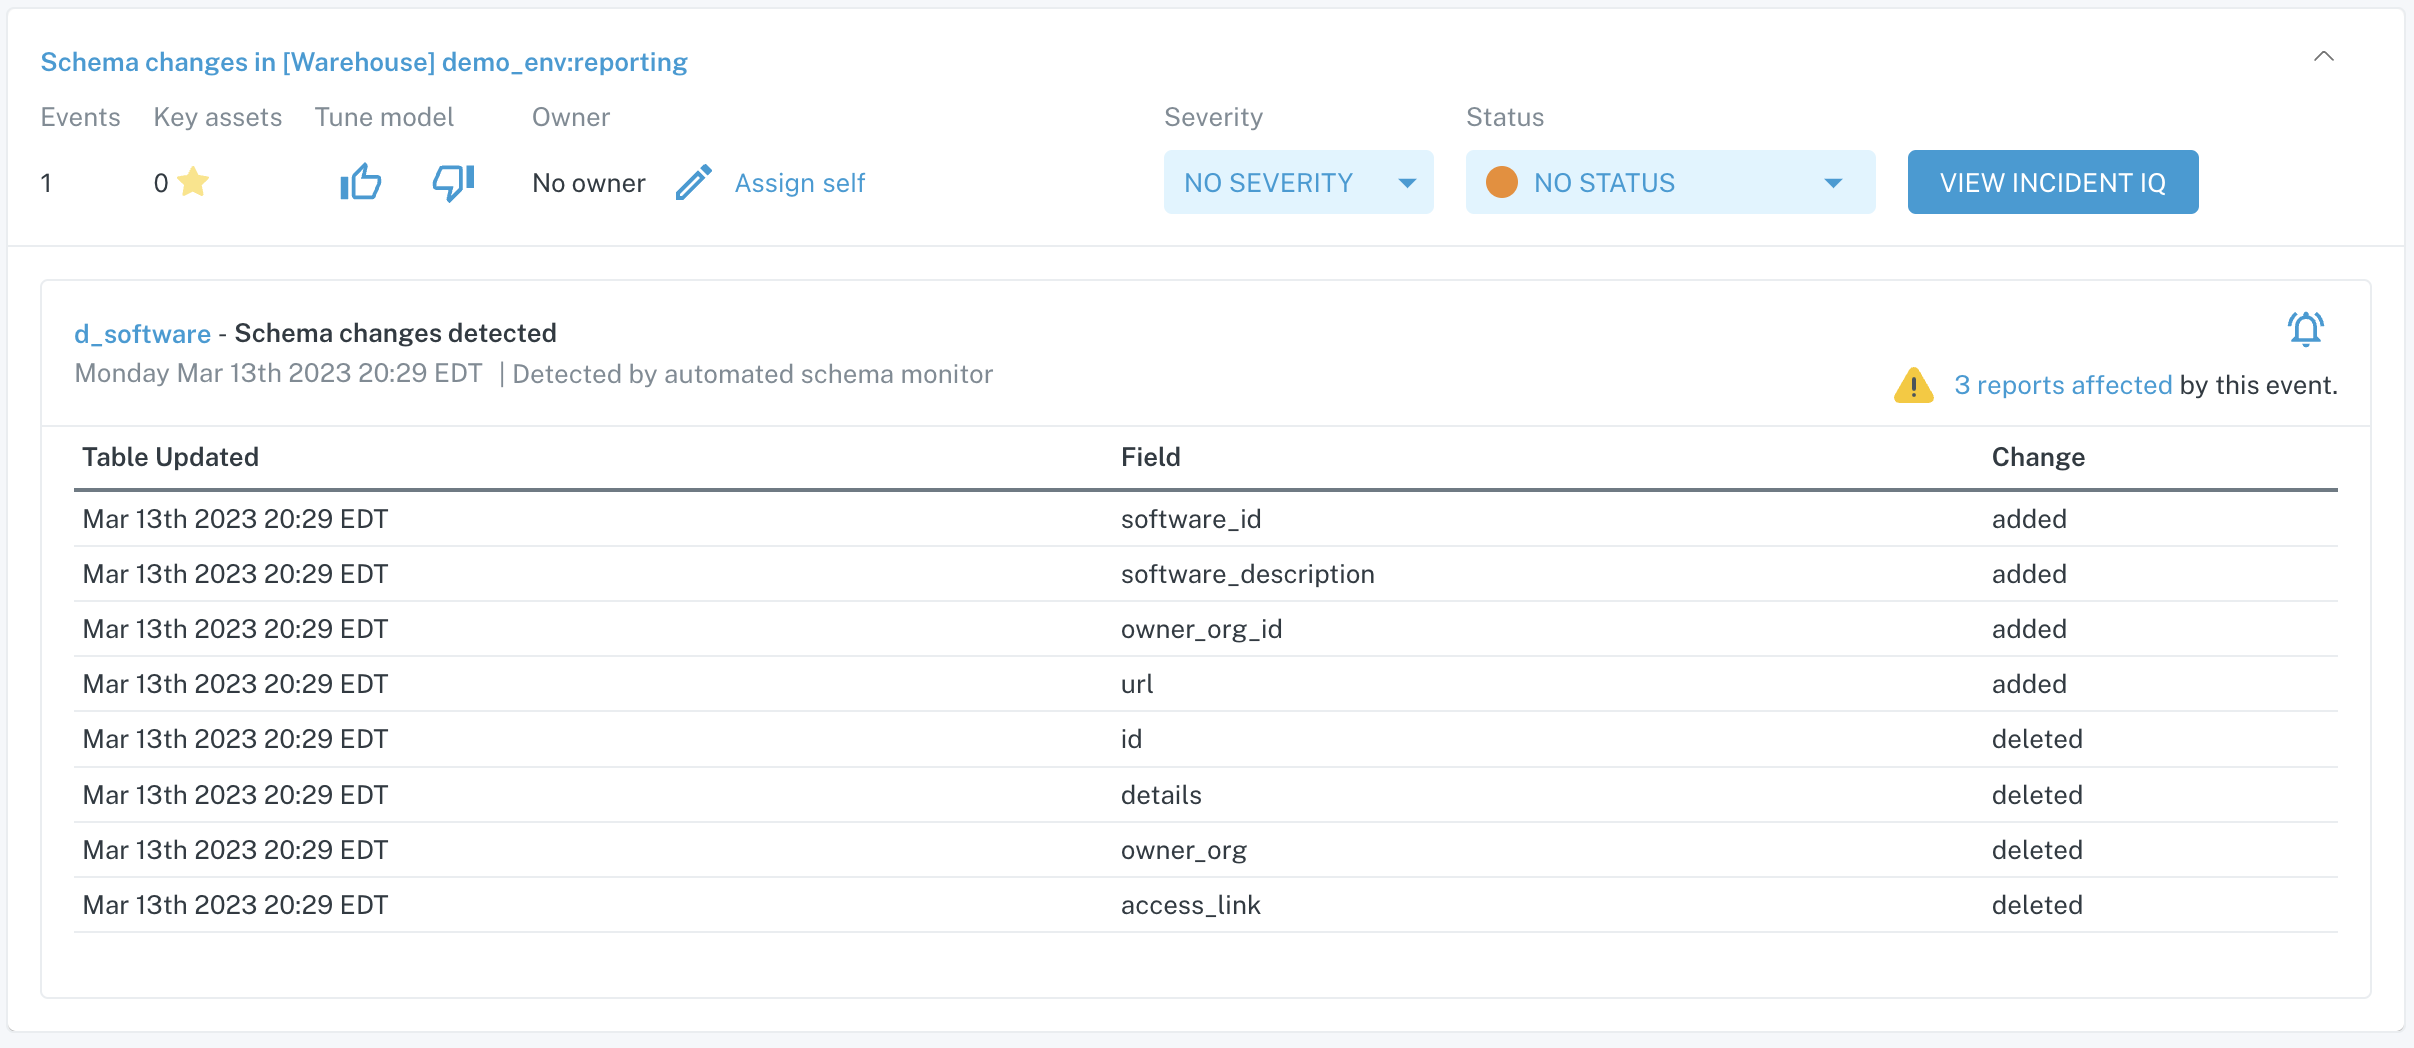
Automated schema change incident card on Incidents feed
In this incident, you can see that 4 columns in the table were added and 4 columns were removed.
Frequently asked questions
Do all of my data assets get automated monitoring?
Automated monitoring applies to all tables in your warehouse. Due to the stateless nature of views, only automated schema monitoring is applied.
Why does my table have inactive freshness and volume detectors?
Automated volume and freshness monitoring requires that tables are updated frequently (i.e. they get at least a few updates a week). You may notice that some of your tables have inactive freshness and volume detectors. This is likely because they aren't getting enough updates or their update pattern is too irregular to build anomaly detection on top of. In these cases we recommend that you use Freshness Rules and Volume Rules.
How far back does the ML go to build thresholds?
Automated freshness and volume monitoring use a rolling 6 week lookback period.
How do I get automated volume monitoring on views?
The workaround that you can use in Monte Carlo to get automated volume monitoring on views is to use Field Health Monitors which will proactively look for cases where there is an unexpected volume drop and alert you to it.
Updated about 1 month ago