Added
Databricks Integration Upgrade
almost 2 years ago
With the availability of SQL query history, a series of features for Databricks integration are added:
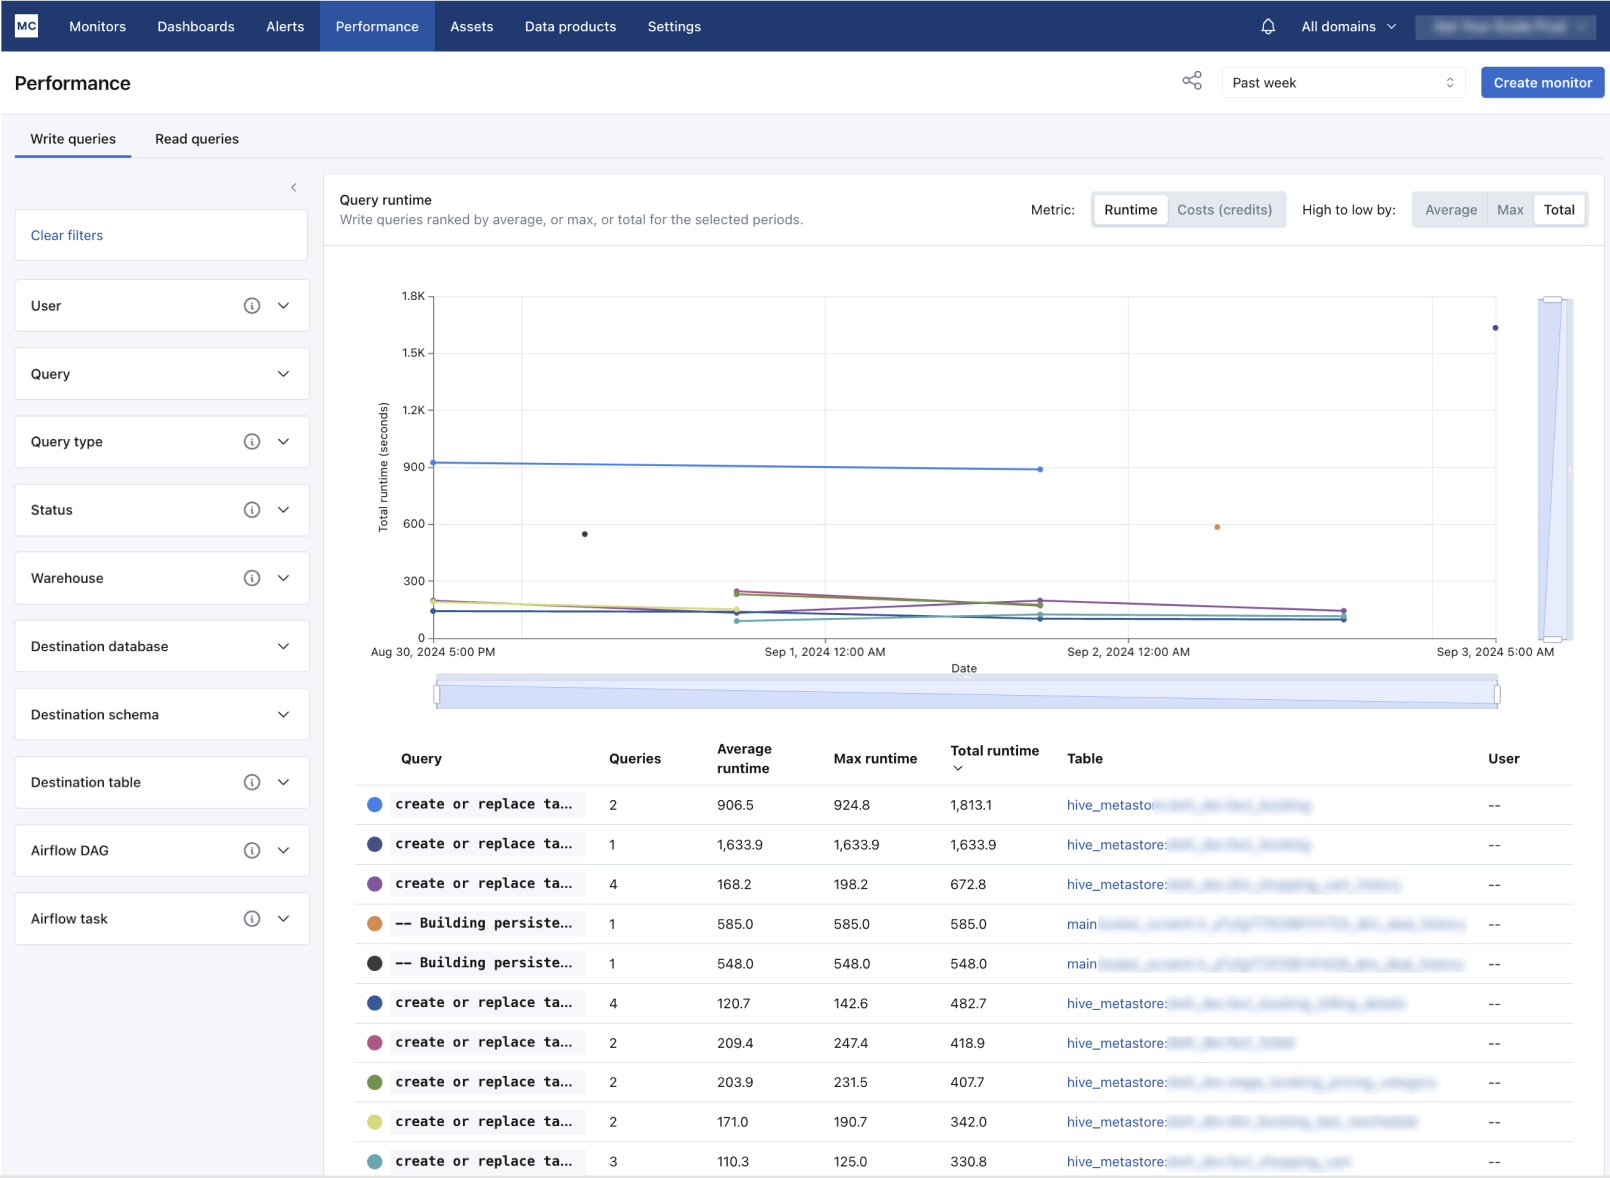
- Performance dashboard and monitors: the dashboard helps identify the slowest SQL queries and enables investigation on performance issues. Users can also use performance monitors to detect slow running SQL queries.
- Importance scores: estimates the importance (0 to 1) of assets based on various query history data (see details here).
- Usage stats: usage information like reads/day, writes/day, users etc are now available on the "assets" page, "general information" tab.
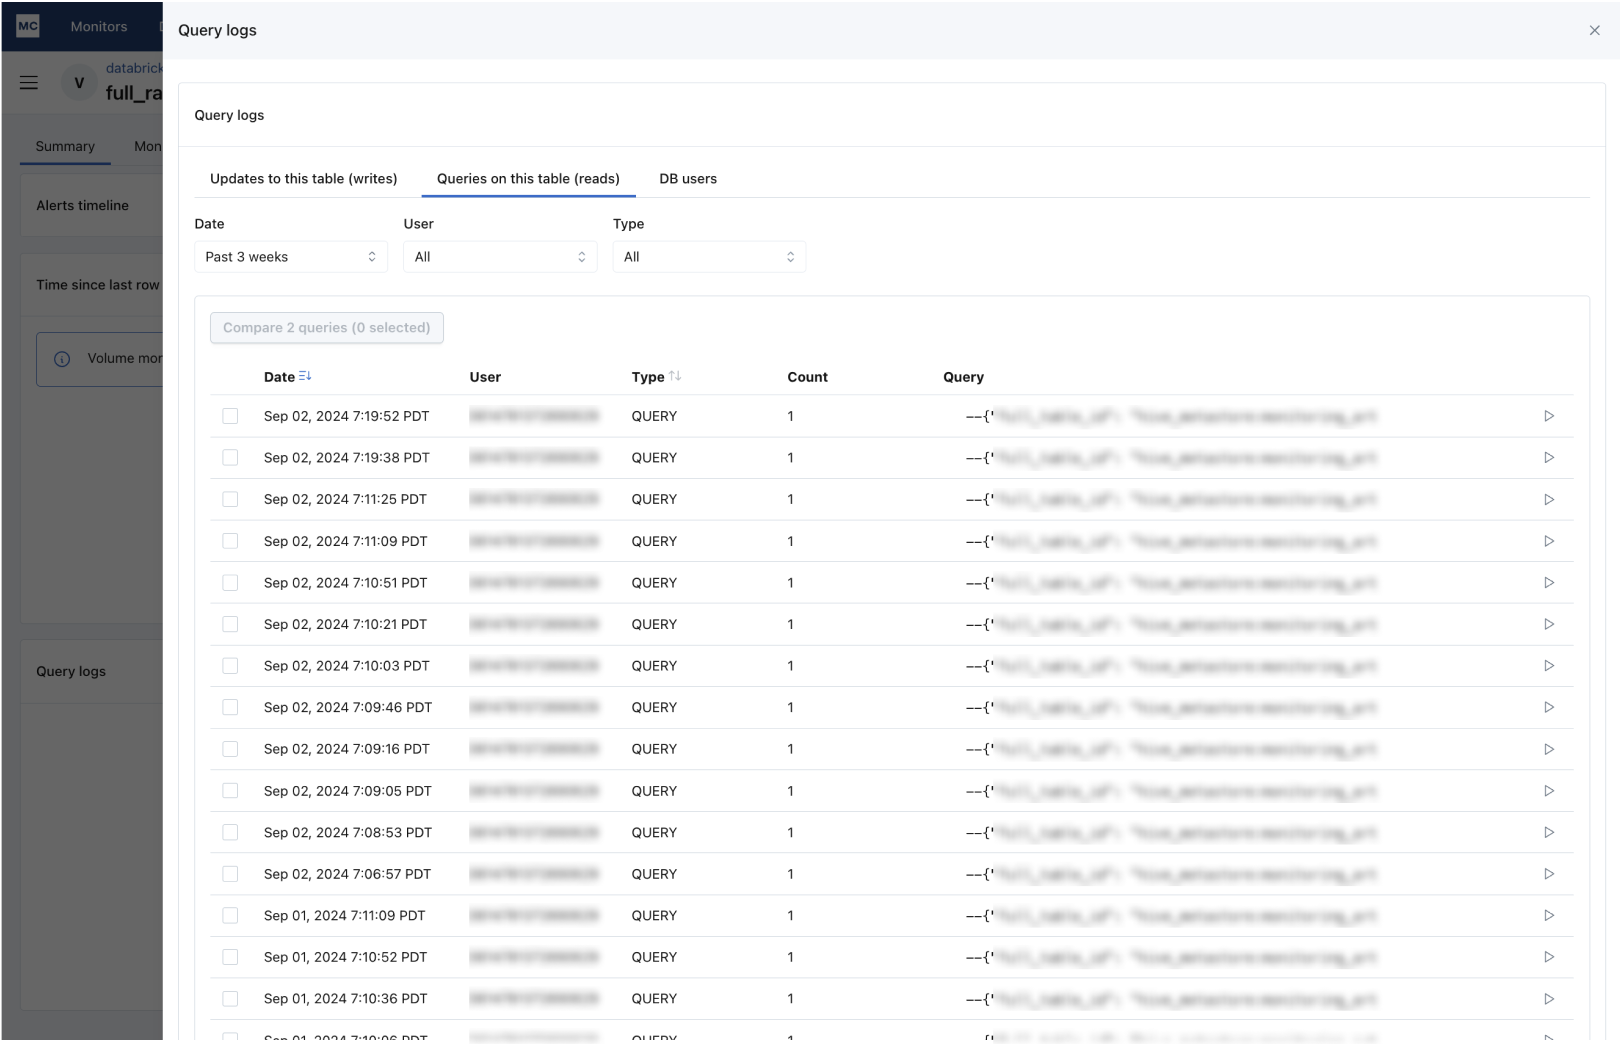
- Query logs: SQL query logs are now shown on the assets page
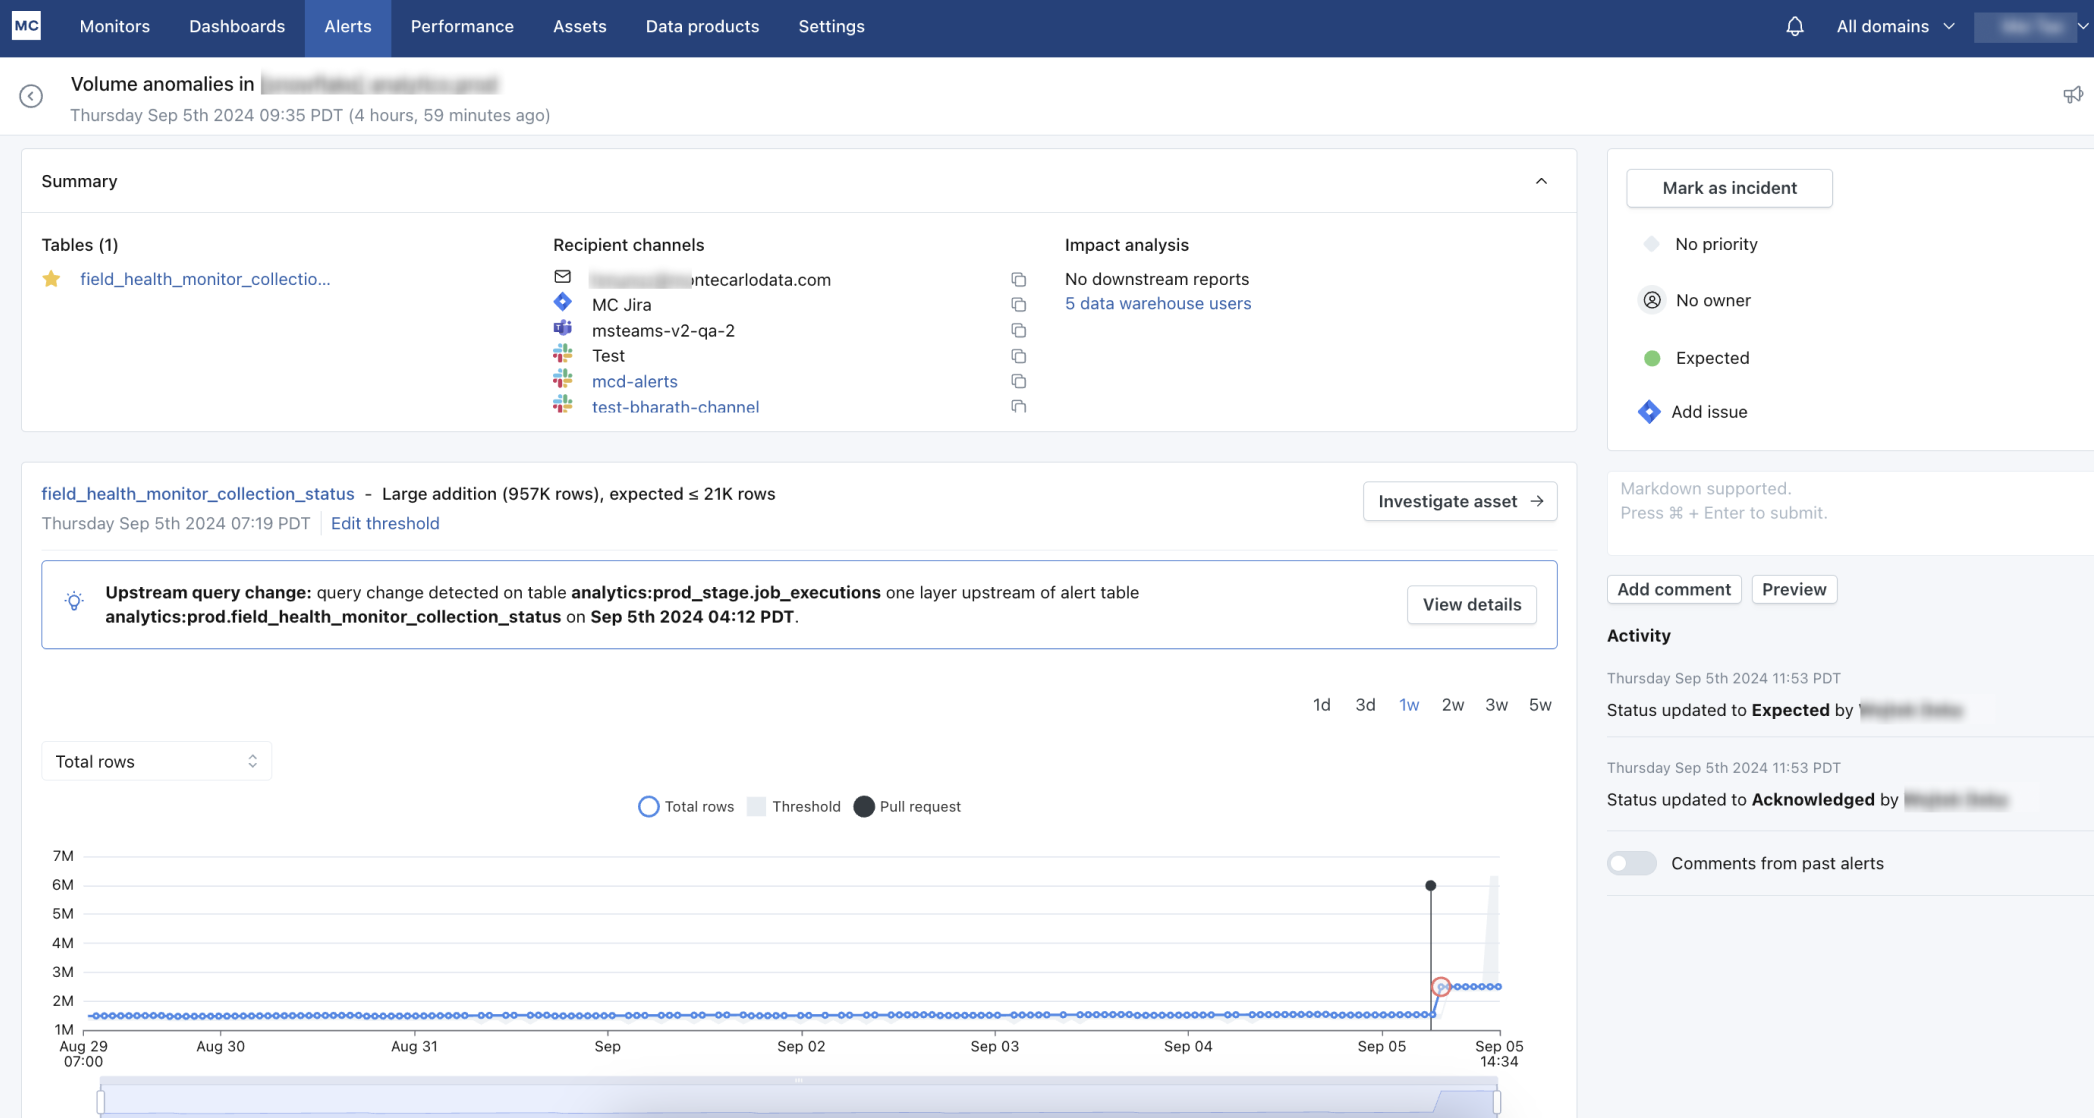
- Query Change RCA insights: associated SQL query changes are presented for a volume / freshness / field alert to help uncover query related root causes.
Limitations: note these features are available for assets on Unity Catalog and are constrained to SQL queries. If you are using customer-managed keys in Databricks, these features also will not be supported.
Setup required: In order to enable these features, read permission needs to be granted to the service principal for system table system.query.history. This is also described in docs here.
GRANT SELECT ON system.query.history TO <monte_carlo_service_principal>;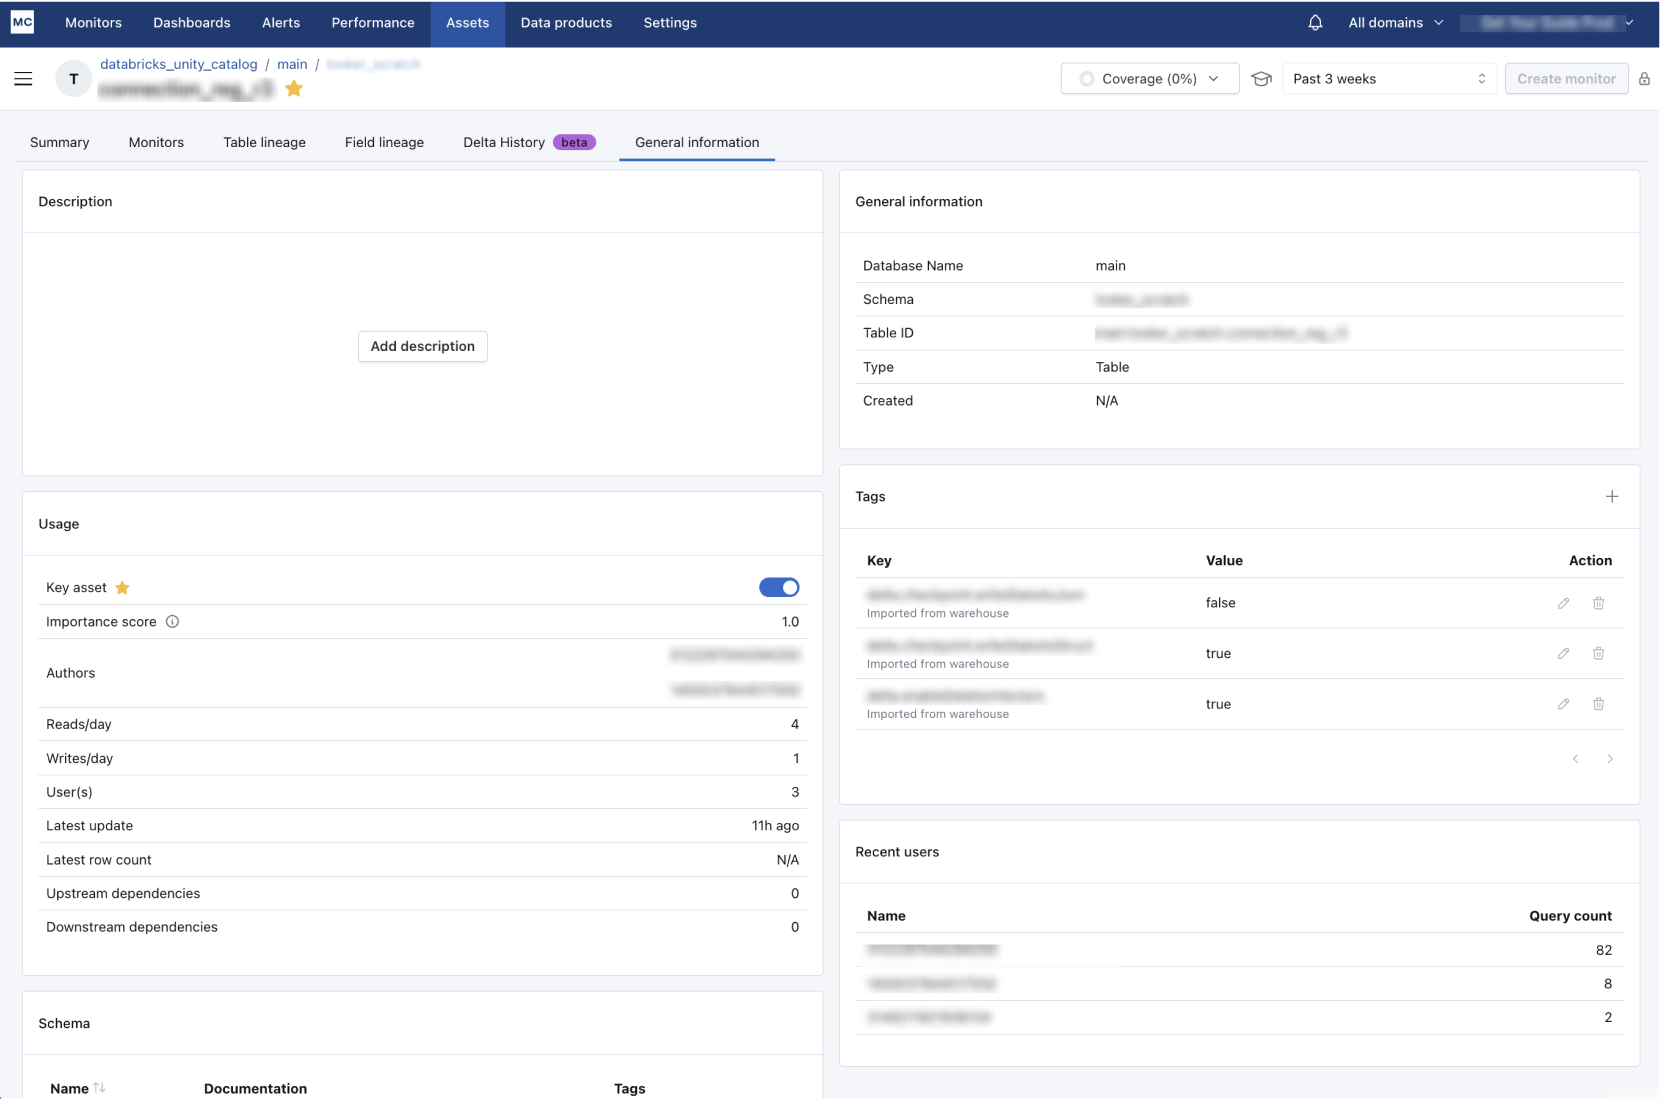
Usage stats
Performance Dashboard for Databricks SQL queries
Databricks Query Logs
Query Change Insights in Incident