Major changes to interacting with Metrics and Custom SQL Alerts
Over the coming weeks, we’ll release major changes to how users interact with alerts from Metric and Custom SQL Monitors. This is a follow-on to similar capabilities we released for Freshness & Volume back in February.
After this release, when users receive a Metric or Custom SQL alert:
- The anomaly is automatically excluded from the set of data that trains the models. This means thresholds don’t automatically widen after an alert.
- Users can ‘mark as normal’ if they’d like to re-introduce the anomaly into the set of training data. This widens the threshold.
- Users can ‘select training data’ to exclude periods of the monitors history that they don’t want to models to learn from. This typically narrows the threshold.
These changes gave users dramatically more control of their thresholds when we released them for freshness and volume, and we’re excited to do the same for Metrics and Custom SQL. Because it helps to keep thresholds tighter, it also has the effect of leading to more alerts.
Note that these replace the Fixed alert status influencing the anomaly detection. With this change, alert status will be completely decoupled from tuning the anomaly detection. See our docs for more detail.
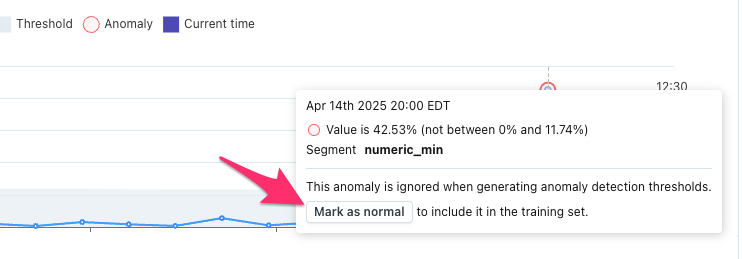
Click "Mark as normal" on a Metric or Custom SQL alert to re-introduce that data point to the set of data that trains models. This will widen the threshold.
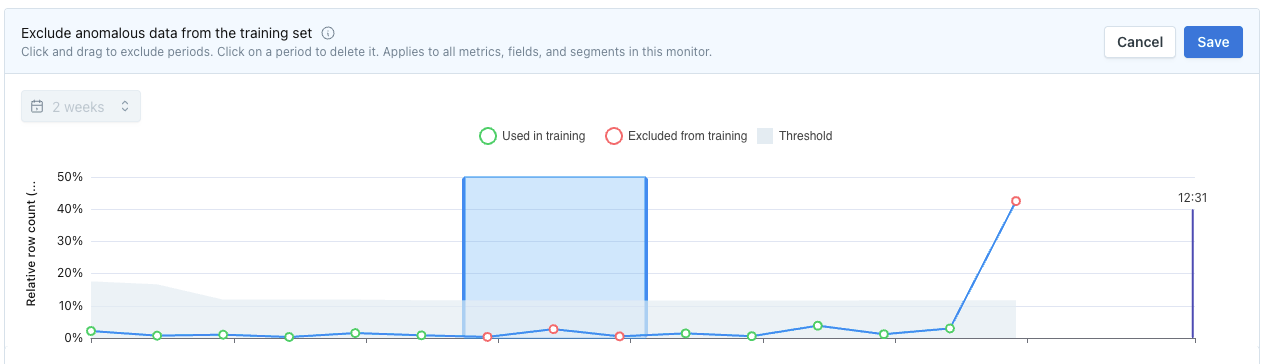
Click "Select training data" to select periods of the monitor's history to exclude from training the models. This typically narrows the threshold.