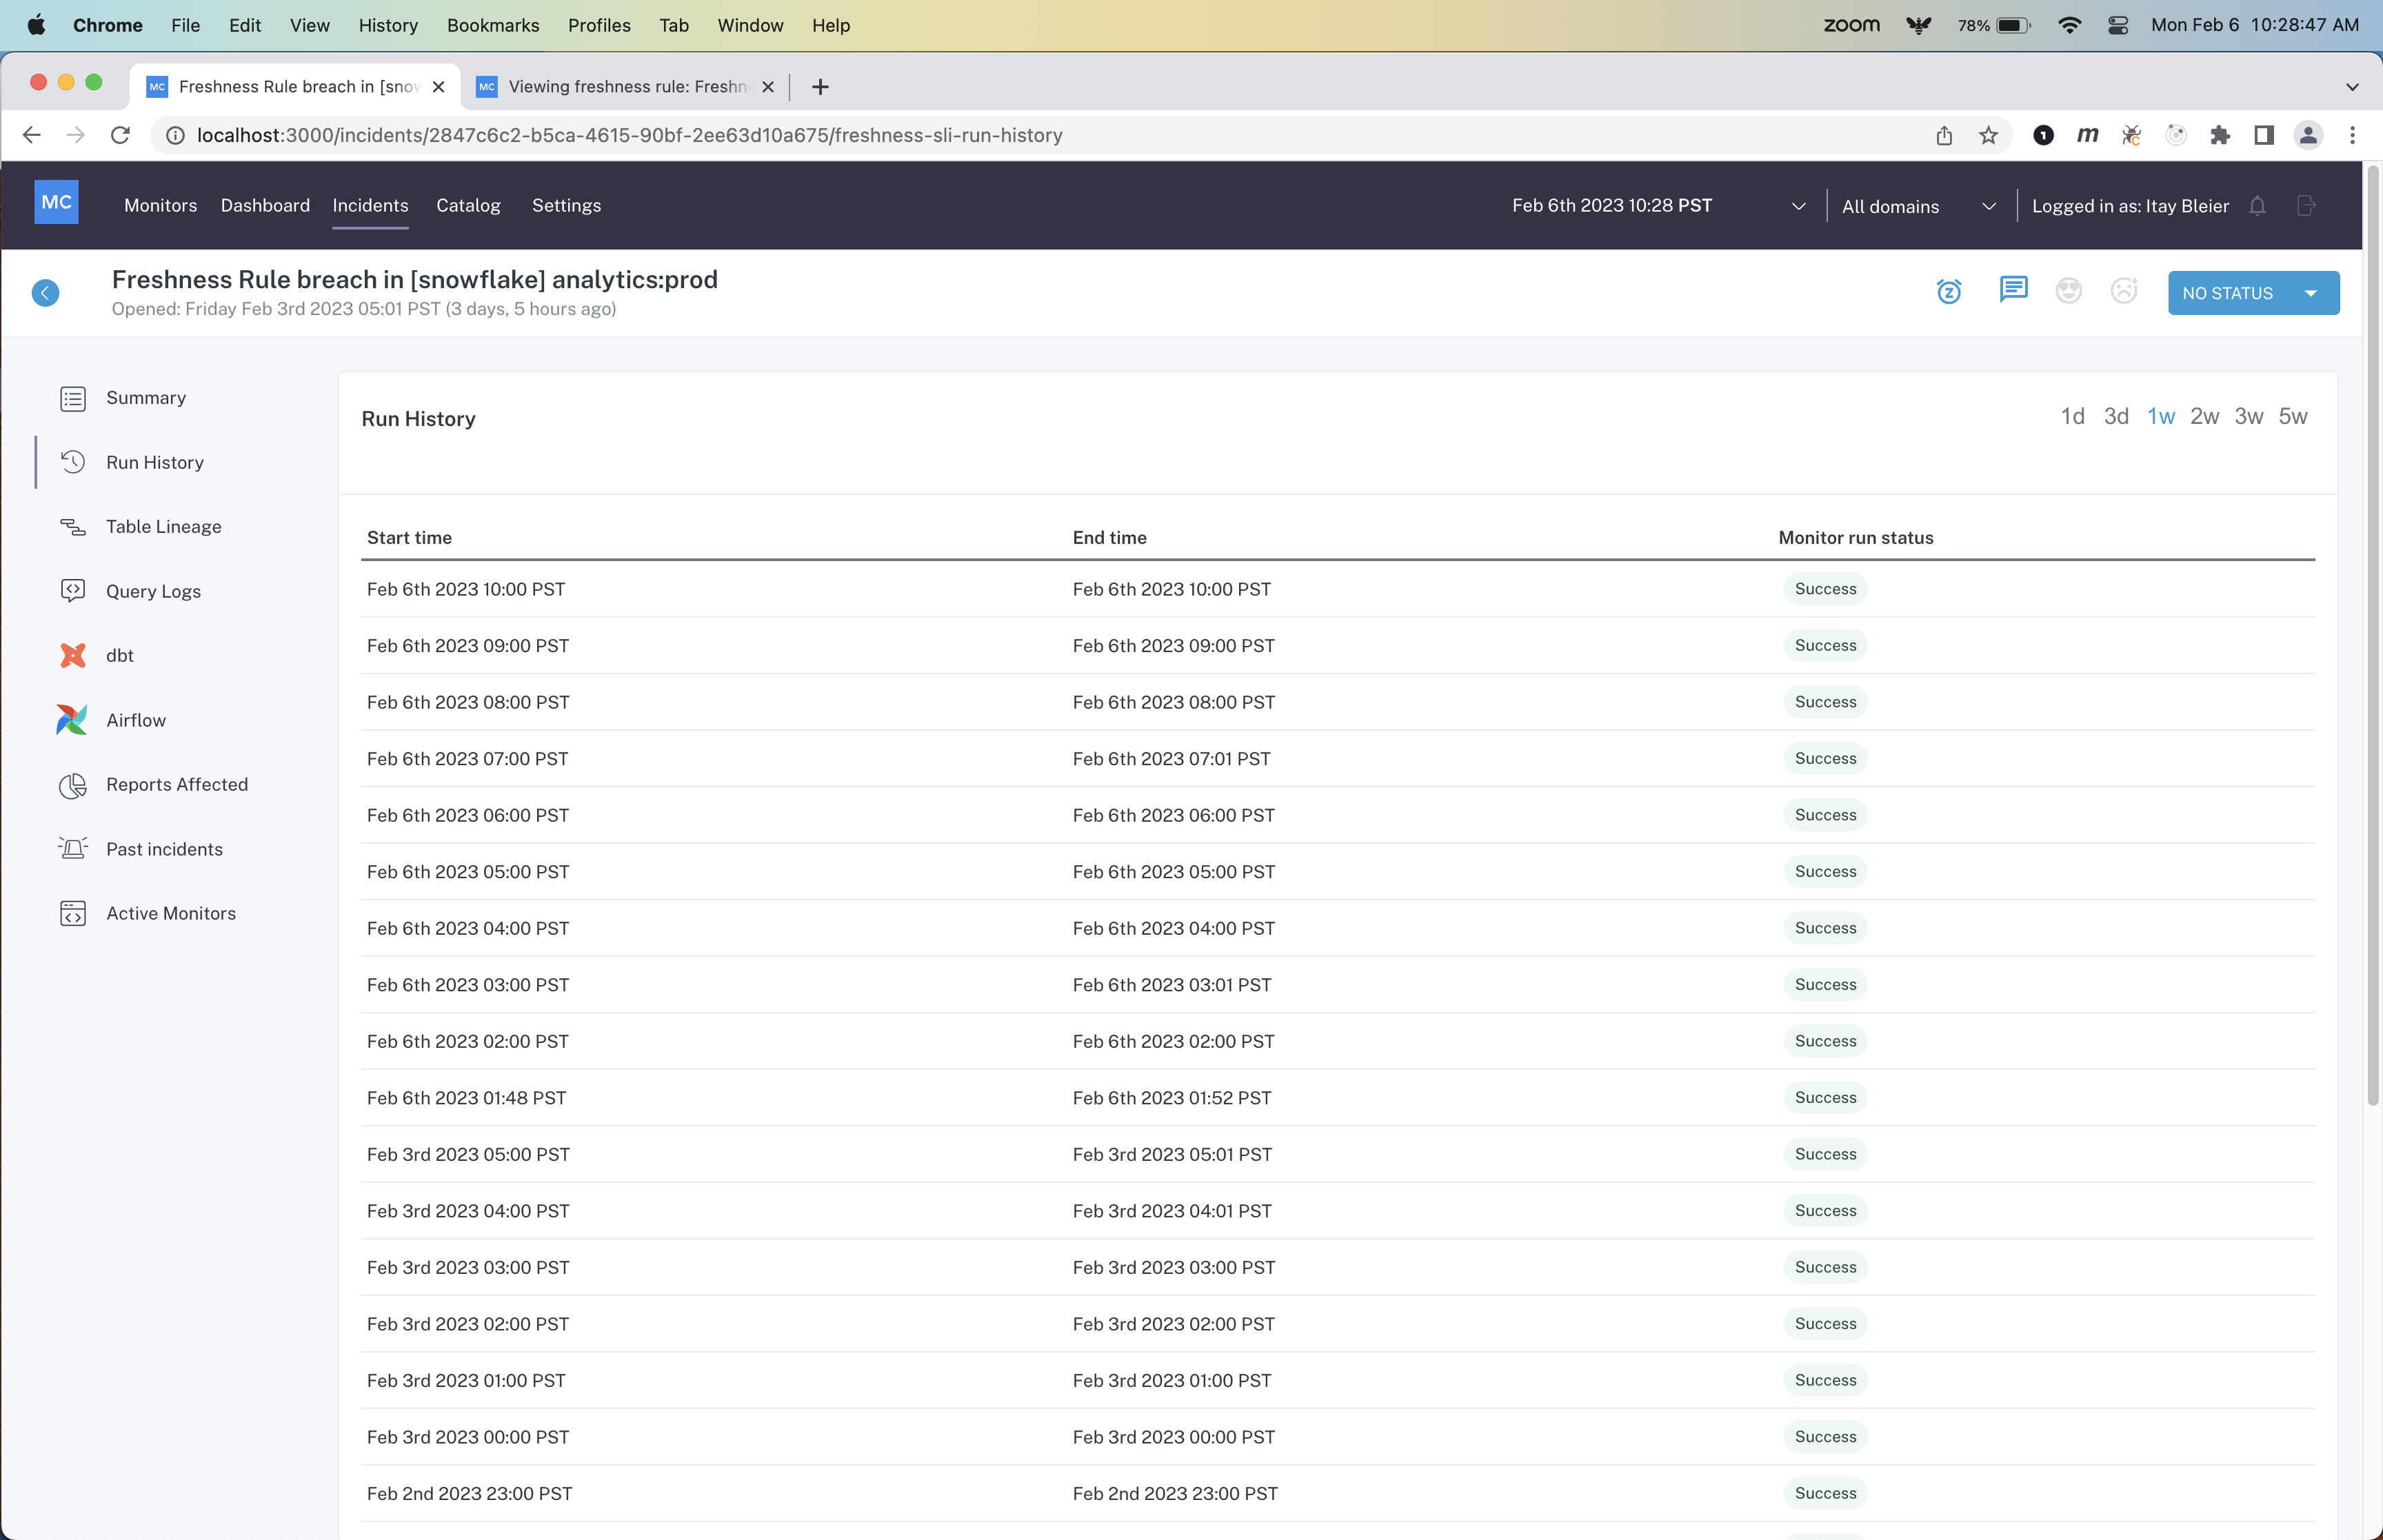
In the Incident IQ page of a freshness rule breach, users can now see a tab "Run History" which displays the run history of the freshness rule monitor.

In the Incident IQ page of a freshness rule breach, users can now see a tab "Run History" which displays the run history of the freshness rule monitor.
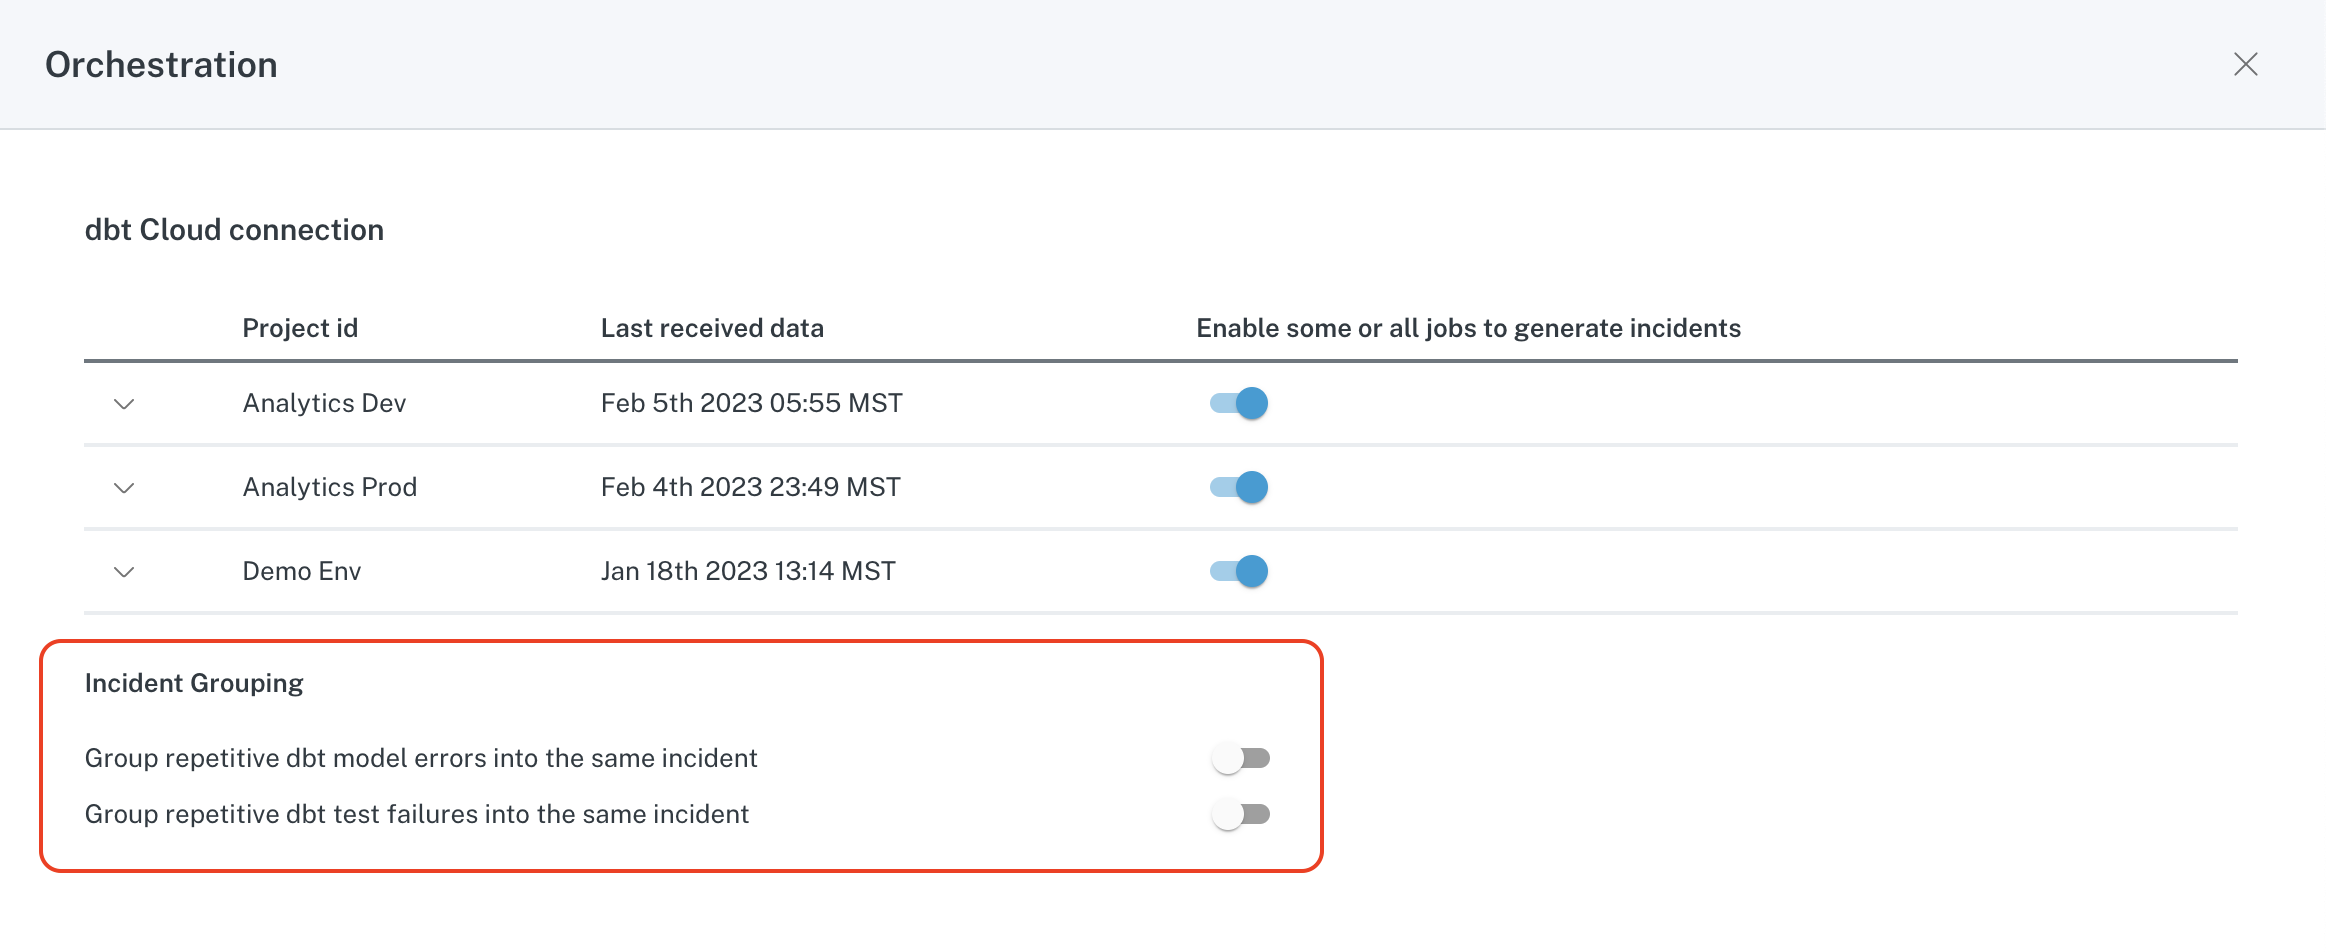
The default dbt event grouping behavior puts model and test failures from the same dbt run into one MC incident. Now with this new option, customers can choose to also group "repetitive" dbt failures (same model/test + same table + same error message) into the same MC incident.
A repetitive failure will be grouped into existing incidents until it runs successfully again, or fails with a different error message.
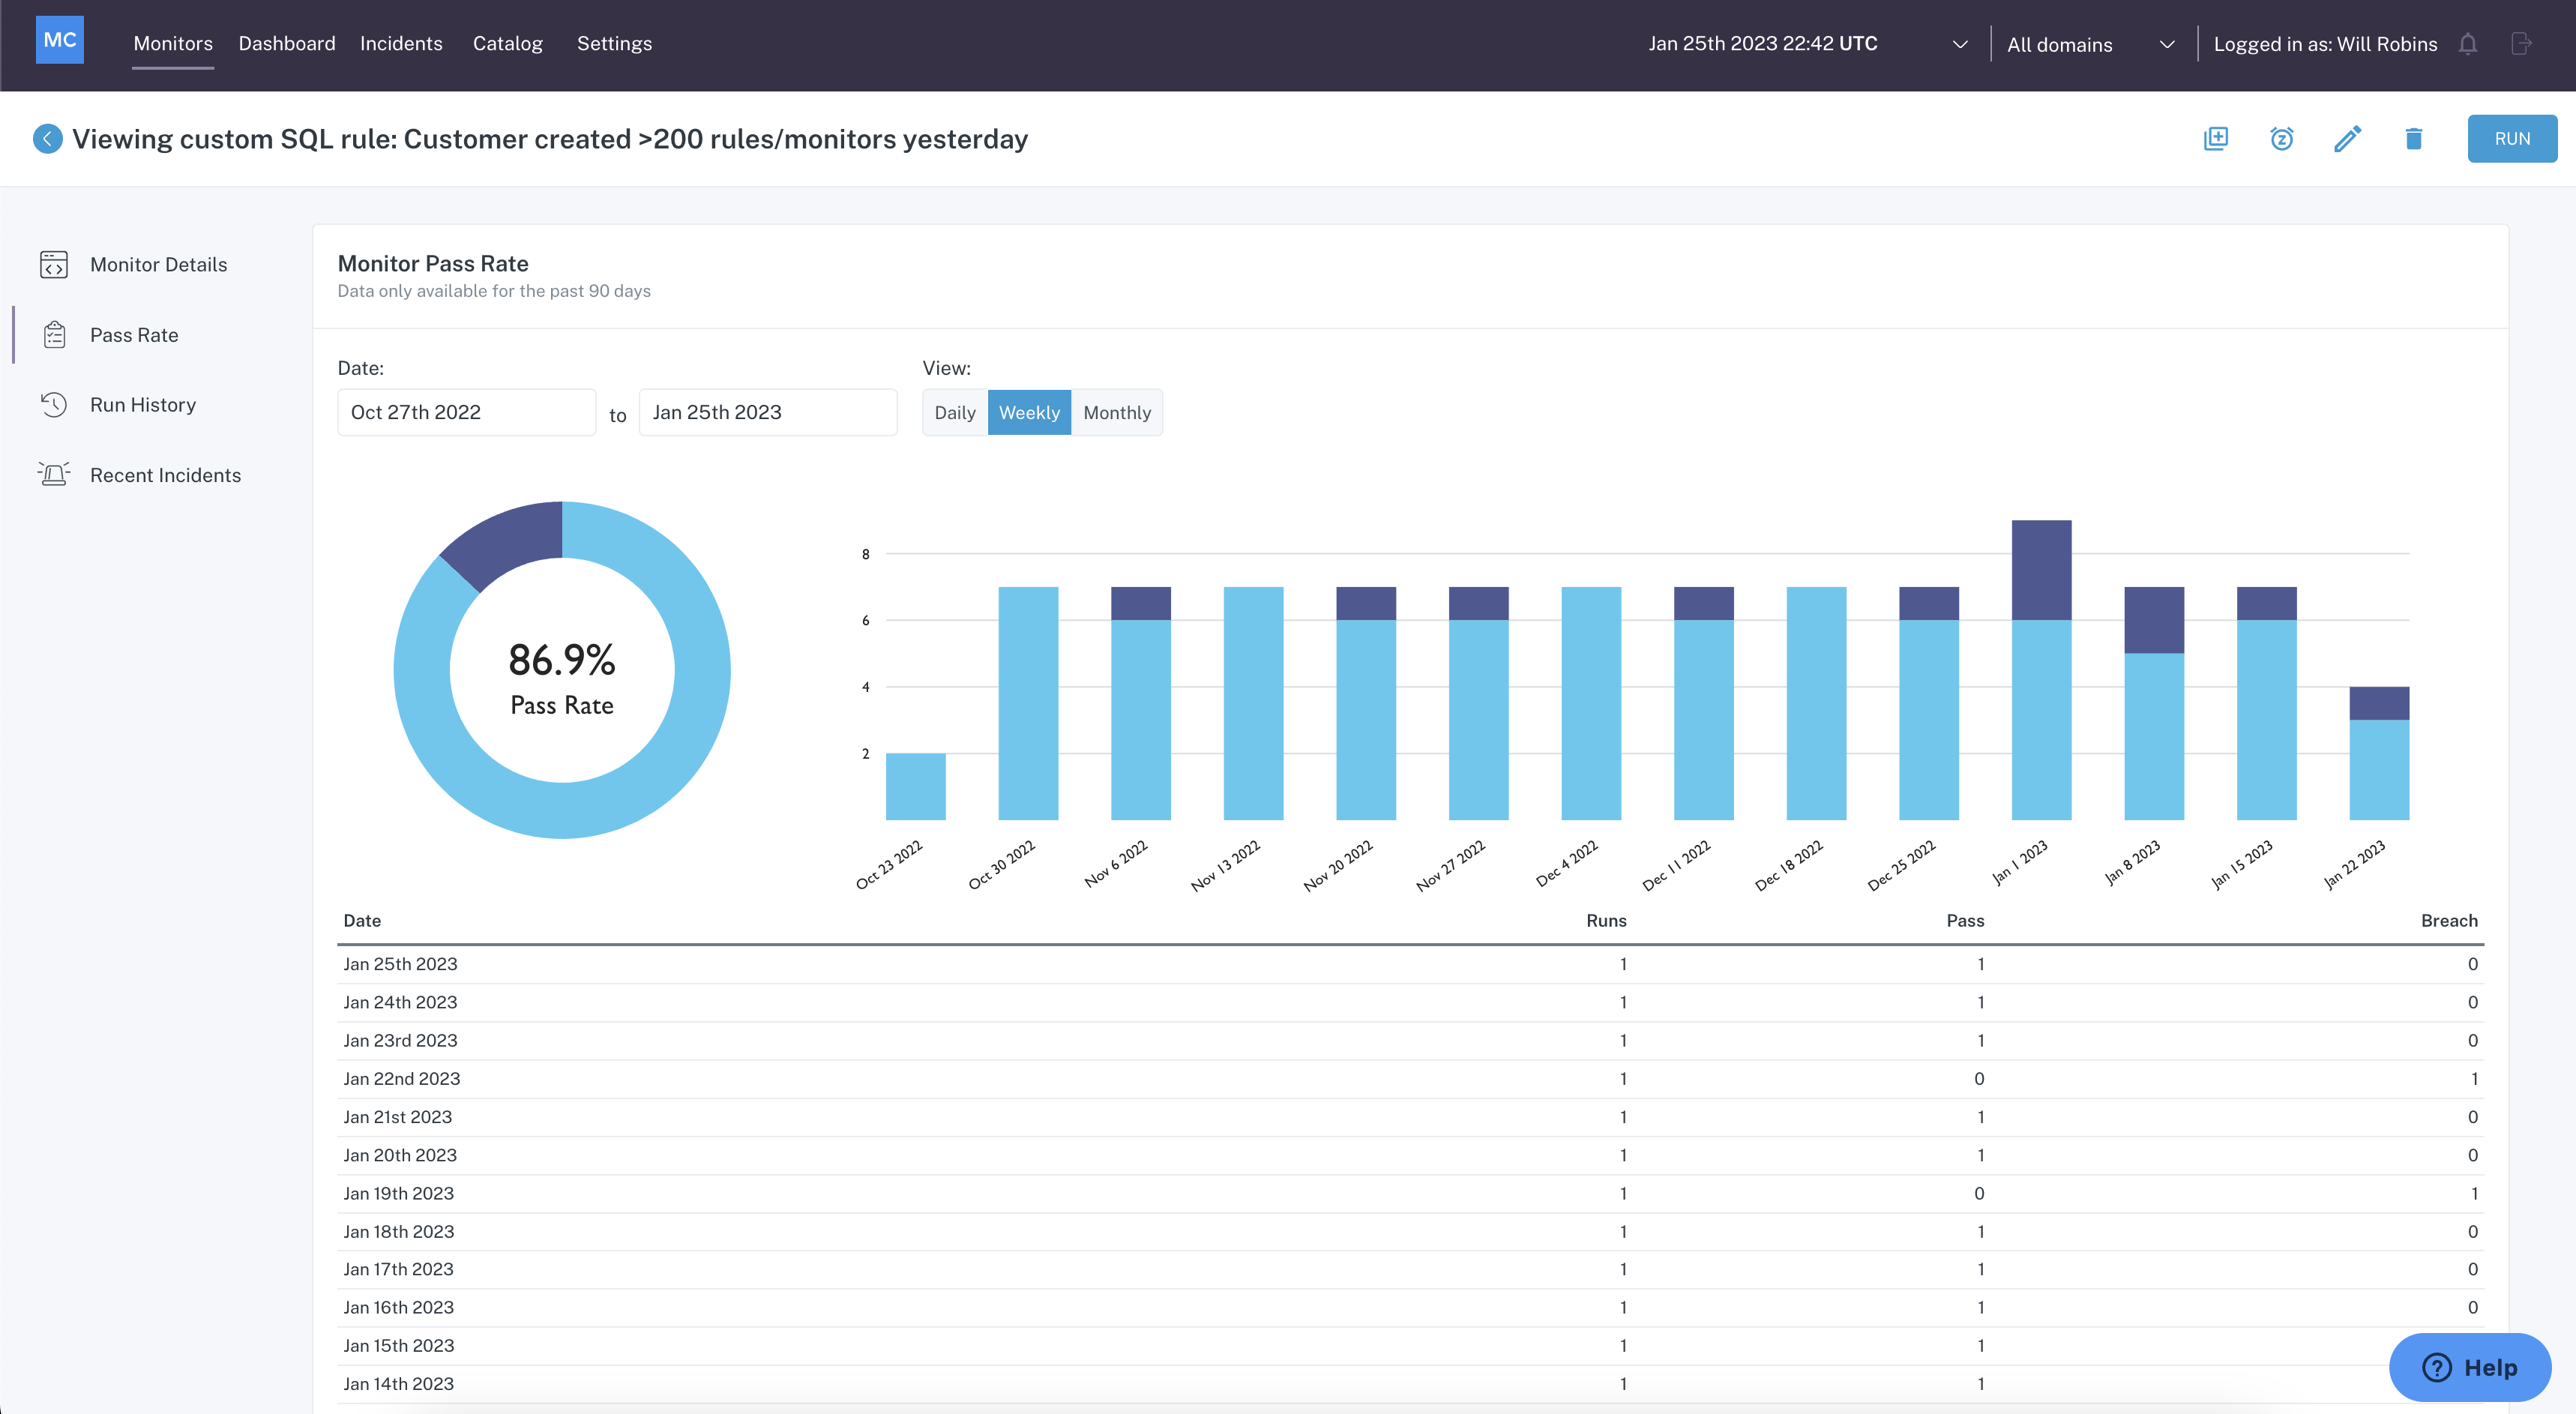
Looking to better manage and track SLAs with Monte Carlo? Pass Rate helps you visualize how often the conditions of a Freshness, Volume, or SQL Rule have been met. For example, you could say with confidence that “we delivered this data successfully 98% of the time this quarter.”
The Pass Rate section is viewable for SQL Rules, Freshness Rules, and Volume Rules. It plots results of the rule (either pass or breach ), grouped by day, week, month, or for the overall time range you've selected.

Users can now update the Severity or Owner of an Incident from the alert in Slack. No need to click into the UI. Customers who are mature in their Incident response & management processes are using Owner and Severity to help drive accountability and visibility of Incidents. This saves them a few clicks and keeps them in Slack. Click the More Actions button in Slack to Set Severity or Set Owner.
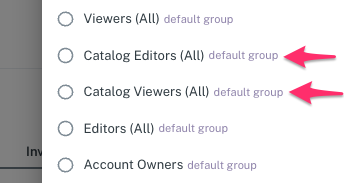
These two roles are valuable for analysts, data stewards, or other roles who want to interact with lineage, metadata, and documentation in Monte Carlo.
These roles are not exposed to Incidents, Custom Monitors, Dashboards, or Settings.
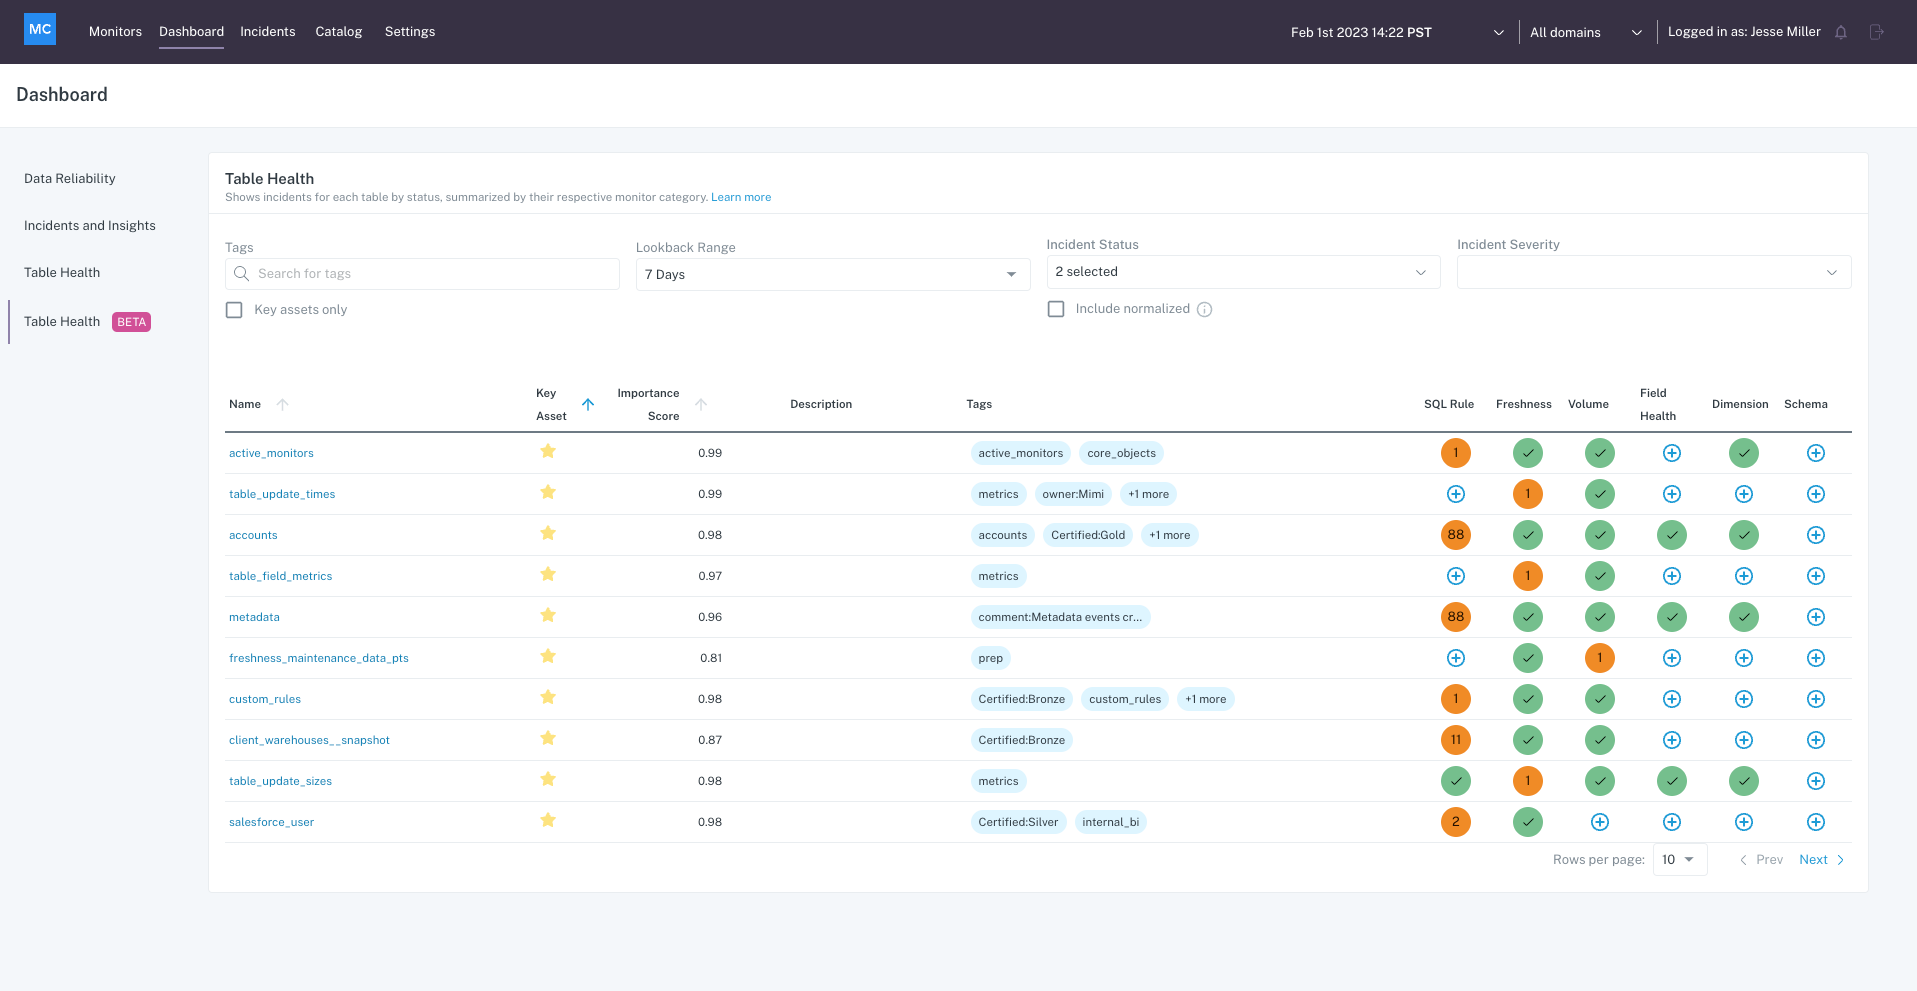 ](https://readme-pics-conversion.s3.amazonaws.com/NEW+Table+Health+Dashboard.png) you will find this new version. From here you can use the various filters and sorts to build a personalized view of tables. Hover over the incidents to get a summary of details.
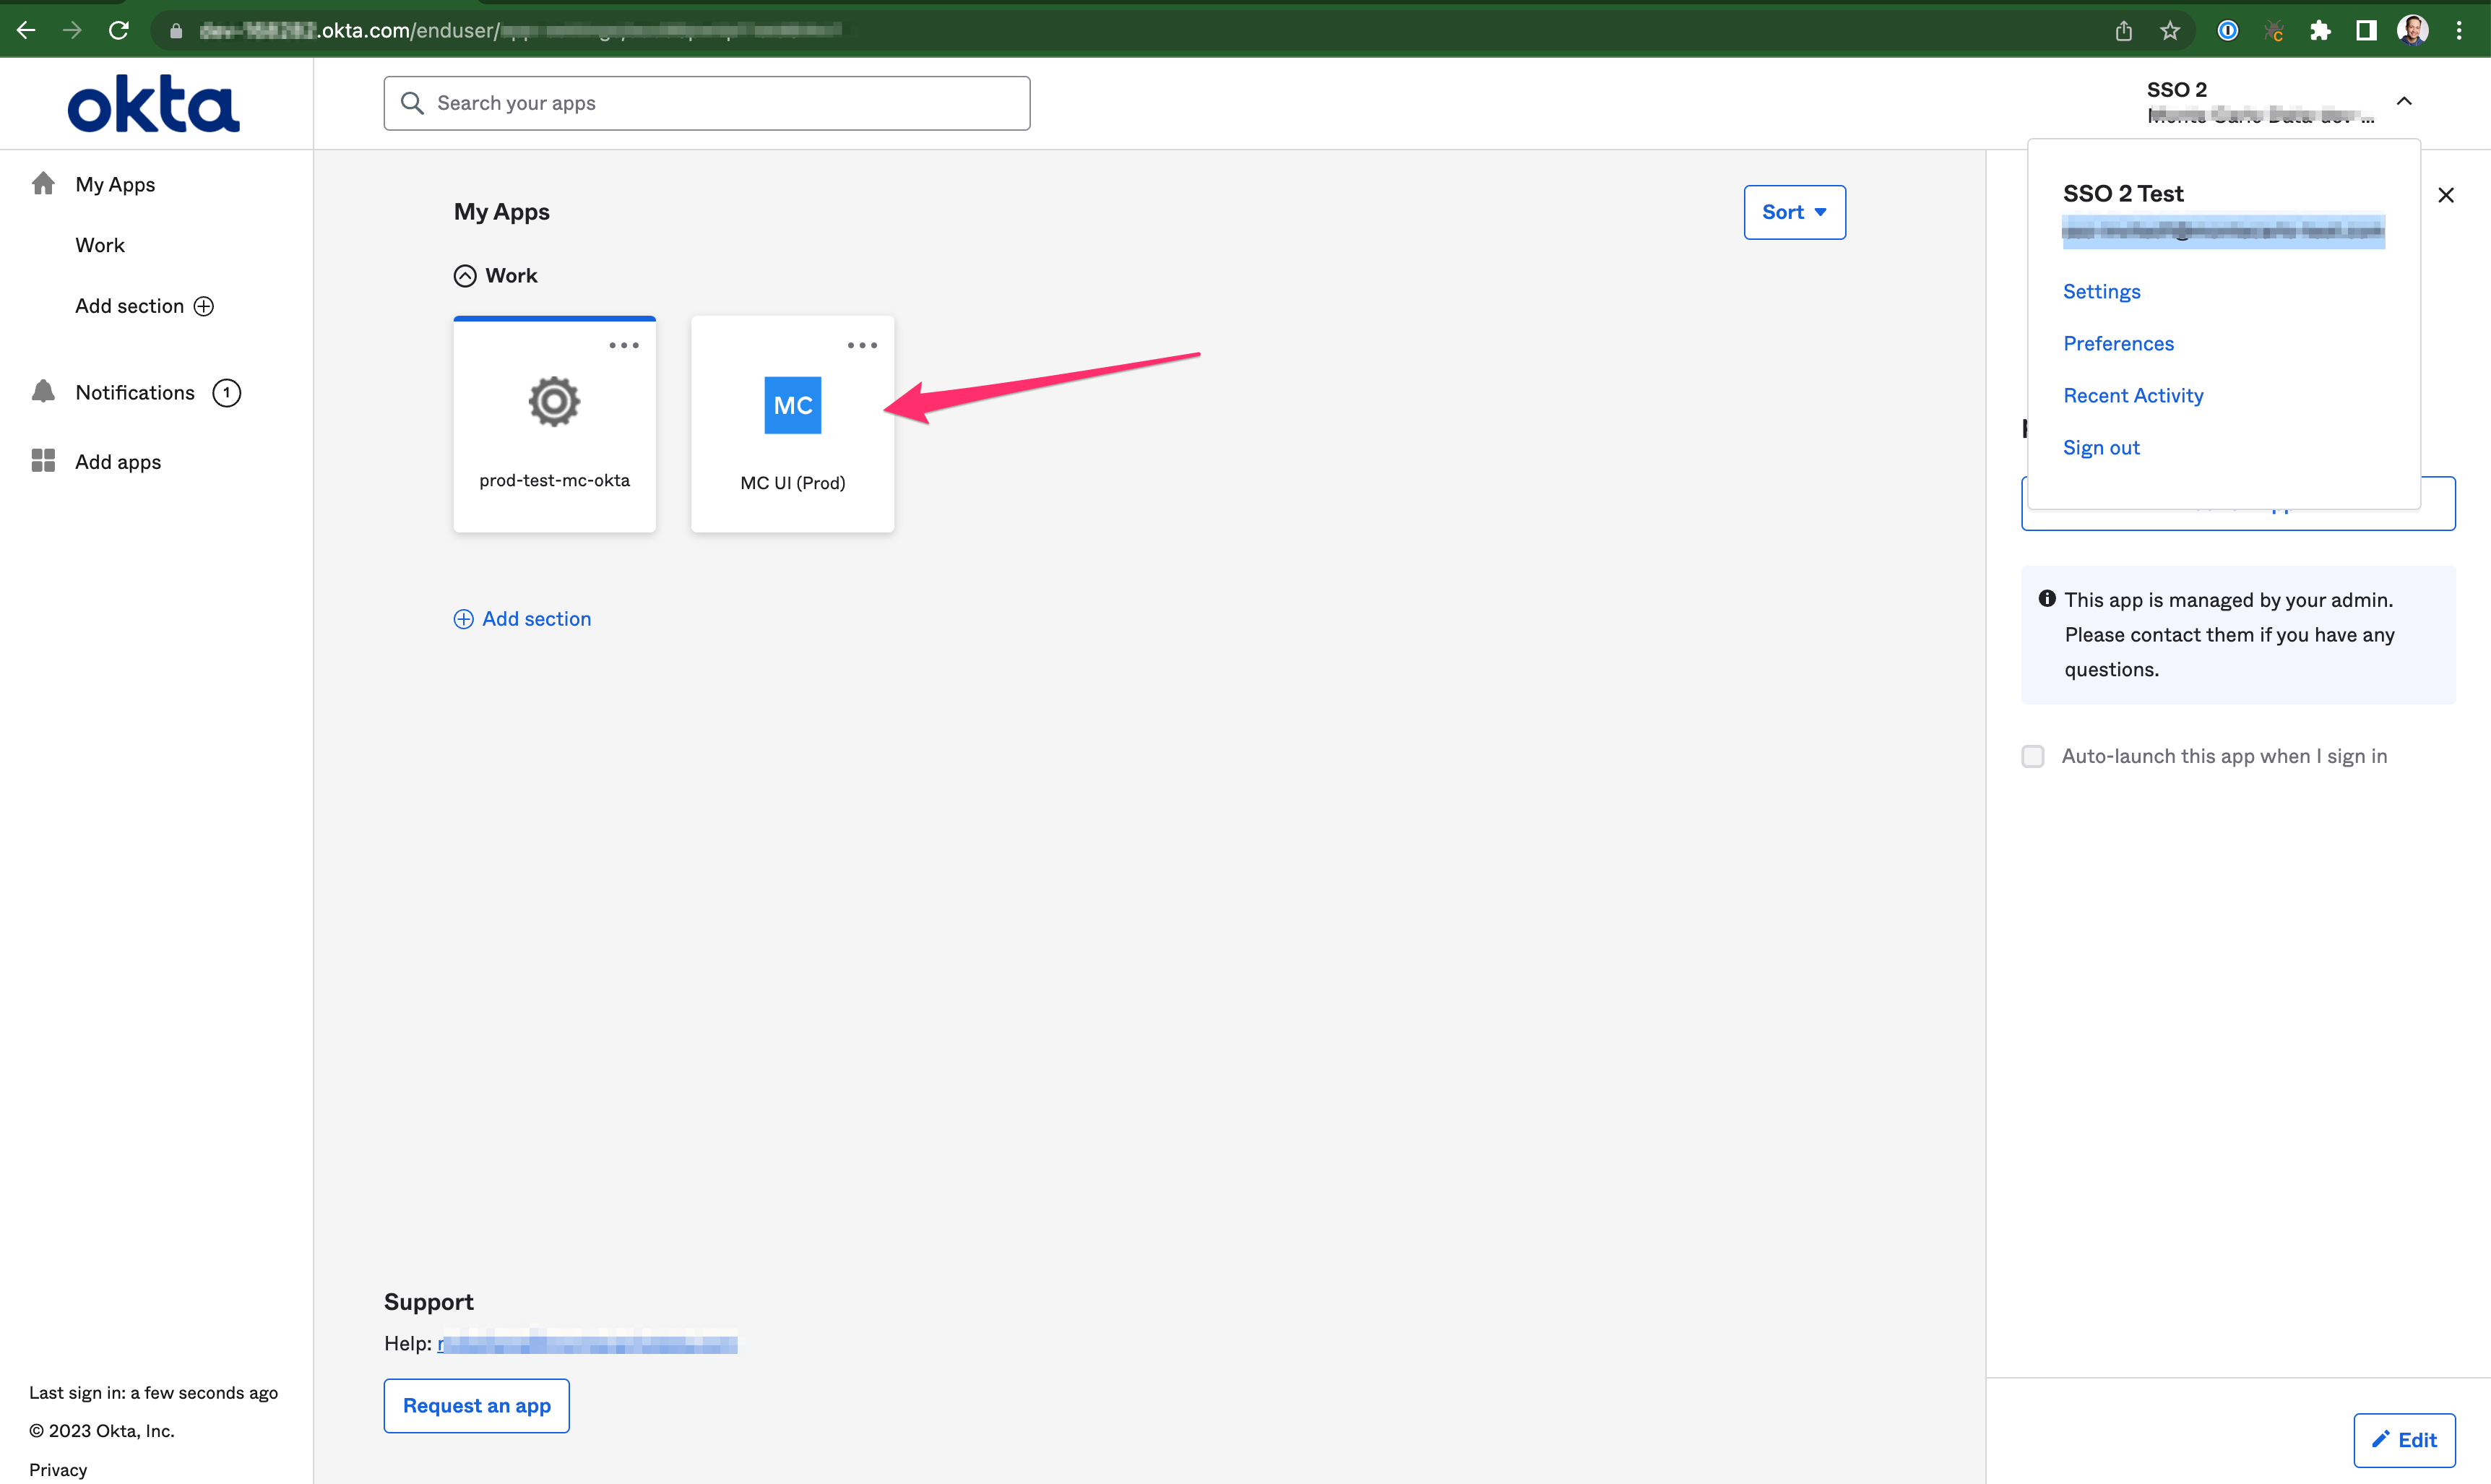 in your IdP for Monte Carlo. This link is different from our normal login page. Rather, it initiates a validation of the user's credentials which then signs them into Monte Carlo. So when a user then clicks the tile, it will open up MC and automatically log the user in. No need for them to input their credentials.
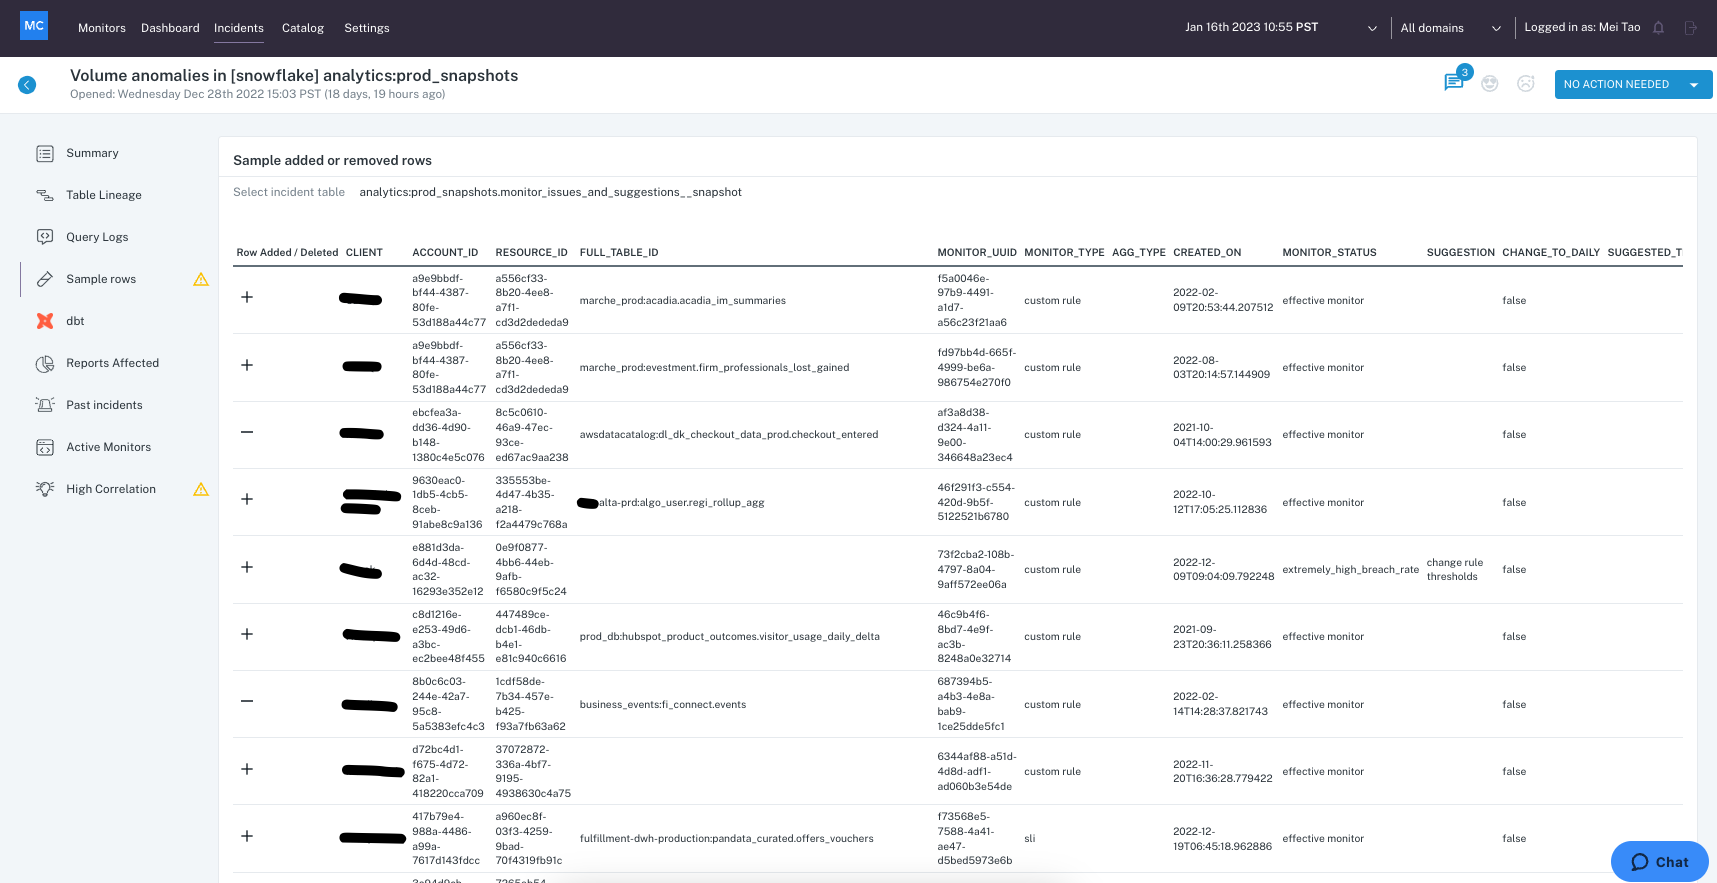
For volume anomalies that are "large number of rows added" and "large number of rows deleted", users can now sample the rows in incident IQ to help with investigations. Please note this feature is not available for all incidents, i.e. for BQ and redshift this is only available for rows additions but not deletions.
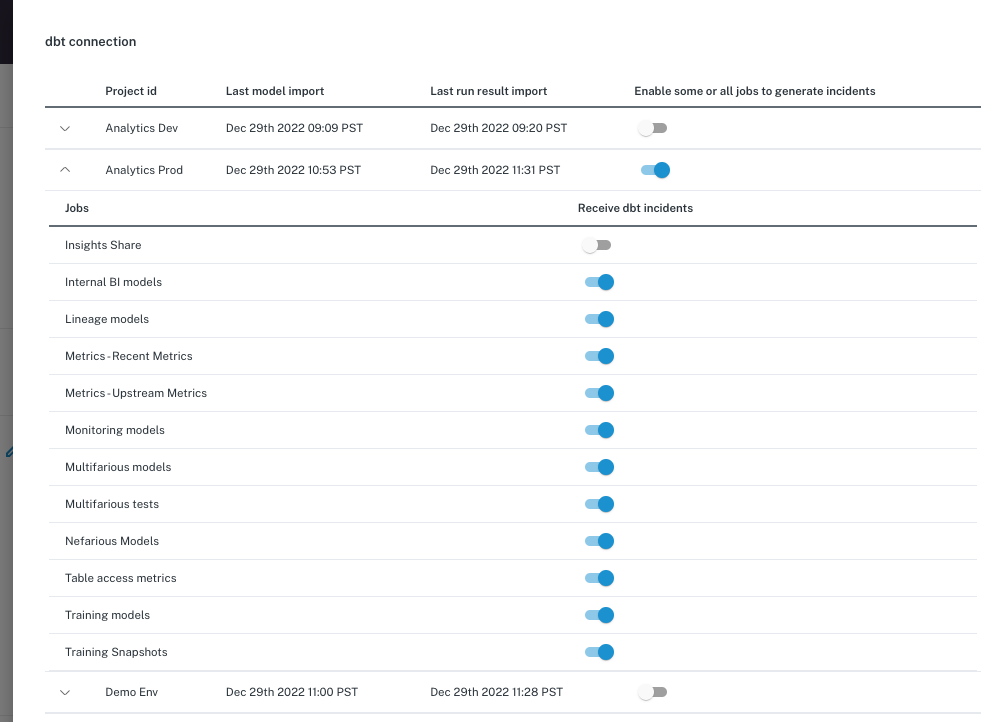
Each dbt cloud connection now shows a box in the integration settings page, where users can click in to view all projects and jobs, and to toggle incident generation on / off for each job. Users can leverage this feature to exclude non-essential dbt jobs, ie, CICD, from sending incidents.
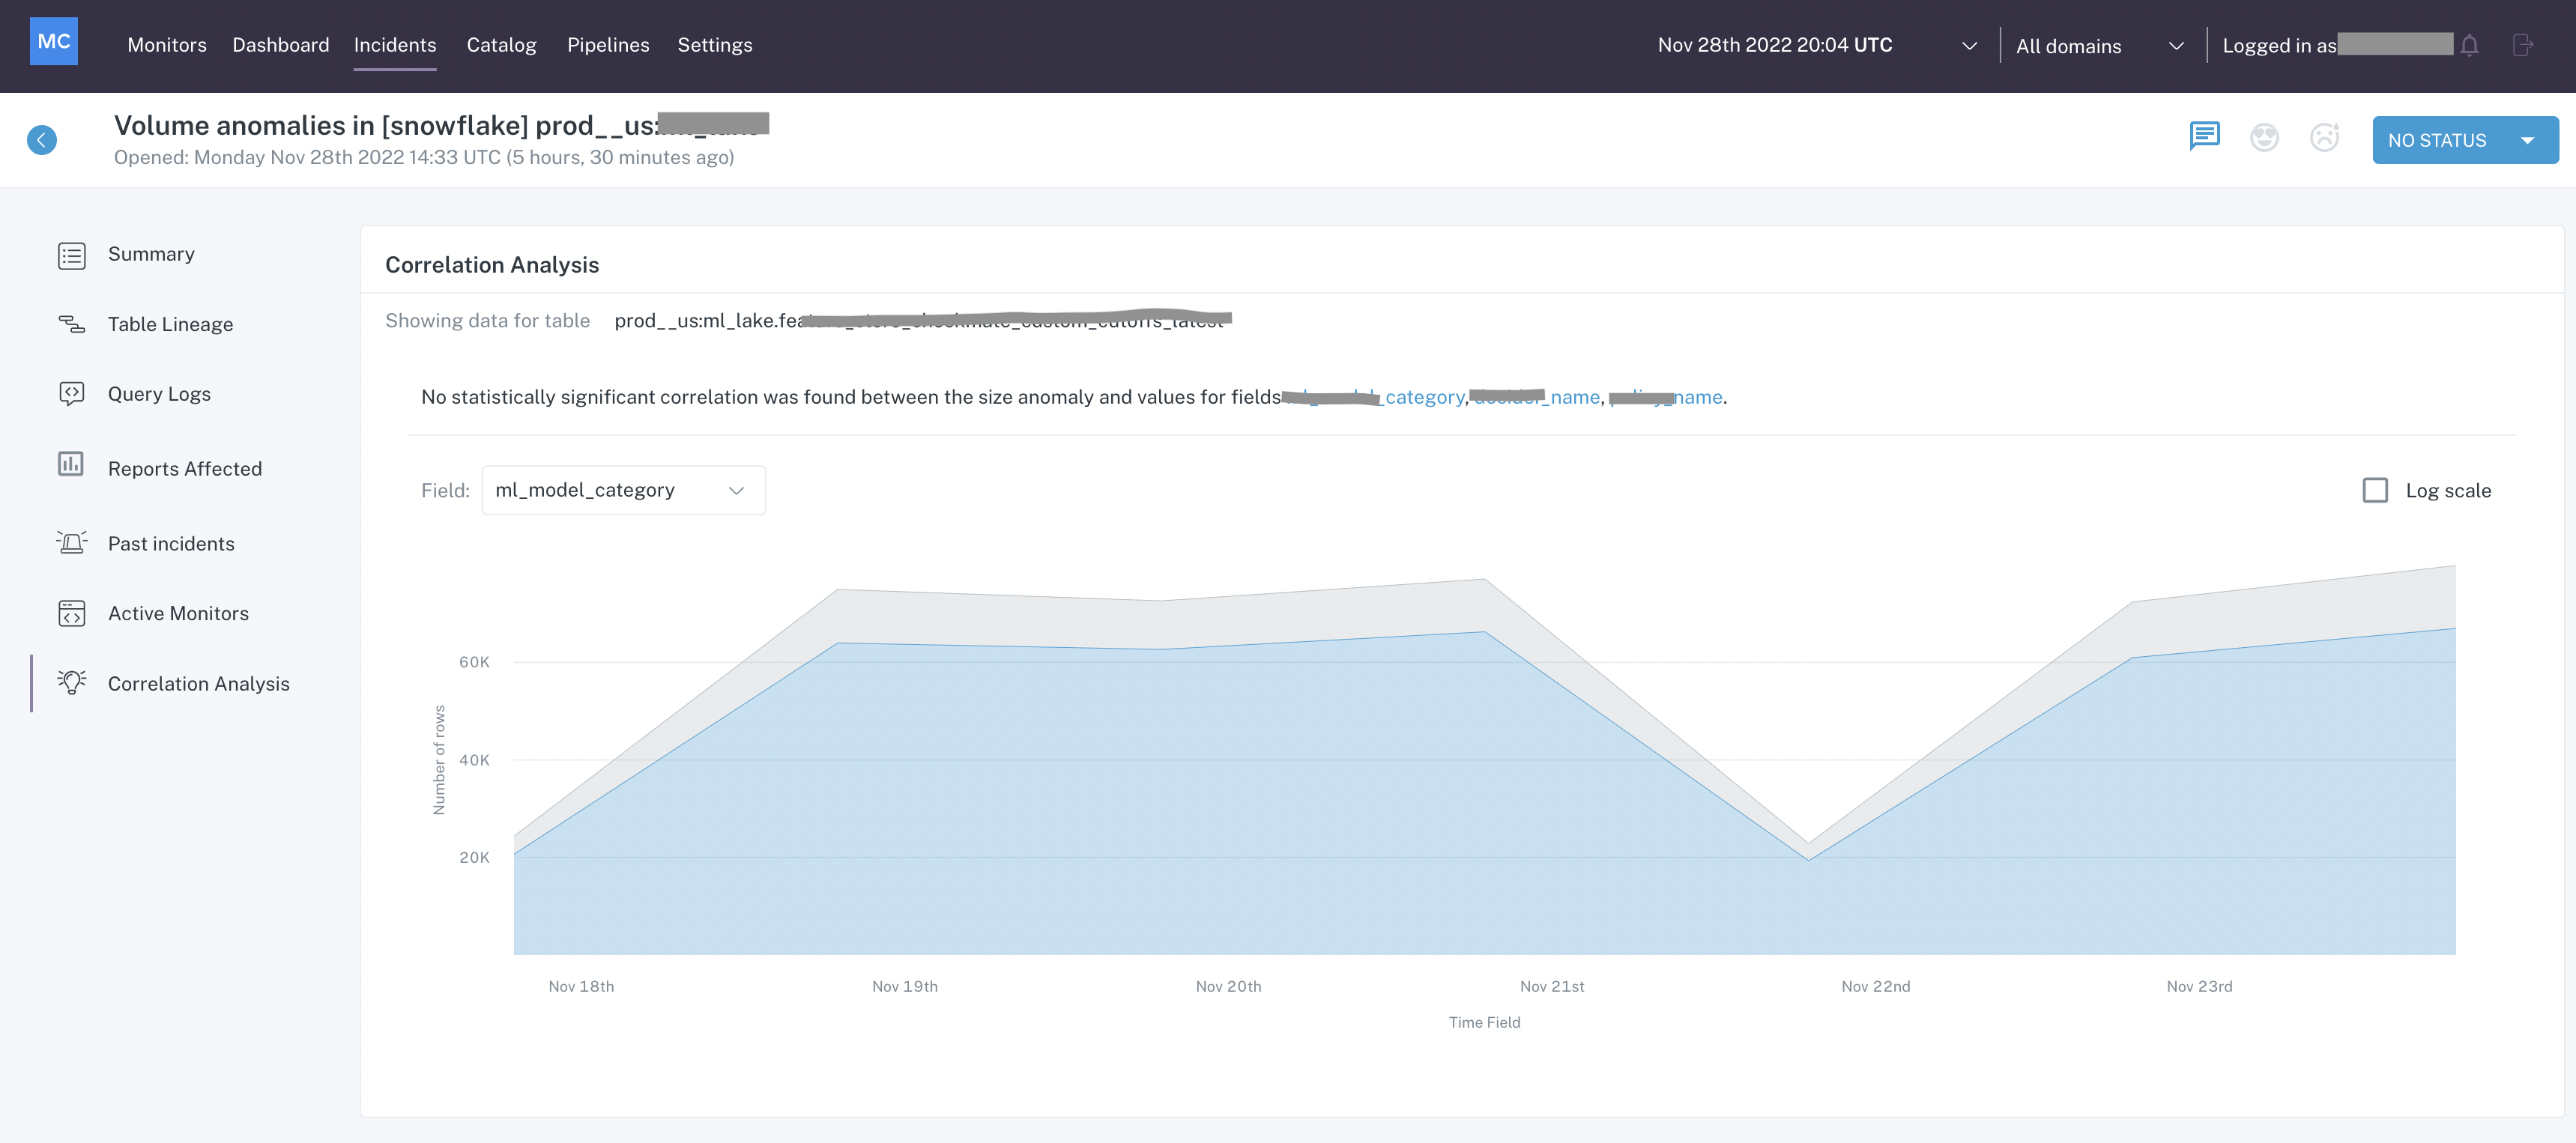 , where users can select a time-axis and a categorical field to plot the volume chart and spot any correlation patterns on their own.