Another exciting week of product feature improvements and new releases!

What's new

  • Dataset and table filters apply to SQL Rule Notifications: With this change customers no longer need to select individual SQL Rules and SLIs to filter which incident notifications they receive and instead can now use dataset/table/tag filters to automatically filter for incident notifications
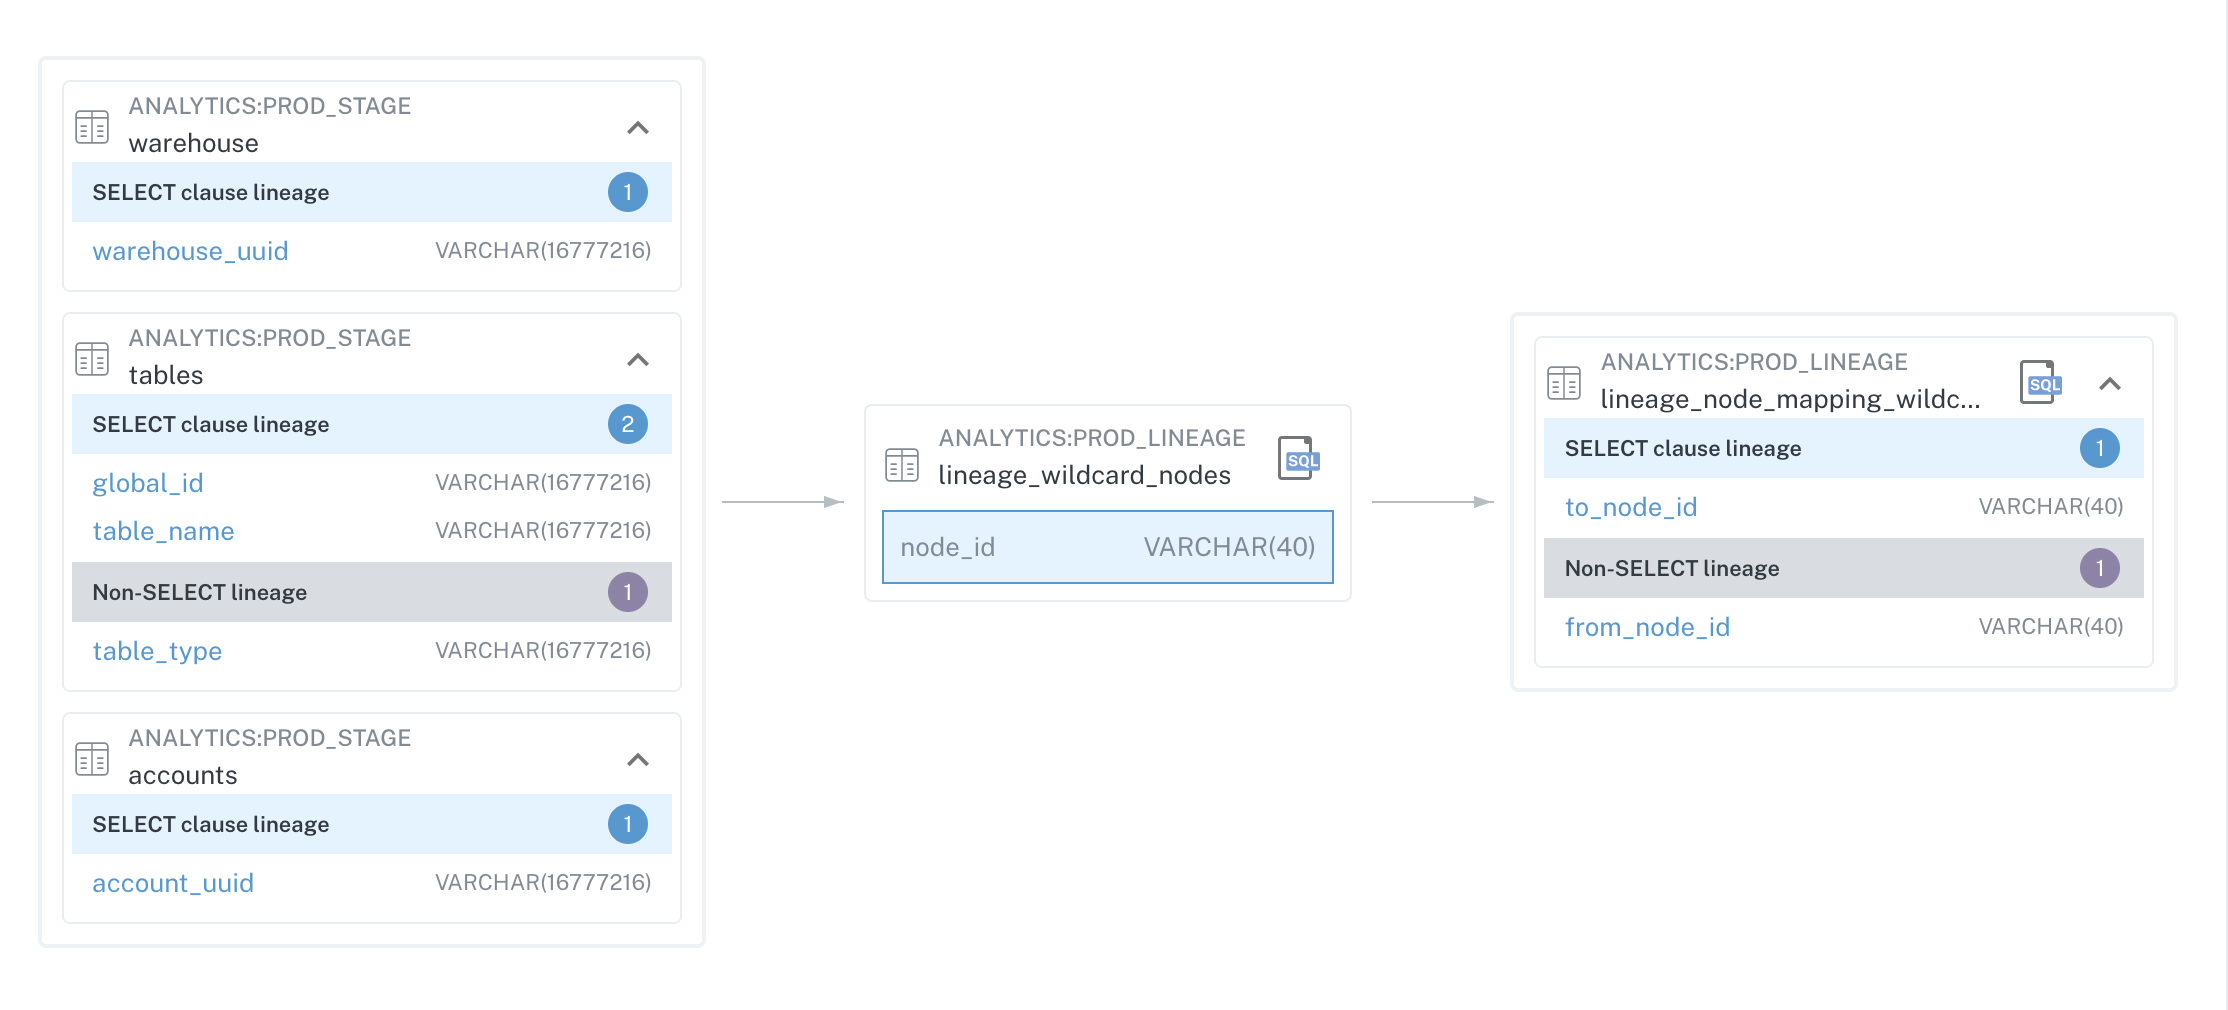
  • Download pipeline graph as CSV or PNG: Easily download a CSV export of the pipelines lineage graph to generate your own version of the lineage graph or download a PNG to easily share pipeline graphs with coworkers

Improvements and Fixes:

  • Custom monitor WHERE clause support: Resolved an issue with Field Health and Dimension Tracking monitors with WHERE clauses and added WHERE clause filter to Field Health and Dimension tracking catalog view
  • Sample query performance improvement: Improved performance of accessing sample queries and sample records for Field Health anomalies - click on the new debug icon when available

What's next

  • Field level lineage: We're working on a way to expose field level lineage in the UI to help with both field-specific investigations and field deprecation
  • Workspaces: To help larger teams manage complex datasets, we're building a workspaces model which will allow users to create database and schema filtered groups that users can configure to filter the UI by team, focus area, etc.

We have a double feature this week due to our hackathon the week before last

What's new

  • SQL Rule snoozing: Easily snooze SQL rule notifications during incident investigations or while developing pipelines to reduce notification fatigue
  • Monitors as code: To help data engineering teams manage Monte Carlo monitors, we released YAML-based config that allows you to deploy and maintain monitors as part of your CI/CD process (Reach out to us if you're interested in testing out the functionality!)

*Improvements and Fixes

  • CLI Athena and Glue Connection Support: Improved connection status feedback when setting up Athena and Glue data lake integrations via the CLI
  • Rule and SLI result Insights report: Added a new report to the Dashboard Insights which shows a 90 day history of custom rules and Freshness/Volume SLIs
  • Infinite scroll and performance improvements on Incidents tab: The Incidents tab now loads significantly faster and infinite scroll means you no longer have to click to load the next set of results

What's next

  • Field level lineage: We're working on a way to expose field level lineage in the UI to help with both field-specific investigations and field deprecation

The MC engineering team is running a hackathon this week so we'll have fewer updates to share next week.

What's new

  • Filter notifications with table tags: To support more advanced notification filters, you can now use table tags to filter which notifications go to which Slack channels, emails, etc.

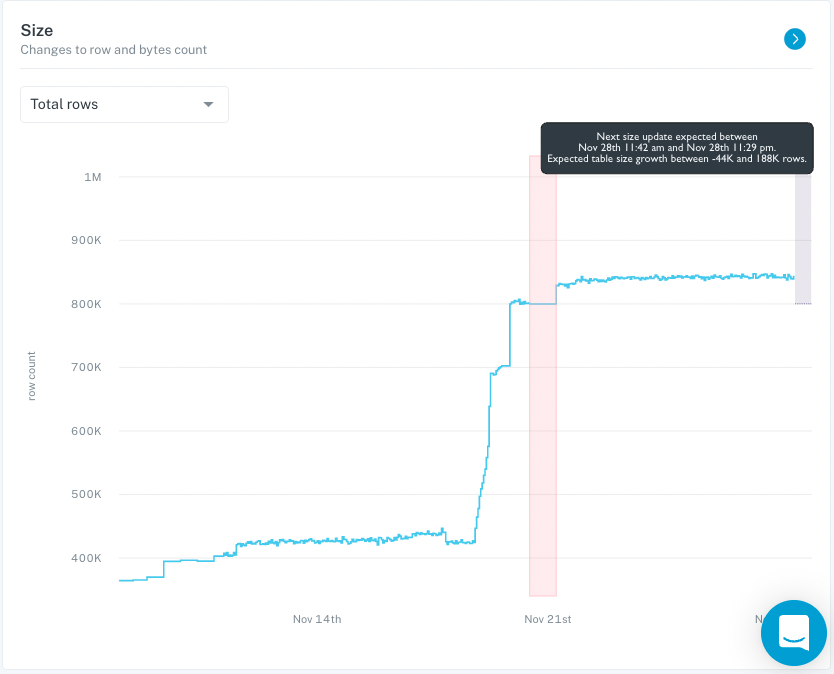
  • Data Lake throughput anomaly detection: To provide the same observability Monte Carlo offers around volume changes in data warehouses, we shipped support for throughput monitoring in Data Lakes which will alert you to abnormal volume changes and unchanged size anomalies

  • More UI usability improvements:

    • Select only to filter by a single monitor type in the Custom Monitors table
    • Update table name formatting across the application using the following standard format [data warehouse name] database_name:schema_name.table_name
    • Open incidents in new tab from Pipelines graph incidents
    • Edit date time using text input in addition to UI date selector selector component
    • Add search filter to field selector when enabling Field Health monitoring
    • Select all fields in the Field Health monitor flow by default

Improvements and Fixes

  • Improved handling of low distinctness numeric field health monitors: We now provide better support for catching numerical anomalies in tables with very low distinct values
  • Faster anomaly detection training period: To reduce the training time for anomaly detection models, we now pull 2 weeks of historical data when a monitor is deployed
  • Select Data Collector Region during warehouse setup: When onboarding a new data warehouse, you will now be able to select your data collector region in the app

What's next

  • SQL Rule Snooze: To minimize unwanted notifications during an investigation, we'll soon support the ability to snooze SQL Rule notifications for preset time period
  • Workspaces: To support large organizations with multiple teams, we're working on a workspace model that will allow you to create collections of projects and schemas that will filter what the user sees in the UI
  • Monitors as code: A highly requested feature from our roadmap sessions was to configure Monte Carlo as a part of the code release process - this integration will support YAML based configs to deploy custom monitors within Monte Carlo

We're focusing on shipping many smaller fixes and UI improvements that we hope will significantly increase the quality of life for our customers. More updates to come next week!

What's new

  • Table tag Notification filters: When creating notifications, you can now filter notifications by table tag -- A common use case here is to send notifications for tables with a key_asset: true tag to a high priority Slack channel, email address, etc.

  • UI Usability Improvements:

    • Tooltips throughout the UI have been updated to make them significantly easier to read with a darker background and larger font size
    • Custom Monitor last run status is now displayed in the Custom Monitors table
    • SQL Rule clone option makes it easier to duplicate SQL Rules without having to copy paste the SQL and all the corresponding settings
    • Edit single steps in custom monitor wizards without having to go through the entire wizard each time
  • Multi-region support: We now support deploying the MC collector in different AWS regions - with this change, our CLI now also supports deploying and launching stacks

Improvements and Fixes

  • Unchanged size anomaly detector: Previously, only anomalies would only be triggered if the volume of new records in a table went to 0 -- with this improvement, we now can notify you when the volume of new records approaches 0 records, but does not necessarily hit 0 new records

What's next

  • SQL Rule Snooze: To minimize unwanted notifications during an investigation, we'll soon support the ability to snooze SQL Rule notifications for preset time period
  • Workspaces: To support large organizations with multiple teams, we're working on a workspace model that will allow you to create collections of projects and schemas that will filter what the user sees in the UI
  • Monitors as code: A highly requested feature from our roadmap sessions was to configure Monte Carlo as a part of the code release process - this integration will support YAML based configs to deploy custom monitors within Monte Carlo

Another week of new product features focused on usability and extensibility of Monte Carlo.

What's new

  • Custom monitor table filters: Added search based filters and sorting to the custom monitors table
  • Data lake throughput monitoring: For Data Lake customers, we now monitor for throughput changes which looks at the changes in object store size - visit the catalog for a data lake table to view the throughput history graph

What's next

  • SQL Rule Snooze: To minimize unwanted notifications during an investigation, we'll soon support the ability to snooze SQL Rule notifications for preset time period
  • Workspaces: To support large organizations with multiple teams, we're working on a workspace model that will allow you to create collections of projects and schemas that will filter what the user sees in the UI
  • Monitors as code: A highly requested feature from our roadmap sessions was to configure Monte Carlo as a part of the code release process - this integration will support YAML based configs to deploy custom monitors within Monte Carlo
undefined

Another week of new product features focused on usability and extensibility of Monte Carlo.

What's new

  • Incident overlay + filters on Pipelines: To make the pipelines lineage graph easier to use, we now show recent incidents on tables in the graph and allow you to filter by node and lineage depth
  • Past incidents and custom monitors modules: In the catalog view, we now show both past incidents related to the table and active custom monitors

Improvements and Fixes

  • Removed 10 minute rule breach notification timeout: Rule breach notifications will now be sent immediately after being triggered
  • Moved Insights reports to Dashboard tab: To make it easier to find and download the Insights reports, we moved them to the Dashboard tab

What's next

  • Workspaces: To support large organizations with multiple teams, we're working on a workspace model that will allow you to create collections of projects and schemas that will filter what the user sees in the UI
  • Monitors as code: A highly requested feature from our roadmap sessions was to configure Monte Carlo as a part of the code release process - this integration will support YAML based configs to deploy custom monitors within Monte Carlo

The pushed out a lot of great changes last week. As always, we've love to hear your feedback!

What's new

  • Opsgenie integration: We now support sending Incident notifications to Opsgenie automatically - visit Settings > Notifications to configure the integration
  • Incident IQ Timeline: To build a rich post-mortem of what happened to an incident, we added comments and incident changes to the timeline including status update, owner changes, severity level changes and more
  • Incident IQ Past Incidents: Easily access past incidents on a table to spot patterns and see what steps were taken previously to resolve the issue

Improvements and fixes*

  • Monitors tab layout change: Updated the layout to make it easier to sort and filter the list of monitors in the Custom Monitors table

What's next

  • Lineage filters and incident overlay: To make the lineage graph easier to use we're adding filters and overlaying recent incidents to help with determining if an upstream issue may be impacting a downstream table or report
  • Workspaces: To support large organizations with multiple teams, we're working on a workspace model that will allow you to create collections of projects and schemas that will filter what the user sees in the UI
  • Monitors as code: A highly requested feature from our roadmap sessions was to configure Monte Carlo as a part of the code release process - this integration will support YAML based configs to deploy custom monitors within Monte Carlo

It's a short week in the US but the new features keep on coming!

What's new

  • Follow-on Slack Notifications: Reduce the chance of missing ballooning incidents where tables are added silently with follow-on Slack notifications each time 10 tables are added to an incident
  • Deteriorating Queries Insight report: Visit Settings > Insights to check out a new report which shows which queries are seeing consistent increases in run times over the course of a month

Improvements and fixes*

  • Search filter for Users: Added a simple search filter to the Settings > User table to help find specific users that are part of a big team

What's next

  • Workspaces: To support large organizations with multiple teams, we're working on a workspace model that will allow you to create collections of projects and schemas that will filter what the user sees in the UI
  • Monitors as code: A highly requested feature from our roadmap sessions was to configure Monte Carlo as a part of the code release process - this integration will support YAML based configs to deploy custom monitors within Monte Carlo

We have another exciting week of shipped features to improve usability across the app.

What's new

  • Incident IQ: Added new features included Slack post deep links, key assets, furthest upstream assets and more
  • Field Tags: To support a growing need to document and classify all data assets, we now support tagging fields from the catalog Field Module and from the Field Health module
  • Incident Query Changes Insight report: A new report was added to Insights which shows recent changes to queries that may help conduct root cause analyses

Improvements and fixes

  • SLI support for Redshift: Redshift customers can now setup Freshness and Volume SLIs and get notified as soon as the SLI threshold is breached

  • Unchanged size detector: A new detector will now monitor for unchanged size anomalies when Field Health is enabled for a field

    What's next?

  • Workspaces: To support large organizations with multiple teams, we're working on a workspace model that will allow you to create collections of projects and schemas that will filter what the user sees in the UI

  • Monitors as code: A highly requested feature from our roadmap sessions was to configure Monte Carlo as a part of the code release process - this integration will support YAML based configs to deploy custom monitors within Monte Carlo

undefined

Improvements and fixes*

  • Improved notification logic: To reduce the chance of important table events getting silently added to open incidents, we updated the notification logic to resend incident notifications when new tables are added that are included in separate notification rules

  • False positive reduction in Redshift: Shipped a fix that was causing a high number of freshness false positives for Redshift

  • Update credentials and remove warehouse/lake integrations using CLI: Use the Monte Carlo CLI to update credentials and remove warehouse/lake integrations

  • Added sorting to Insight CSV reports: The downloadable CSV reports in the Insights tab are now sorted by relevant columns for each report

    • Key Assets are sorted now by importance score (desc)
    • Events are sorted by creation time (desc)
    • Cleanup Suggestions now show table size and or sorted by this field (desc)

    What's next?

  • Lineage filtering and table health overlay: To help navigate large lineage graphs we're introducing depth filters along with adding simple icons to display which tables have experienced recent incidents

  • Custom Monitor details: View historical run-times, triggered incidents, more from a new detail view for custom monitors