Here's what we've been up to over the last week at Monte Carlo.

What's New

  • API support for synchronous Monitor Triggers: You can now trigger Monte Carlo Monitors to run via our API - for more information, please reach out to our Success team via email or Slack
  • Added creator email address to Notifications: You'll now see the Notification creator's email address listed to provide context on who owns the Notification (Note: Only Notifications created from this point forward will specify creator) Improvements and Fixes
  • Improved Catalog Search: The catalog search results now prioritize exact match table names higher resulting in more relevant search results\\
  • Improved table pagination UX: Redesigned the pagination arrows for all tables across the Monte Carlo app to improve visibility and usability
  • SQL Rule Notification Multi-select bug: Resolved a bug causing the multi-select SQL Rule selector in the Notification set up page to render incorrectly What's next!
  • Search-based Dataset filters: Instead of selecting each dataset or table from a list, this refactor will allow you to search and select datasets and tables when creating filters on the Incidents tab and when setting up Notifications
  • Service Level Indicators for your data: We're working on the ability to specify thresholds for our Freshness, Volume and Field Health monitors - these SLIs can roll up to SLOs and ultimately help your team commit to data SLAs\\
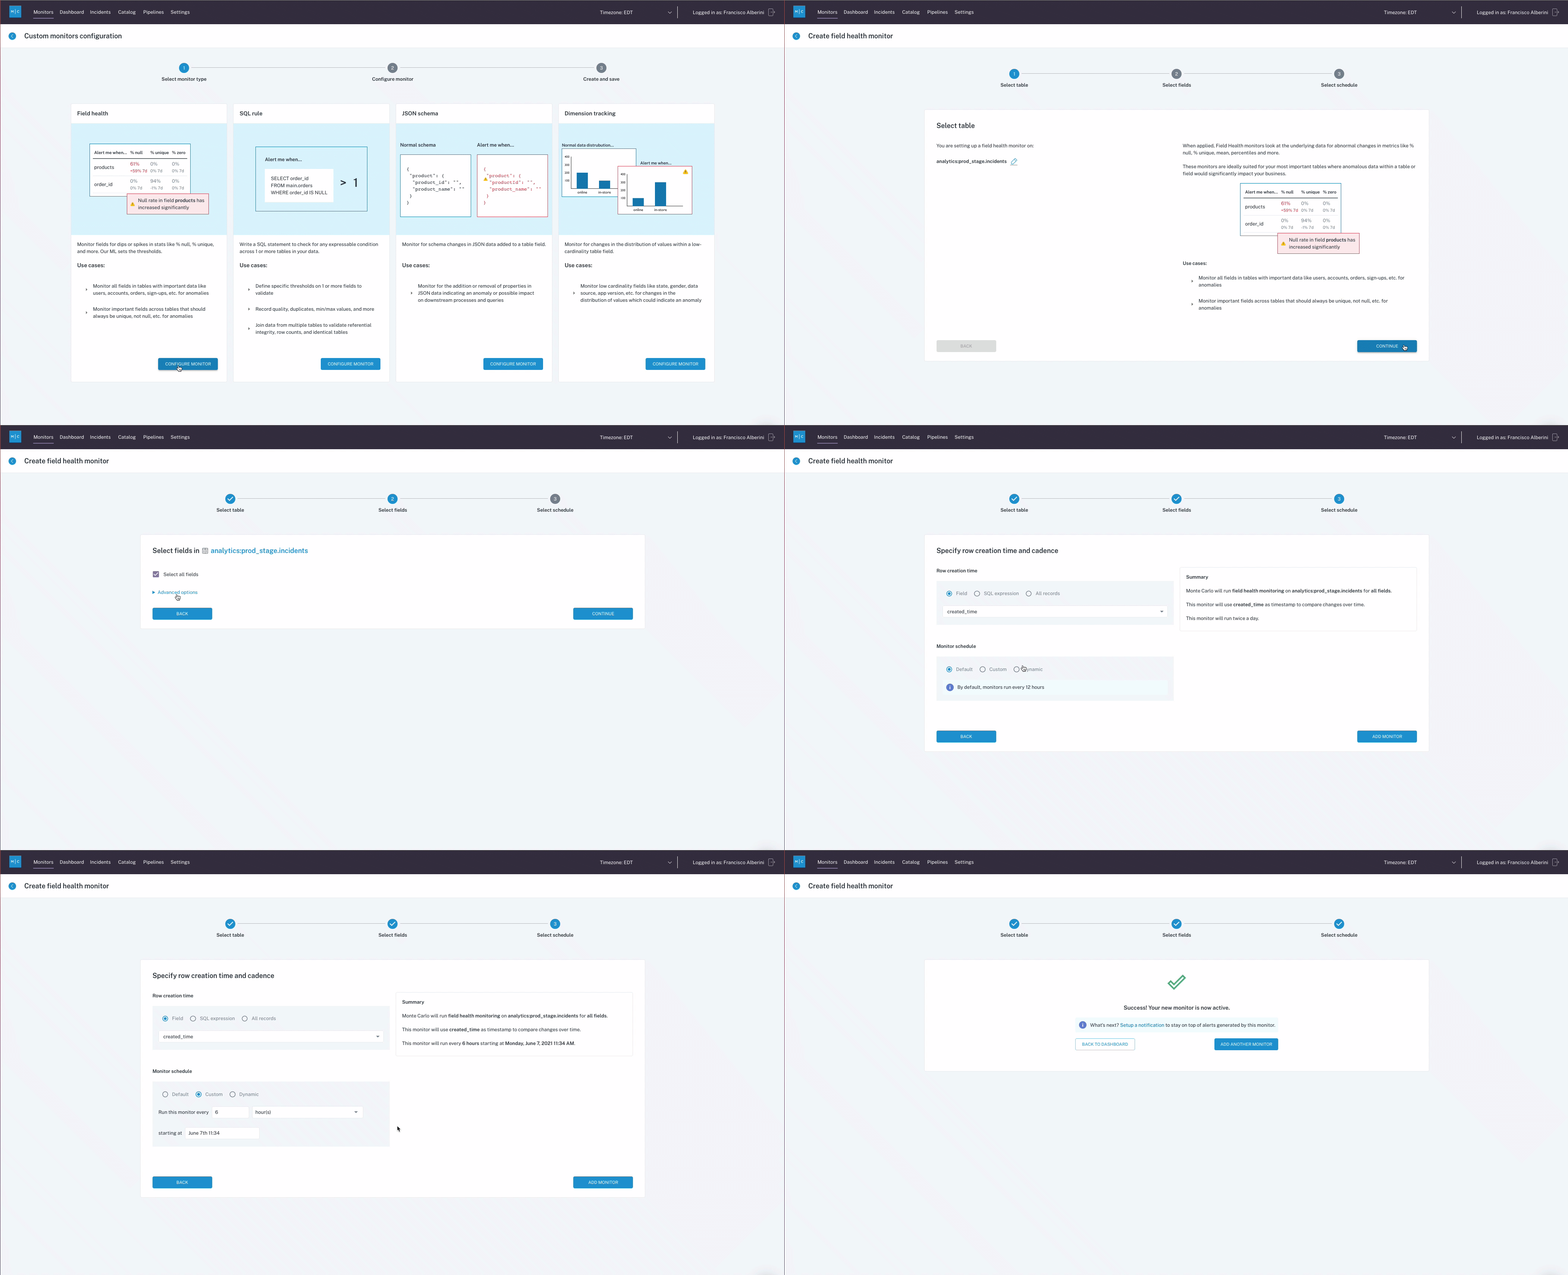
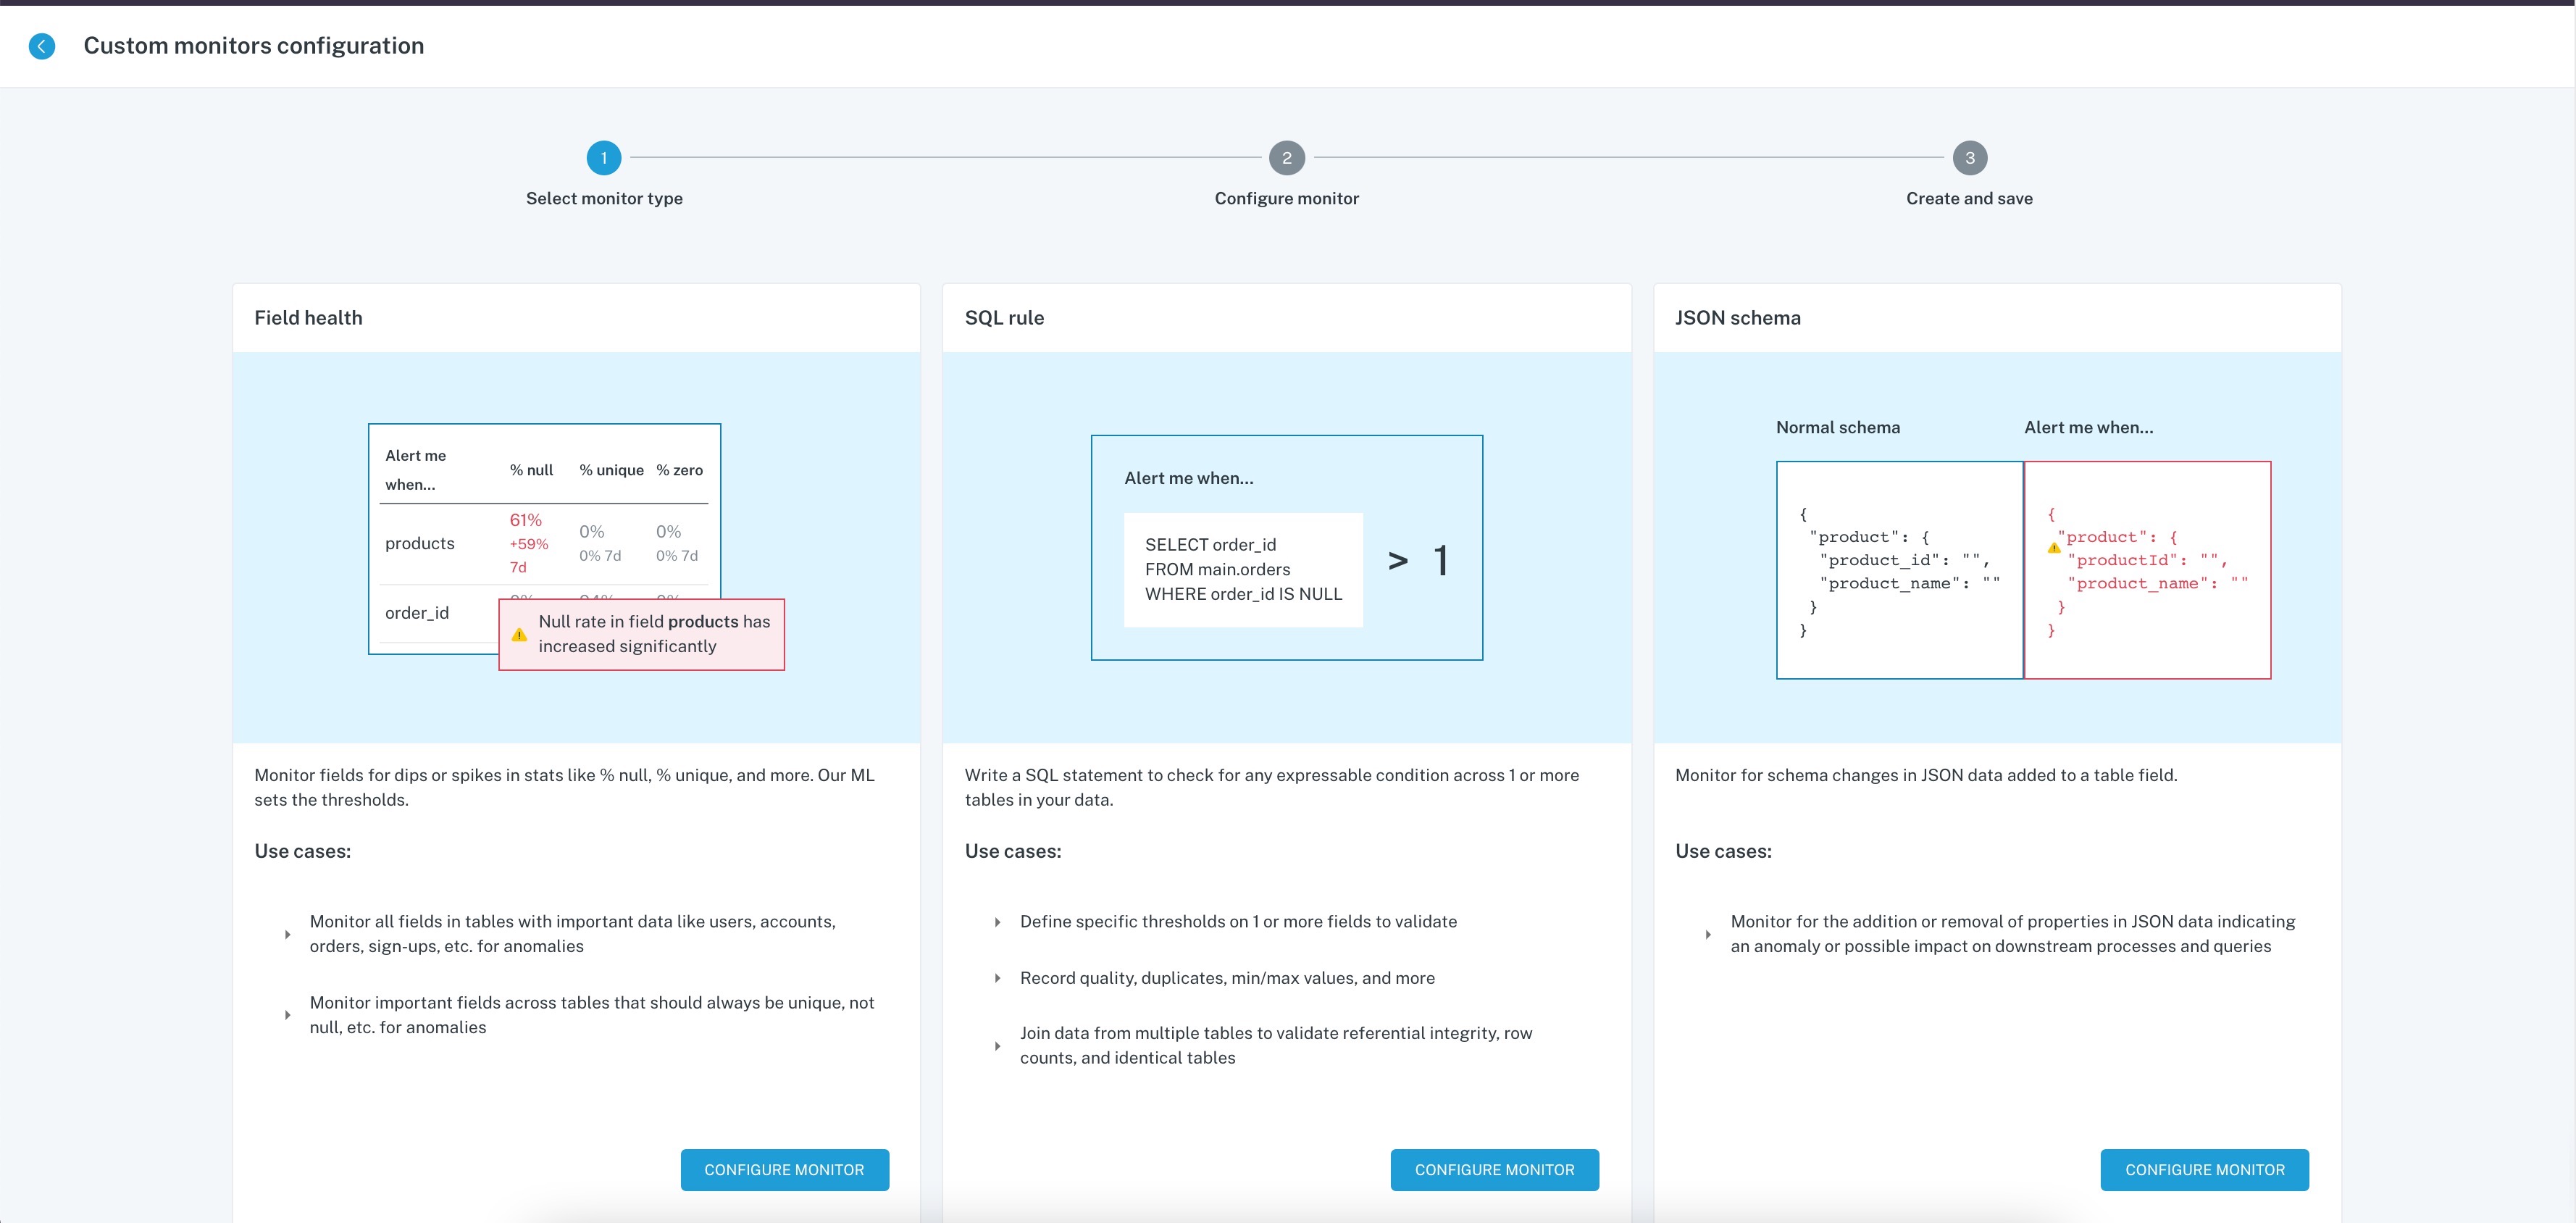
  • Monitors flow revamp: Our engineering team is incrementally releasing a new flow for creating, managing and updating Field Health, Dimension Tracking, SQL Rule and JSON Schema Monitors - keep an eye out for the new Monitors summary table coming soon

Here's what we've been up to over the last week at Monte Carlo.

What's New

  • Expanded support for Looker objects in the Pipelines graph: We now show Looker Views, Explores, Looks and Dashboards in lineage\\
  • SQL Rule Notifications Routing: You can now route Slack, email, webhook and PagerDuty Notifications by SQL Rule Improvements
  • Improved Pipelines graph performance: We now support more complex Pipeline graphs increasing the number of supported objects (tables, views, etc) and paths by 10x
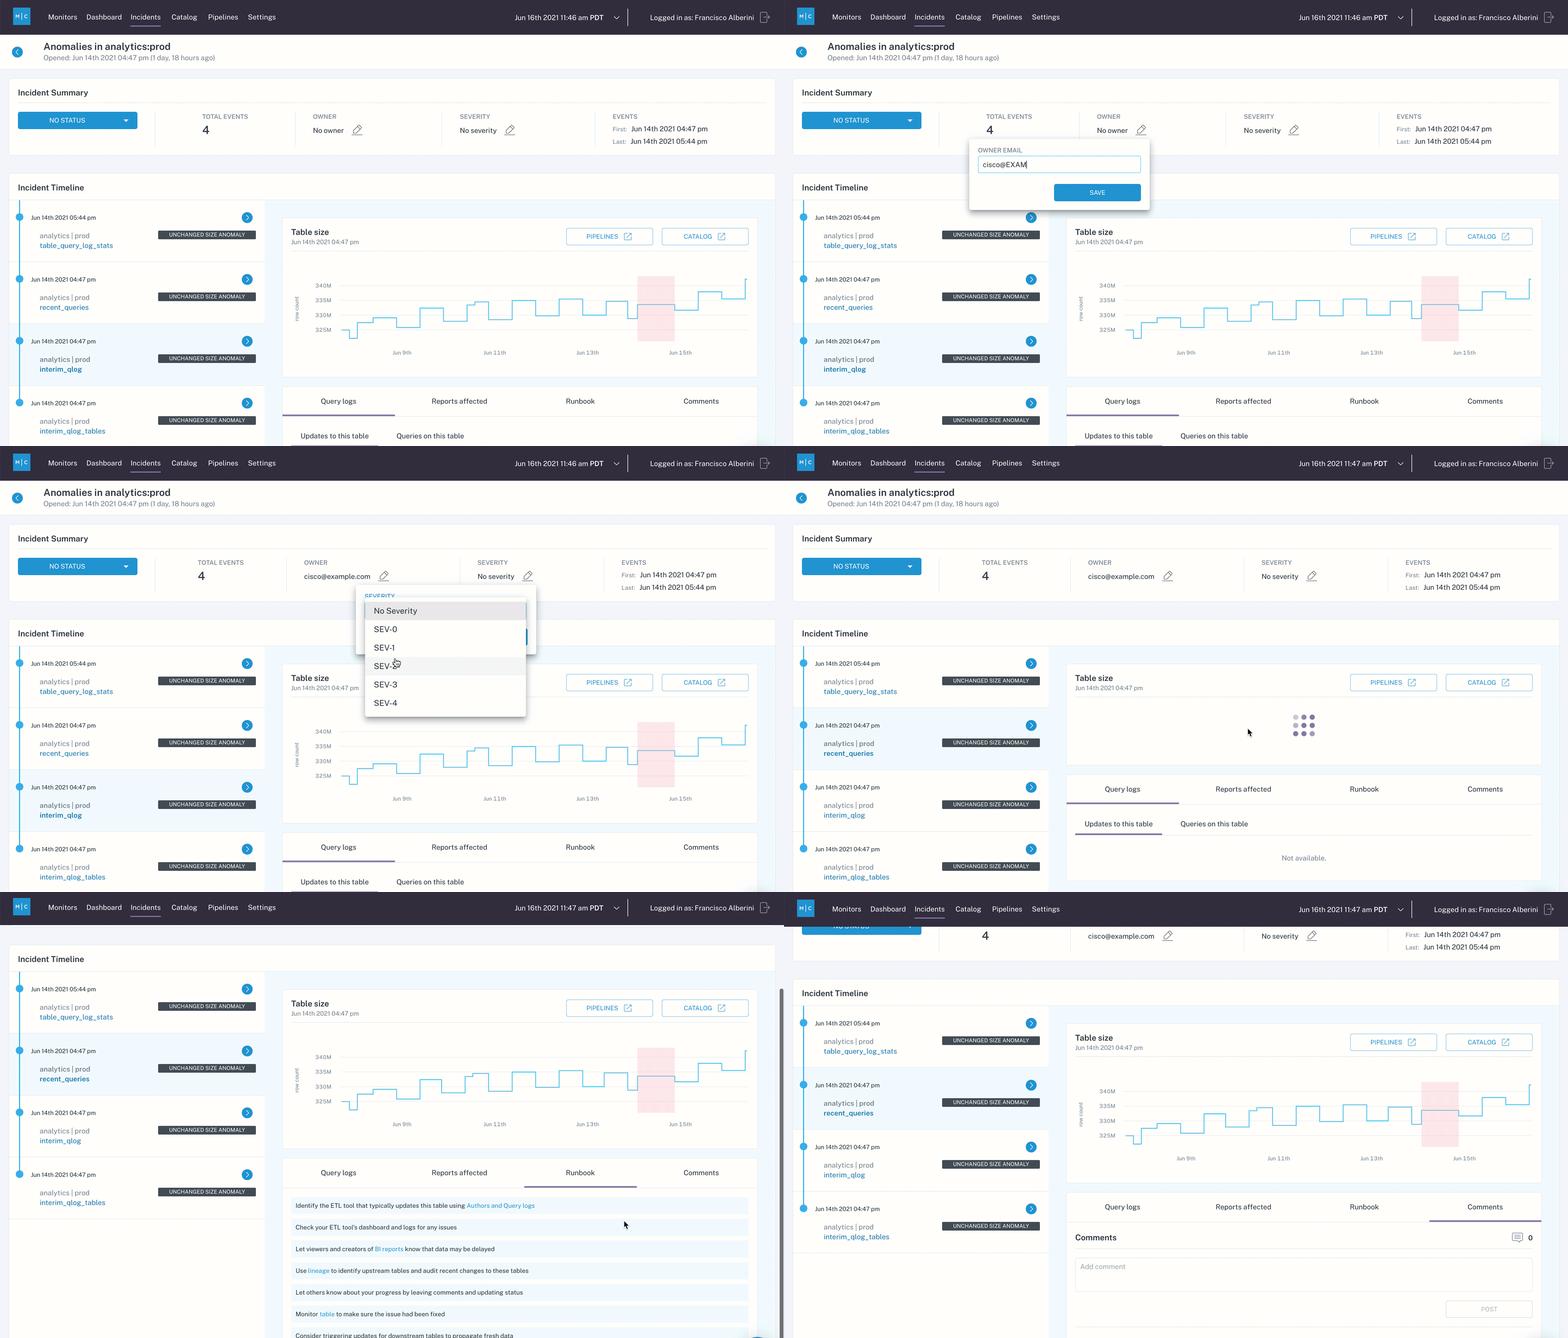
  • Smarter event grouping in Incidents: Now when an Incident status is updated to anything besides Investigating, new tables will not be added to the incident to minimize the risk of the new anomalous table silently grouping into a Fixed issue What's next!
  • Service Level Indicators: We're working on the ability to allow customers to define specific thresholds for our Freshness, Volume and Field Health monitors - these SLIs will allow customers to define SLOs and ultimately commit to data SLAs\\
  • Monitors flow revamp: Our engineering team is incrementally releasing a new flow for creating, managing and updating Field Health, Dimension Tracking, SQL Rule and JSON Schema Monitors - Keep an eye out for the new Monitors summary table coming soon