These operators make it easy to express a condition like "Alert me if the value returned by the SQL is not between 5 and 5,000." Previously, this would have needed multiple SQL Rules to express.
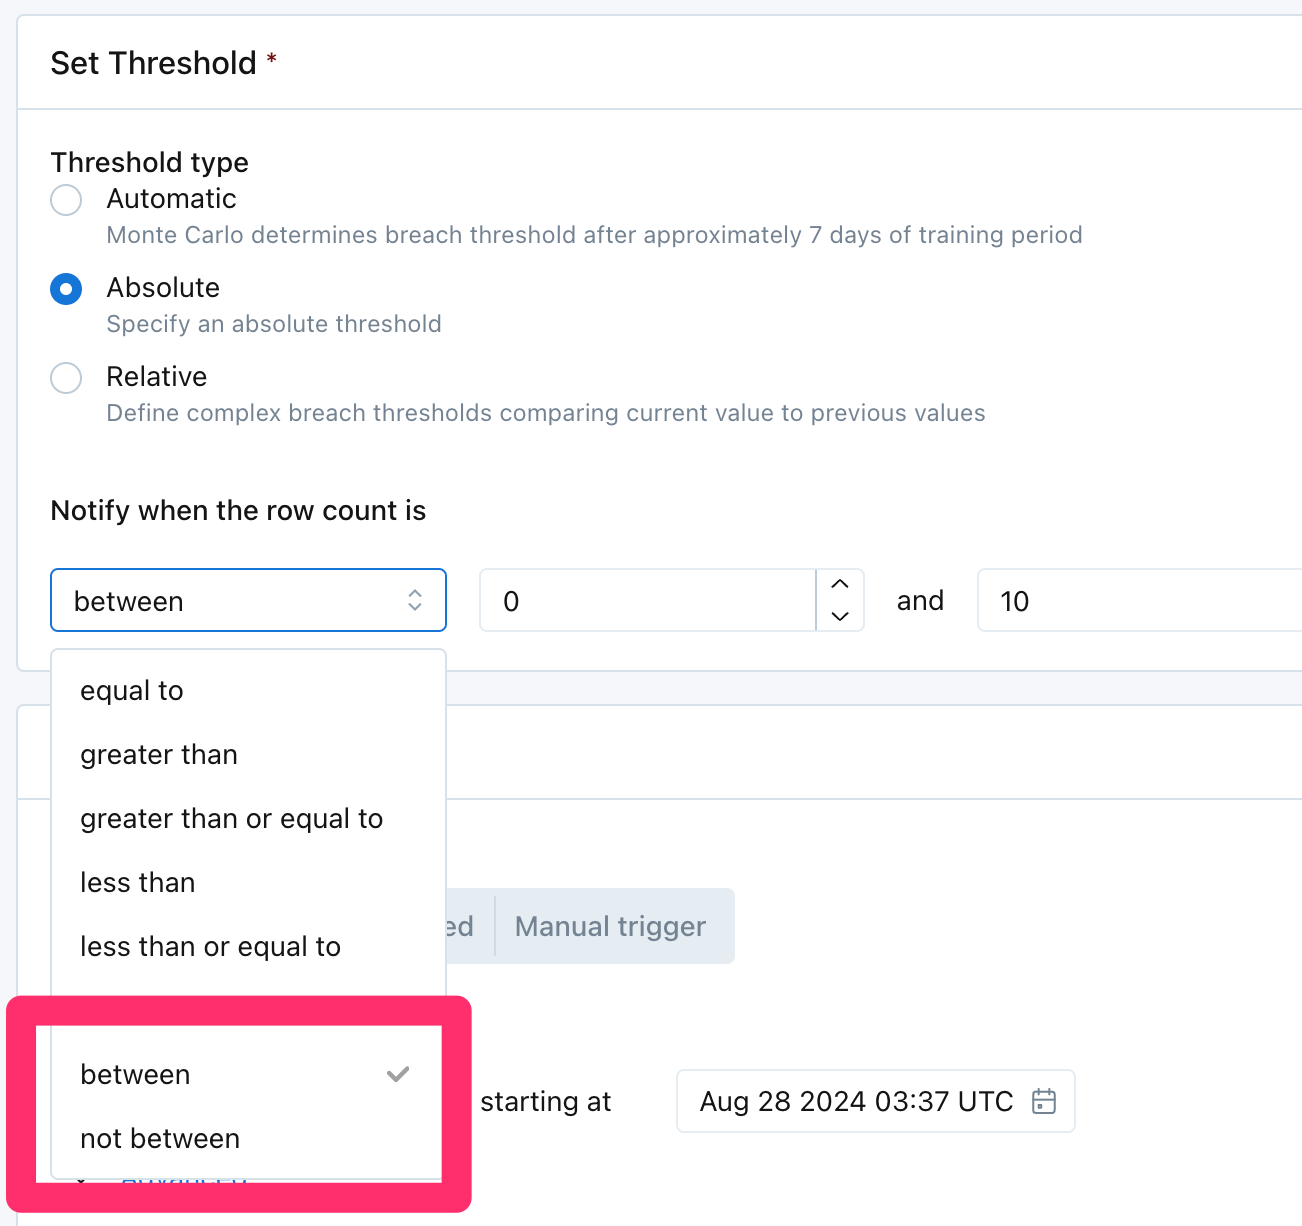
These operators make it easy to express a condition like "Alert me if the value returned by the SQL is not between 5 and 5,000." Previously, this would have needed multiple SQL Rules to express.

MC-Dremio integration is now available. Customers can run SQL monitor, comparison rules, and schema change detections on Dremio with MC. Both Dremio cloud and Dremio software are supported. Docs here https://docs.getmontecarlo.com/docs/dremio
dbt Job and model info are now overlaid on lineage. Job info is shown on lineage edges, model last run status and timestamp are shown on nodes.
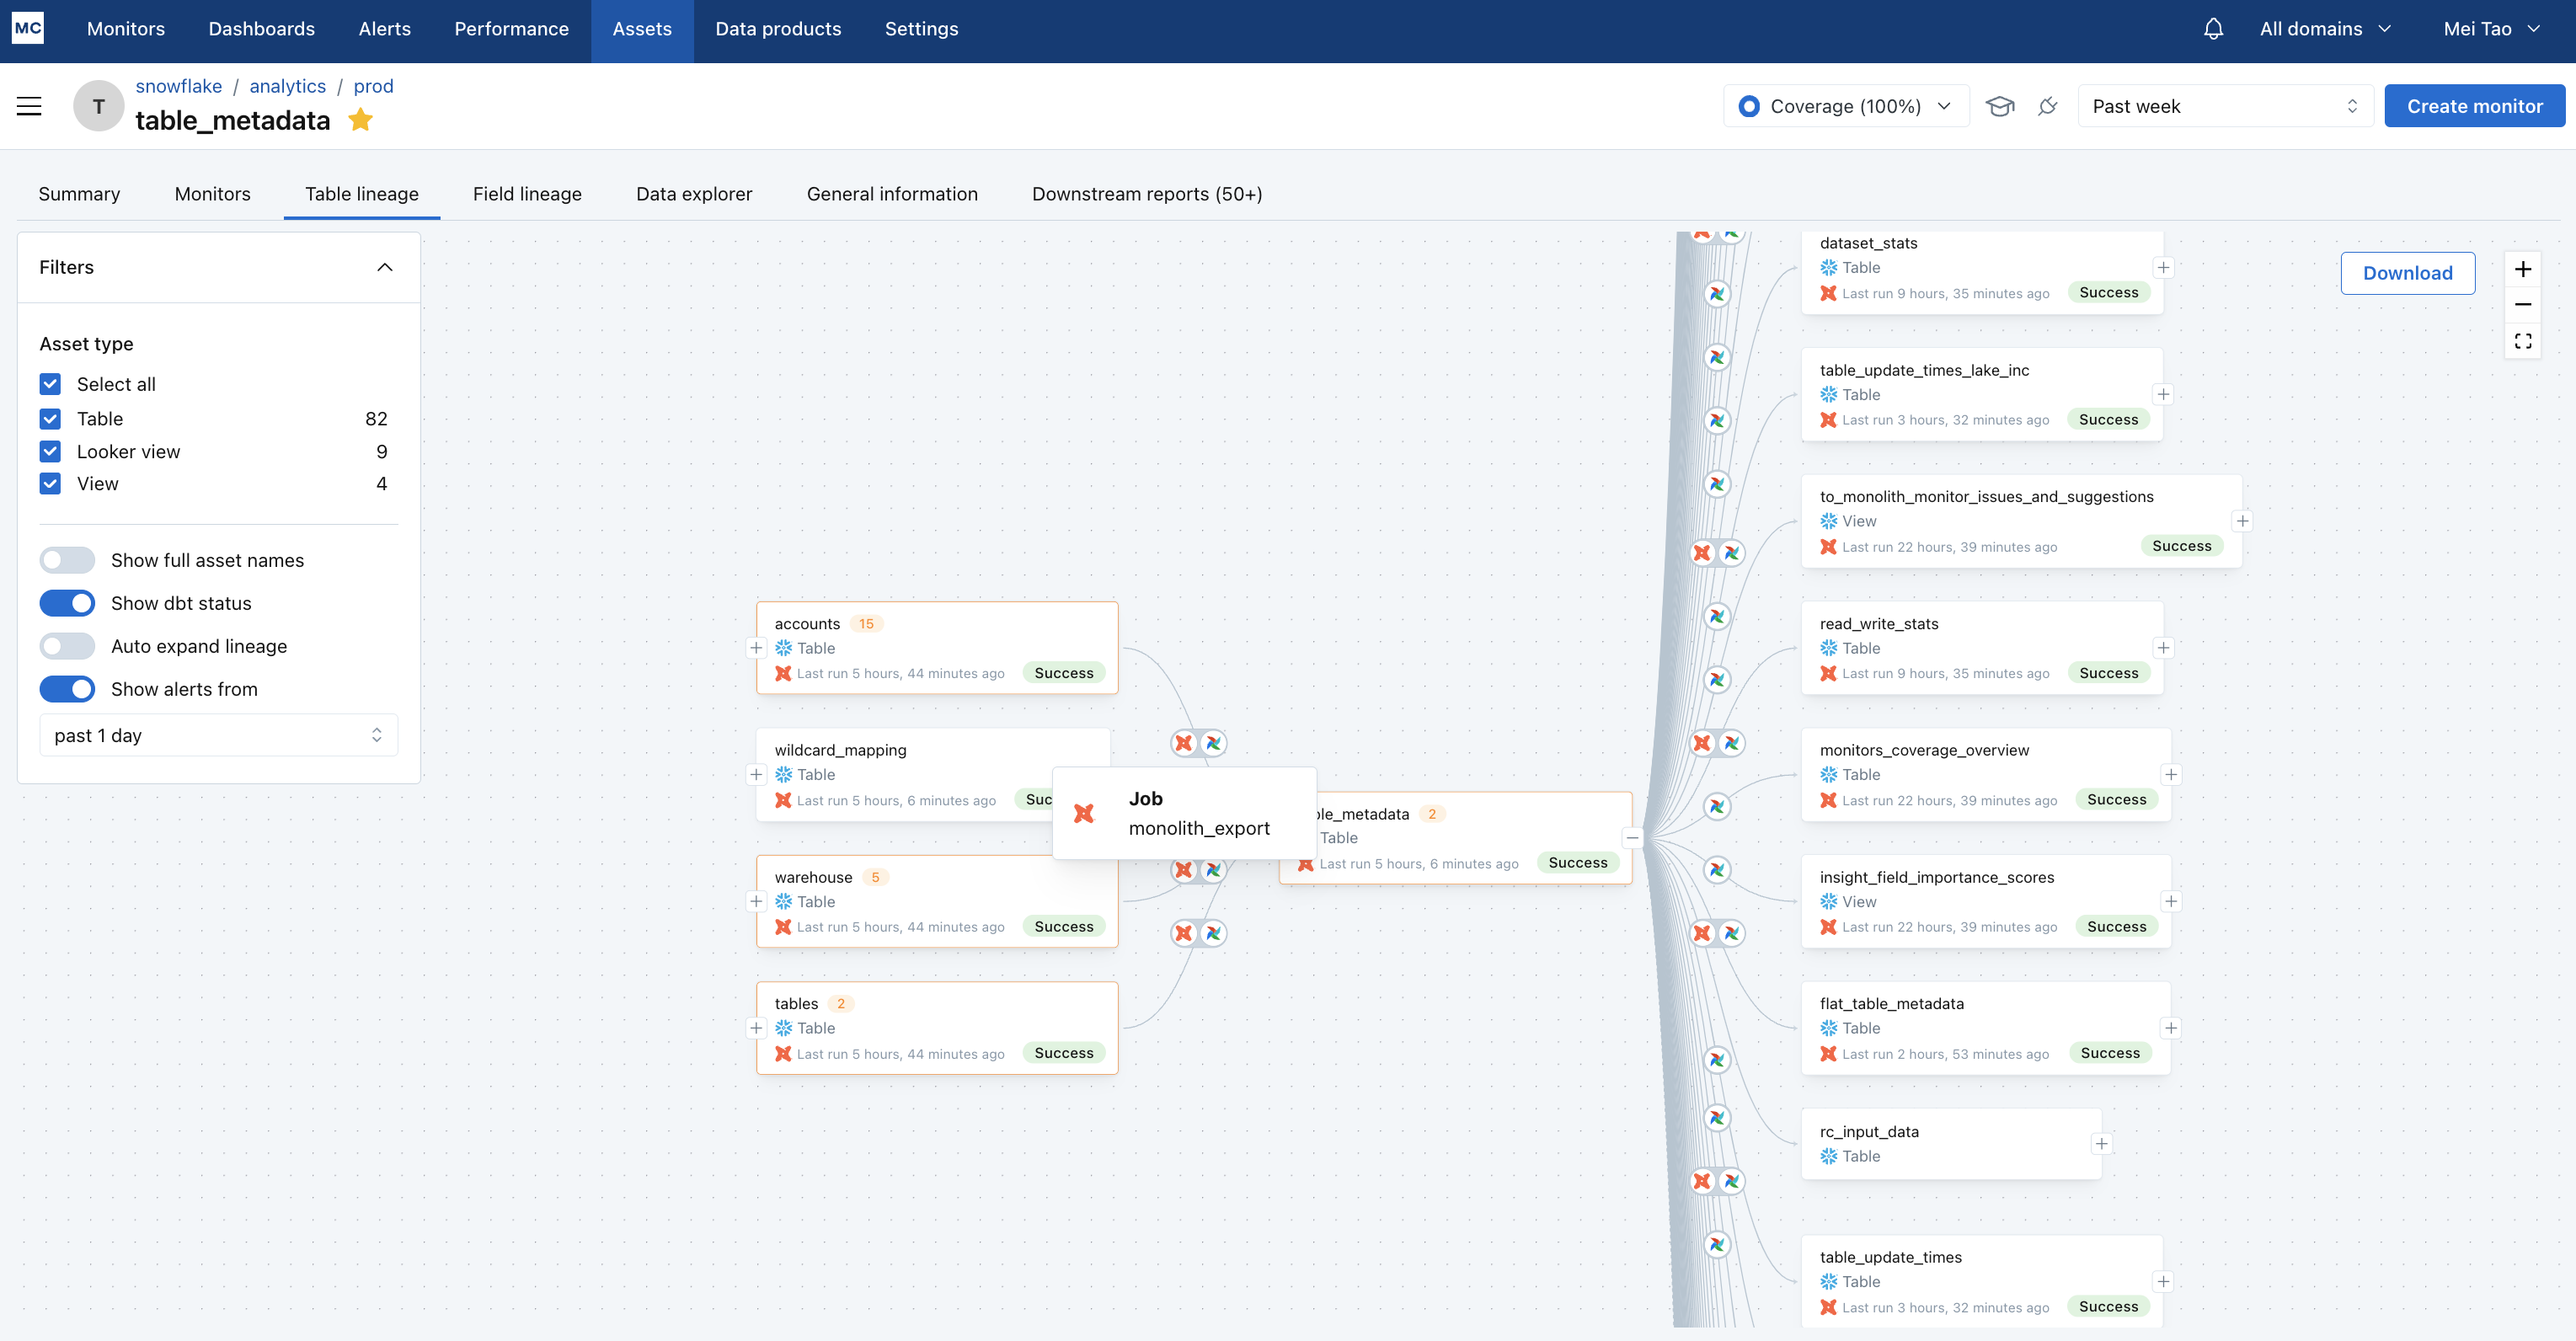
Table and column tags are now automatically imported from Unity Catalog to Monte Carlo. Table tags will show up on Assets page, General Information tab, column tags will show up on Field Lineage tab. Make sure your data collector is updated to the latest version.
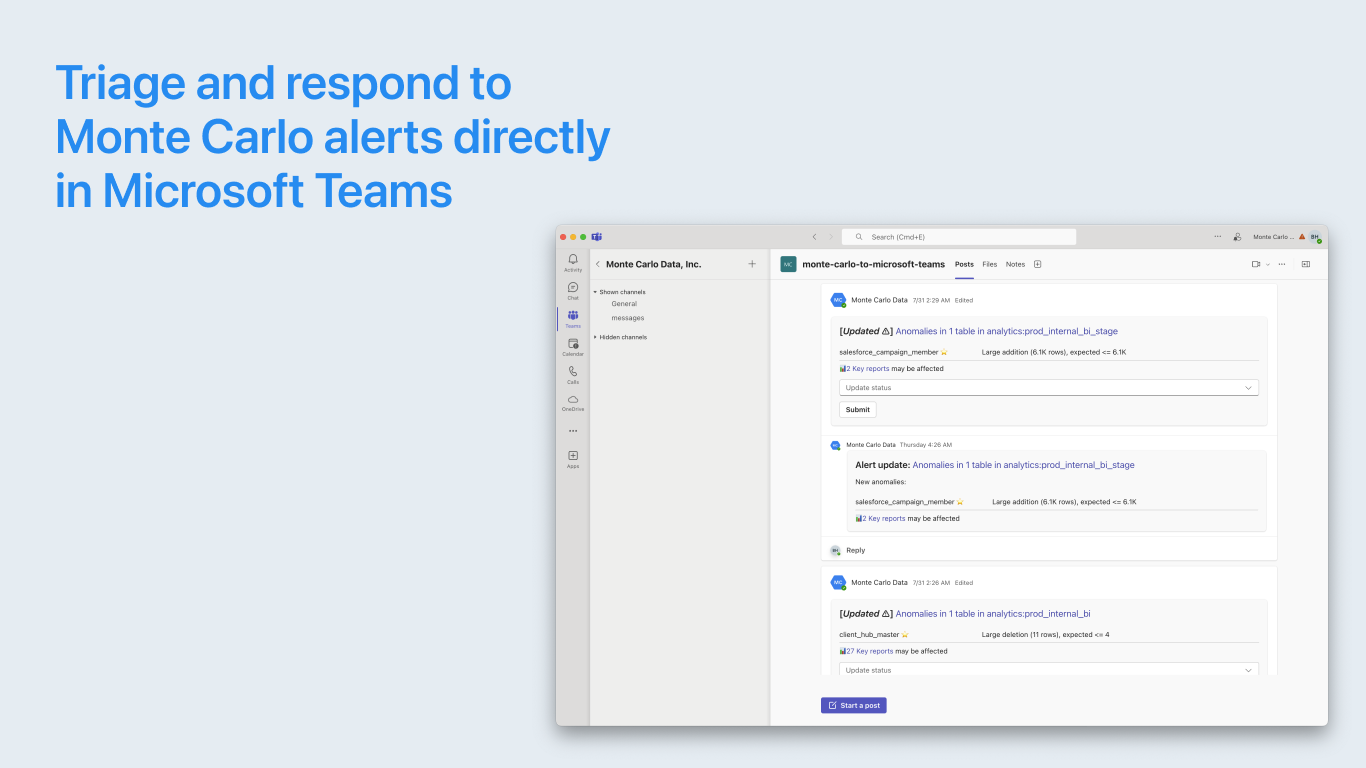
Monte Carlo now has a dedicated native app in the Microsoft Teams Store. It allows anomaly detections to be sent to any public channel in your workspace for quick triage and collaboration.
Learn more in the revamped Microsoft Teams integration documentation.
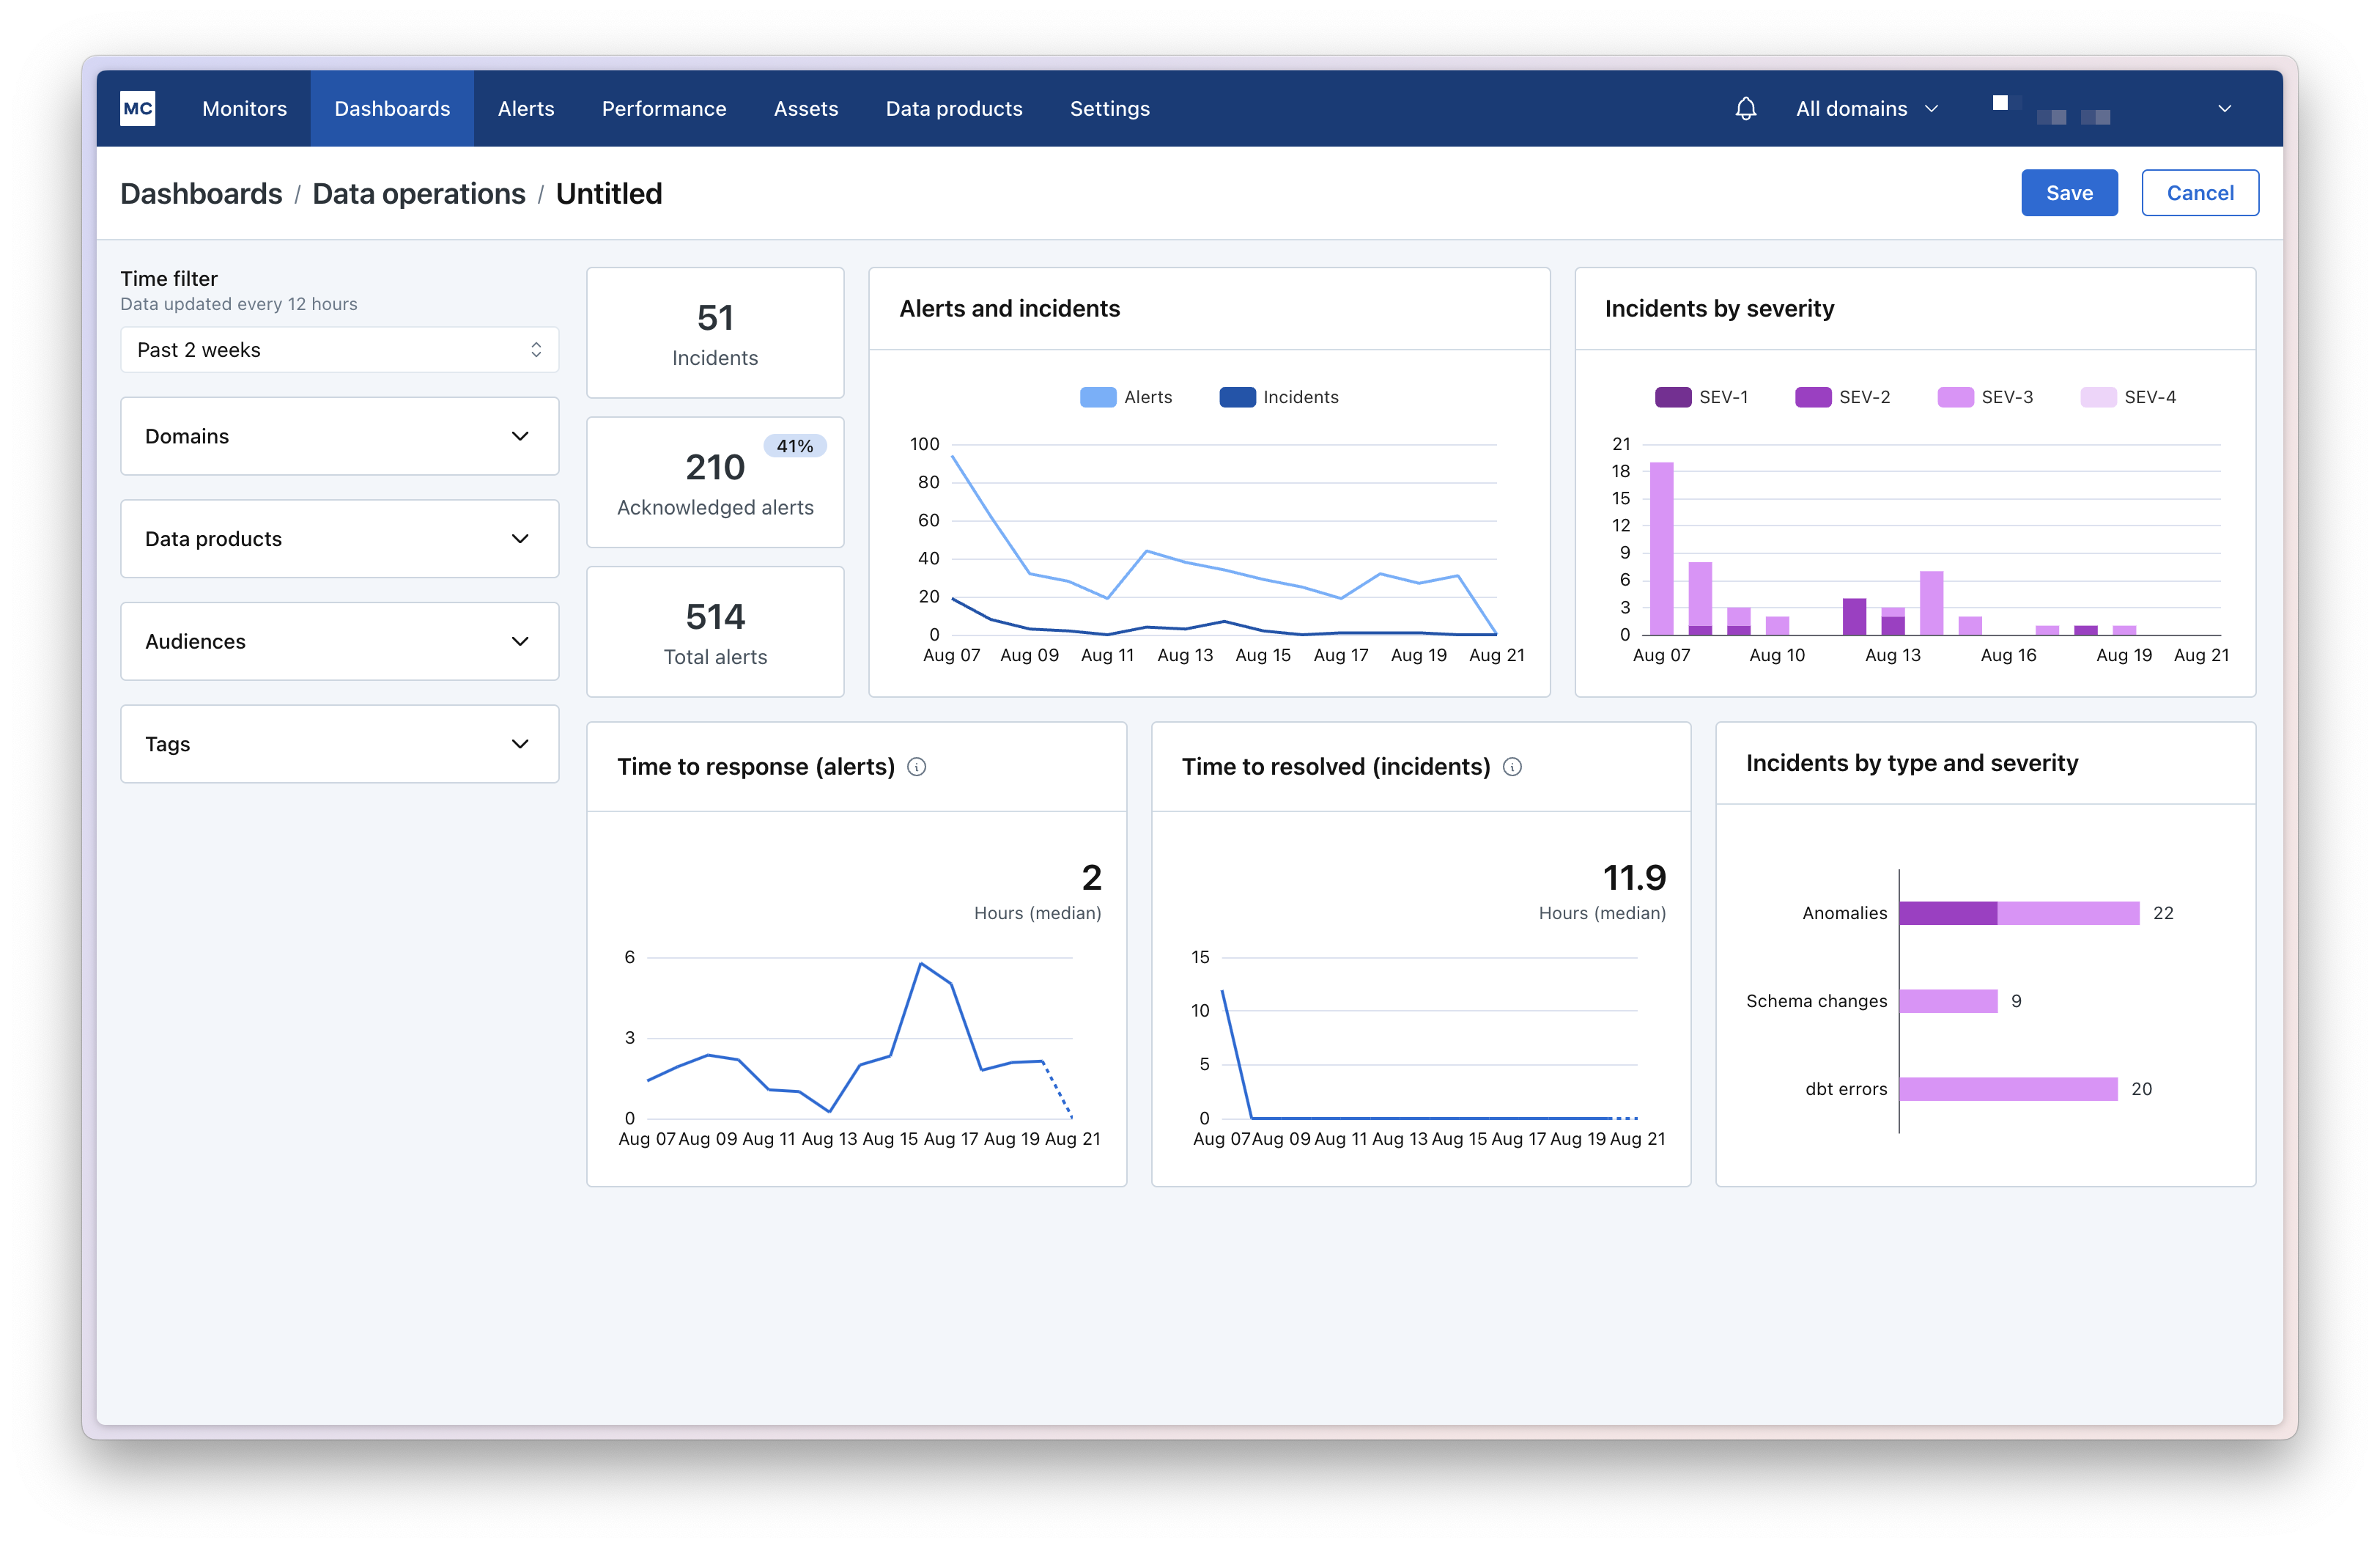
The data operations dashboard provides a look at team operational metrics:
The key changes around reporting on data operations are:
Learn more about metrics, filters, and saving dashboards in the Data operations (beta) documentation!
The data operations dashboard has replaced some of the content on the data reliability dashboard and the data reliability dashboard is being deprecated. Some of the content has moved to the Activity dashboard. If you have needs around deprecated content, please reach out here. This is a beta release.

The actions available on Slack notifications now match the alerts in the web application. With any alert, Acknowledge, Resolve, or Mark as incident with quick action buttons. You can still set owners, snooze rules, and more in the overflow actions.
Monte Carlo is upgrading its internal collection platform architecture and will be phasing out the Data Collector. To ensure a smooth transition and maintain seamless connectivity to active integrations, customers are required to perform specific actions within designated timeframes.
Starting July 31, 2024, account owners will be contacted if any action is required. The timelines for these actions may vary depending on your deployment. If you do not receive a notification, no action is necessary at this time. This post serves primarily as an informational update.
For further details, including documentation and FAQs, please visit: https://mc-d.io/Nq2ao1k
Should you have any questions, feel free to reach out to us at [email protected]. We are always here to assist you!
We've shipped a large set of improvements to Metric Monitors, including:
Change in row count and Time since last change in row count. These serve as great measurements for freshness and volume when monitoring data by segmentThese improvements allow customers to track 10x more segments per monitor than before, and provides a much more purpose-built experience for doing freshness or volume monitoring with metric monitors.
Last week, we released Validation Monitors. These make it easy for data analysts and engineers to create no-code checks for common data quality issues.
Some examples:
loan_origination_date is in the futuremember_id is not 13 characters AND ins_provider = ‘United Healthcare’ OR member_start_date is in futurecountry equals ‘UK’ AND post_code is not UK Postal Code) OR country is nullYou’re alerted to any rows that fail the validation (“invalid rows”) so you can identify, track, and resolve any bad data. All without writing SQL!
This initial release includes a rich set of operators and a hundred out-of-the-box templates. Try creating one! Go to the Monitor Menu and select Validation. To learn more, see our documentation.