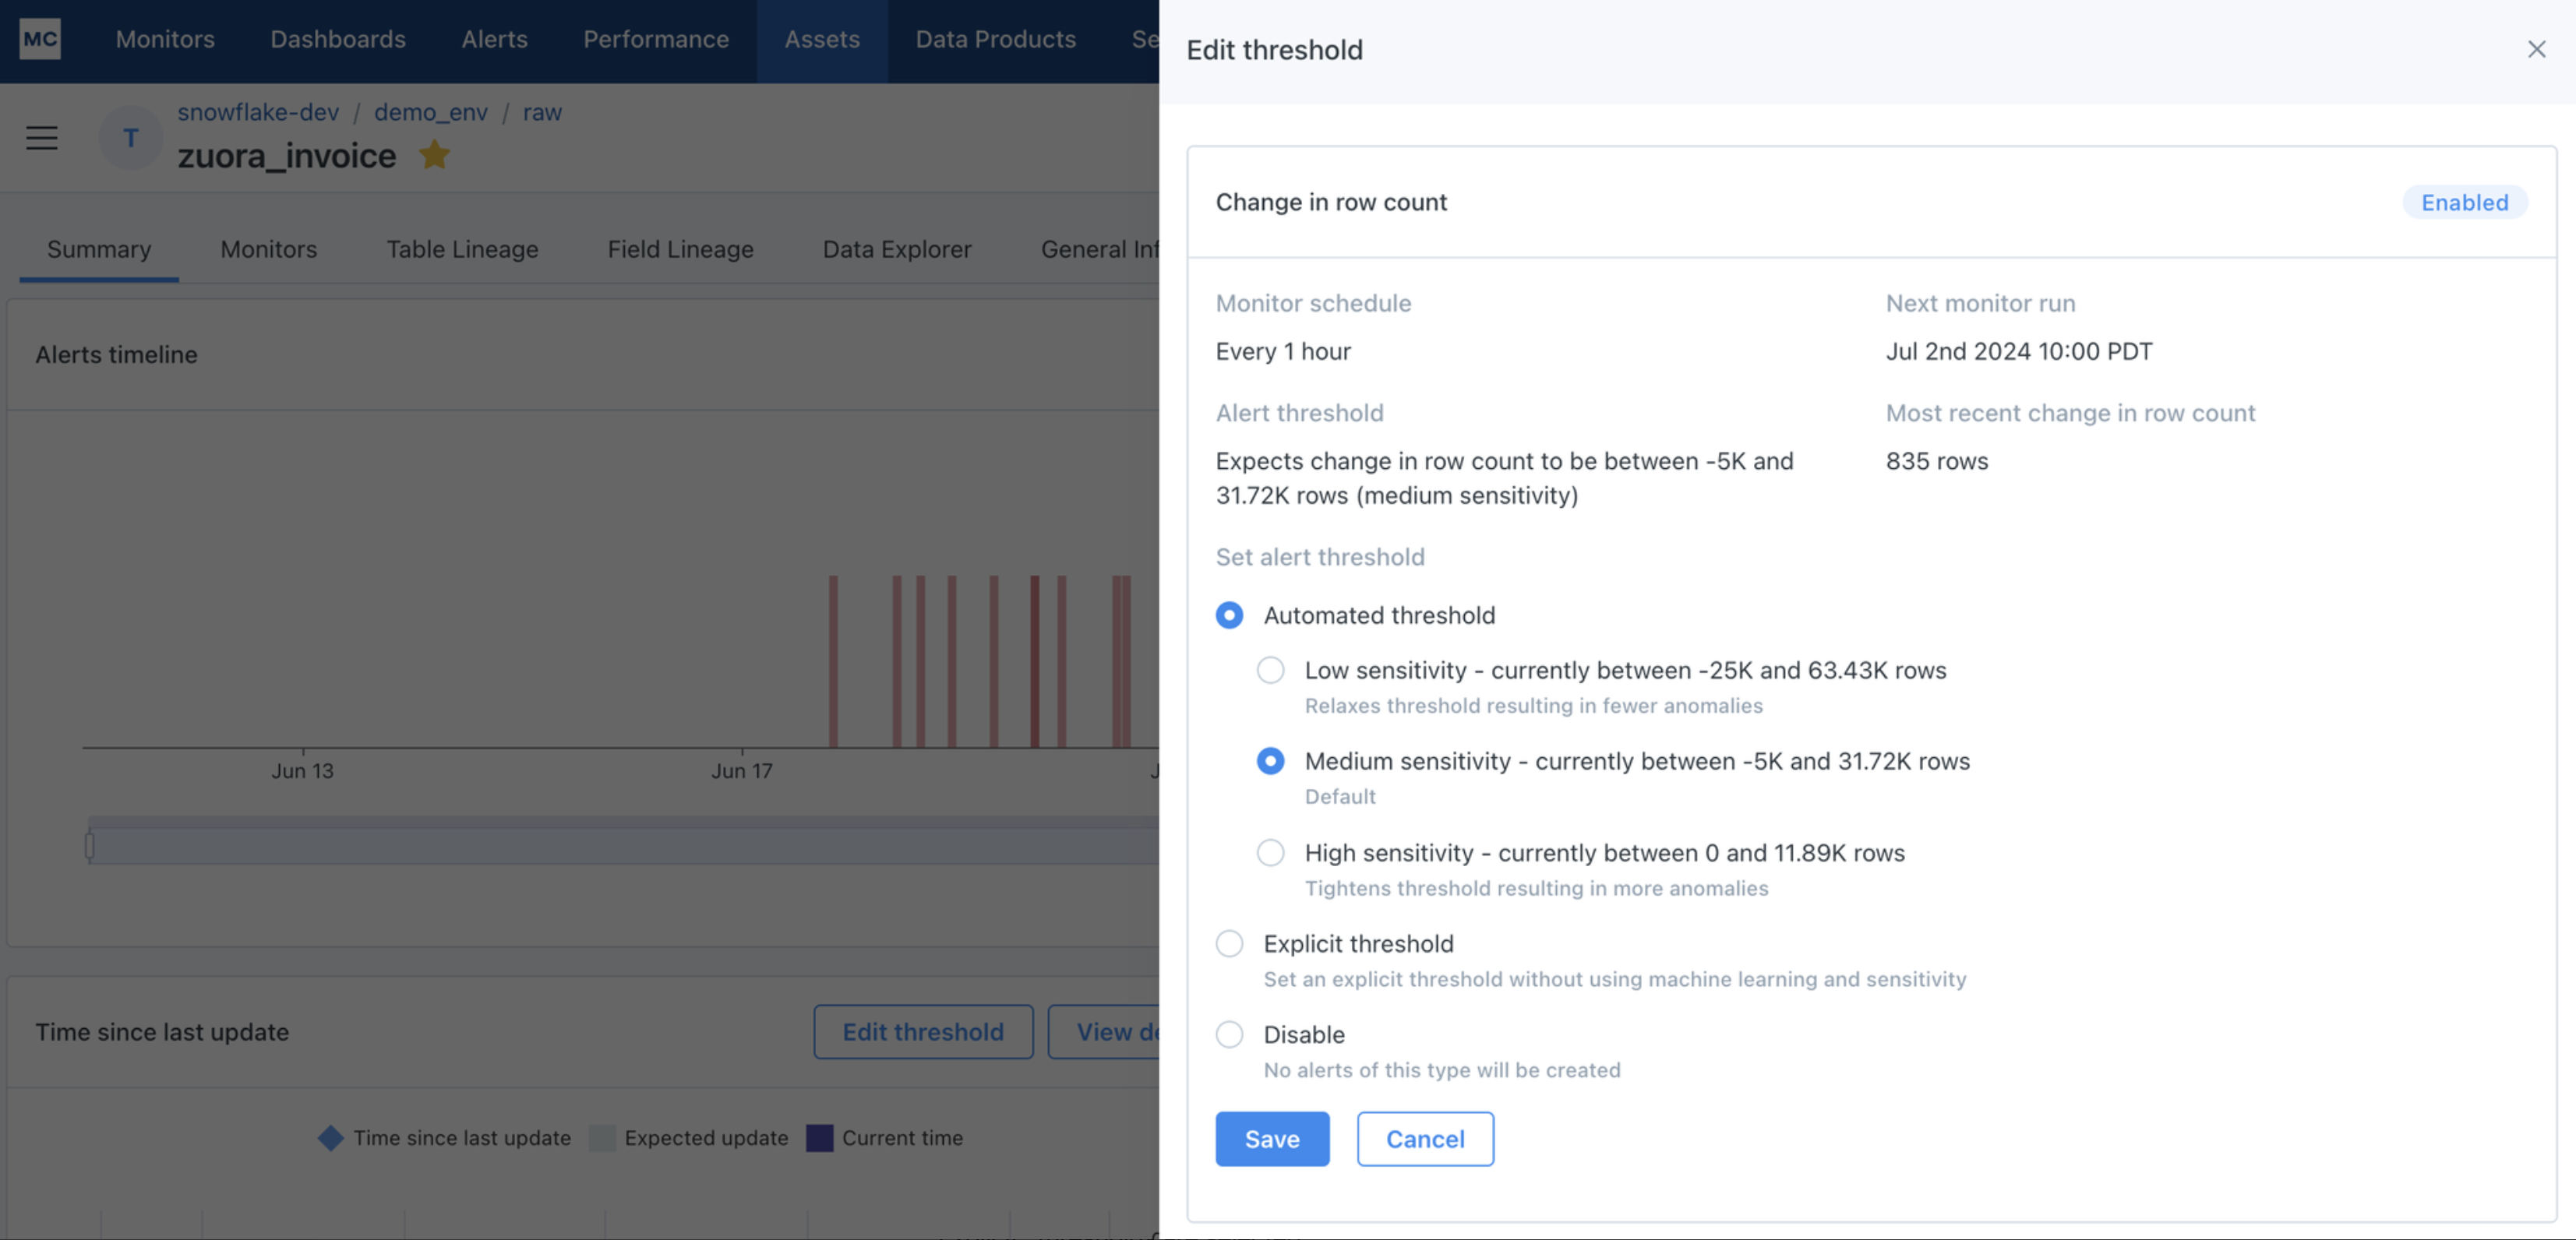
Users can now manage their freshness thresholds - whether automatic or manual - all from Assets > Freshness. To see this drawer, click View Details on the Freshness widget in Assets. User can then click Edit and choose between:

  • Automatic: ML will determine the threshold, and the user can choose between High/Med/Low sensitivity.
  • Explicit: User will determine the threshold
  • Disable: Freshness monitoring will be turned off for the table.

Freshness thresholds set through Assets > Freshness will follow the notification routing and grouping logic of out-of-the-box freshness monitors, regardless of whether “Automatic” or “Explicit” thresholds are selected.

These changes are geared to give users one place to manage the freshness thresholds for a table, instead of being fragmented across different experiences for out-of-the-box freshness and Freshness Rules.

We will continue investing in easy and scalable ways to deploy manual thresholds. But we don’t think that the old experience for Freshness Rules is the right path. As a result, we’re removing the ability to create the old-style Freshness Rules through the UI. Existing Freshness Rules will continue to function, and users can continue to create them through Monitors as Code. More details to come.

To learn more, see our documentation for Freshness monitoring.

We’re refreshing charts across the app so they all have 1) a clearly defined metric, 2) a clear threshold, 3) a legend, 4) properly scaled and labeled axis, 5) clearly marked anomalies.

New volume charts show just that – clear metrics (toggle between row count, or change in row count), clear thresholds, an interactive legend, better axis scaling, and clear anomalies. This improves usability and interpretability, so that understanding an anomaly is simple.

In October 2023, a new notifications framework was released, called Notifications 2.0. By February 5, over 99% of customers have been fully migrated to this new framework.

As a result, Notifications 2.0 is now renamed just Notifications. The few customers still on the legacy framework see the tab Notifications (legacy) until it is fully deprecated.

You can now filter for 'No audience' on the /Monitors page. This will return the list of custom monitors that do not have any audience, making it easy to understand which monitors are not sending notifications to any recipients.

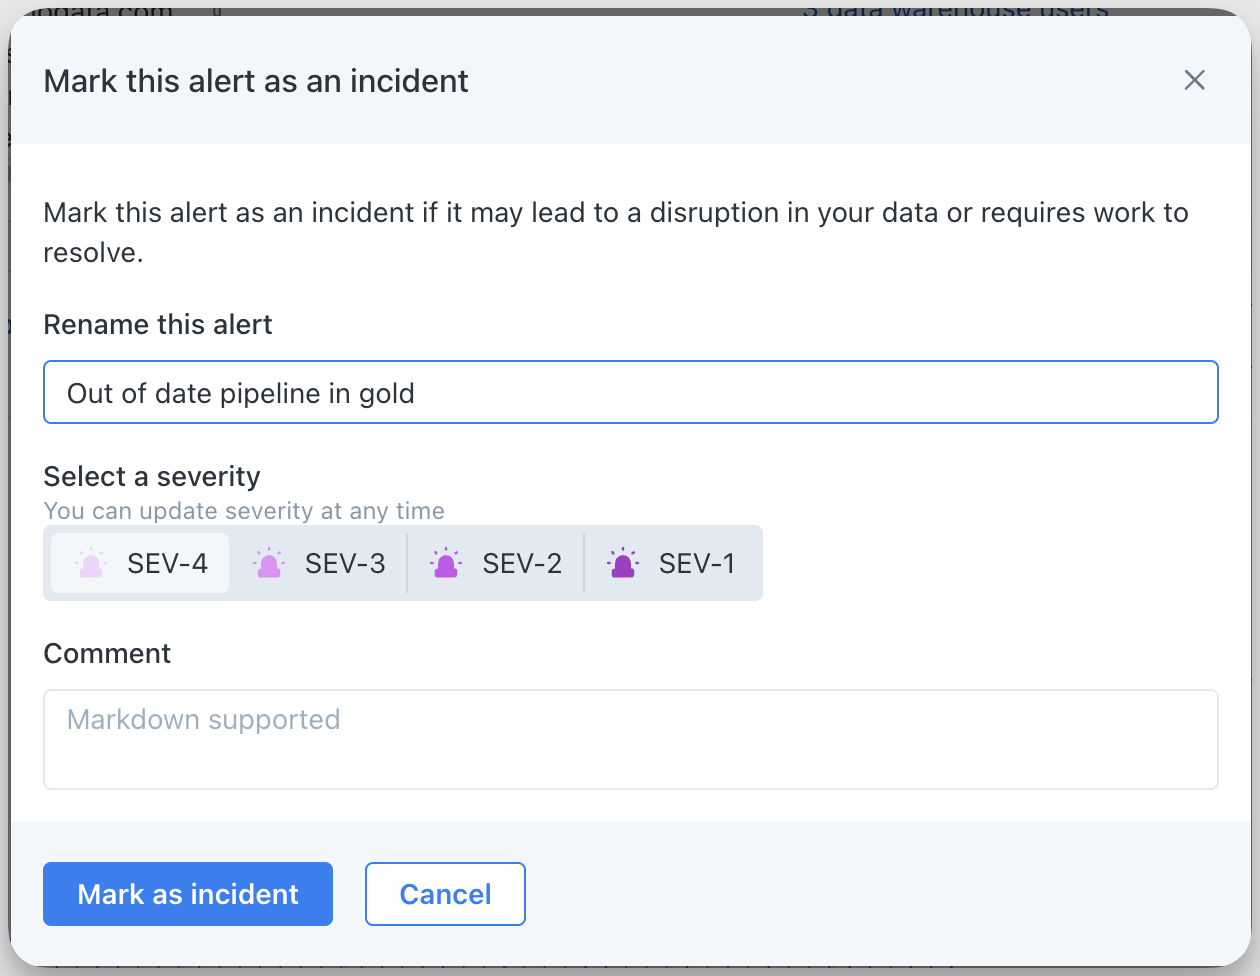
Our machine learning models continually adapt and improve based on user feedback. We've recently adjusted our training process. Now, marking an incident as 'Fixed' will have an effect similar to providing 'Helpful' feedback. Both actions will be used to adjust thresholds, ensuring the anomaly does not impact or increase them.

Starting in v0.80.0 of the CLI (releasing on February 7th, 2024), the "AWS profile name" and "AWS region" options will be removed from the initial configuration process (i.e., montecarlo configure), as this was not a necessary parameter for most commands.

The profile and region will now need to be set when interacting with any AWS-related commands via the aws-profile and aws-region flags.

The cli docs and help commands will indicate when these flags are necessary.

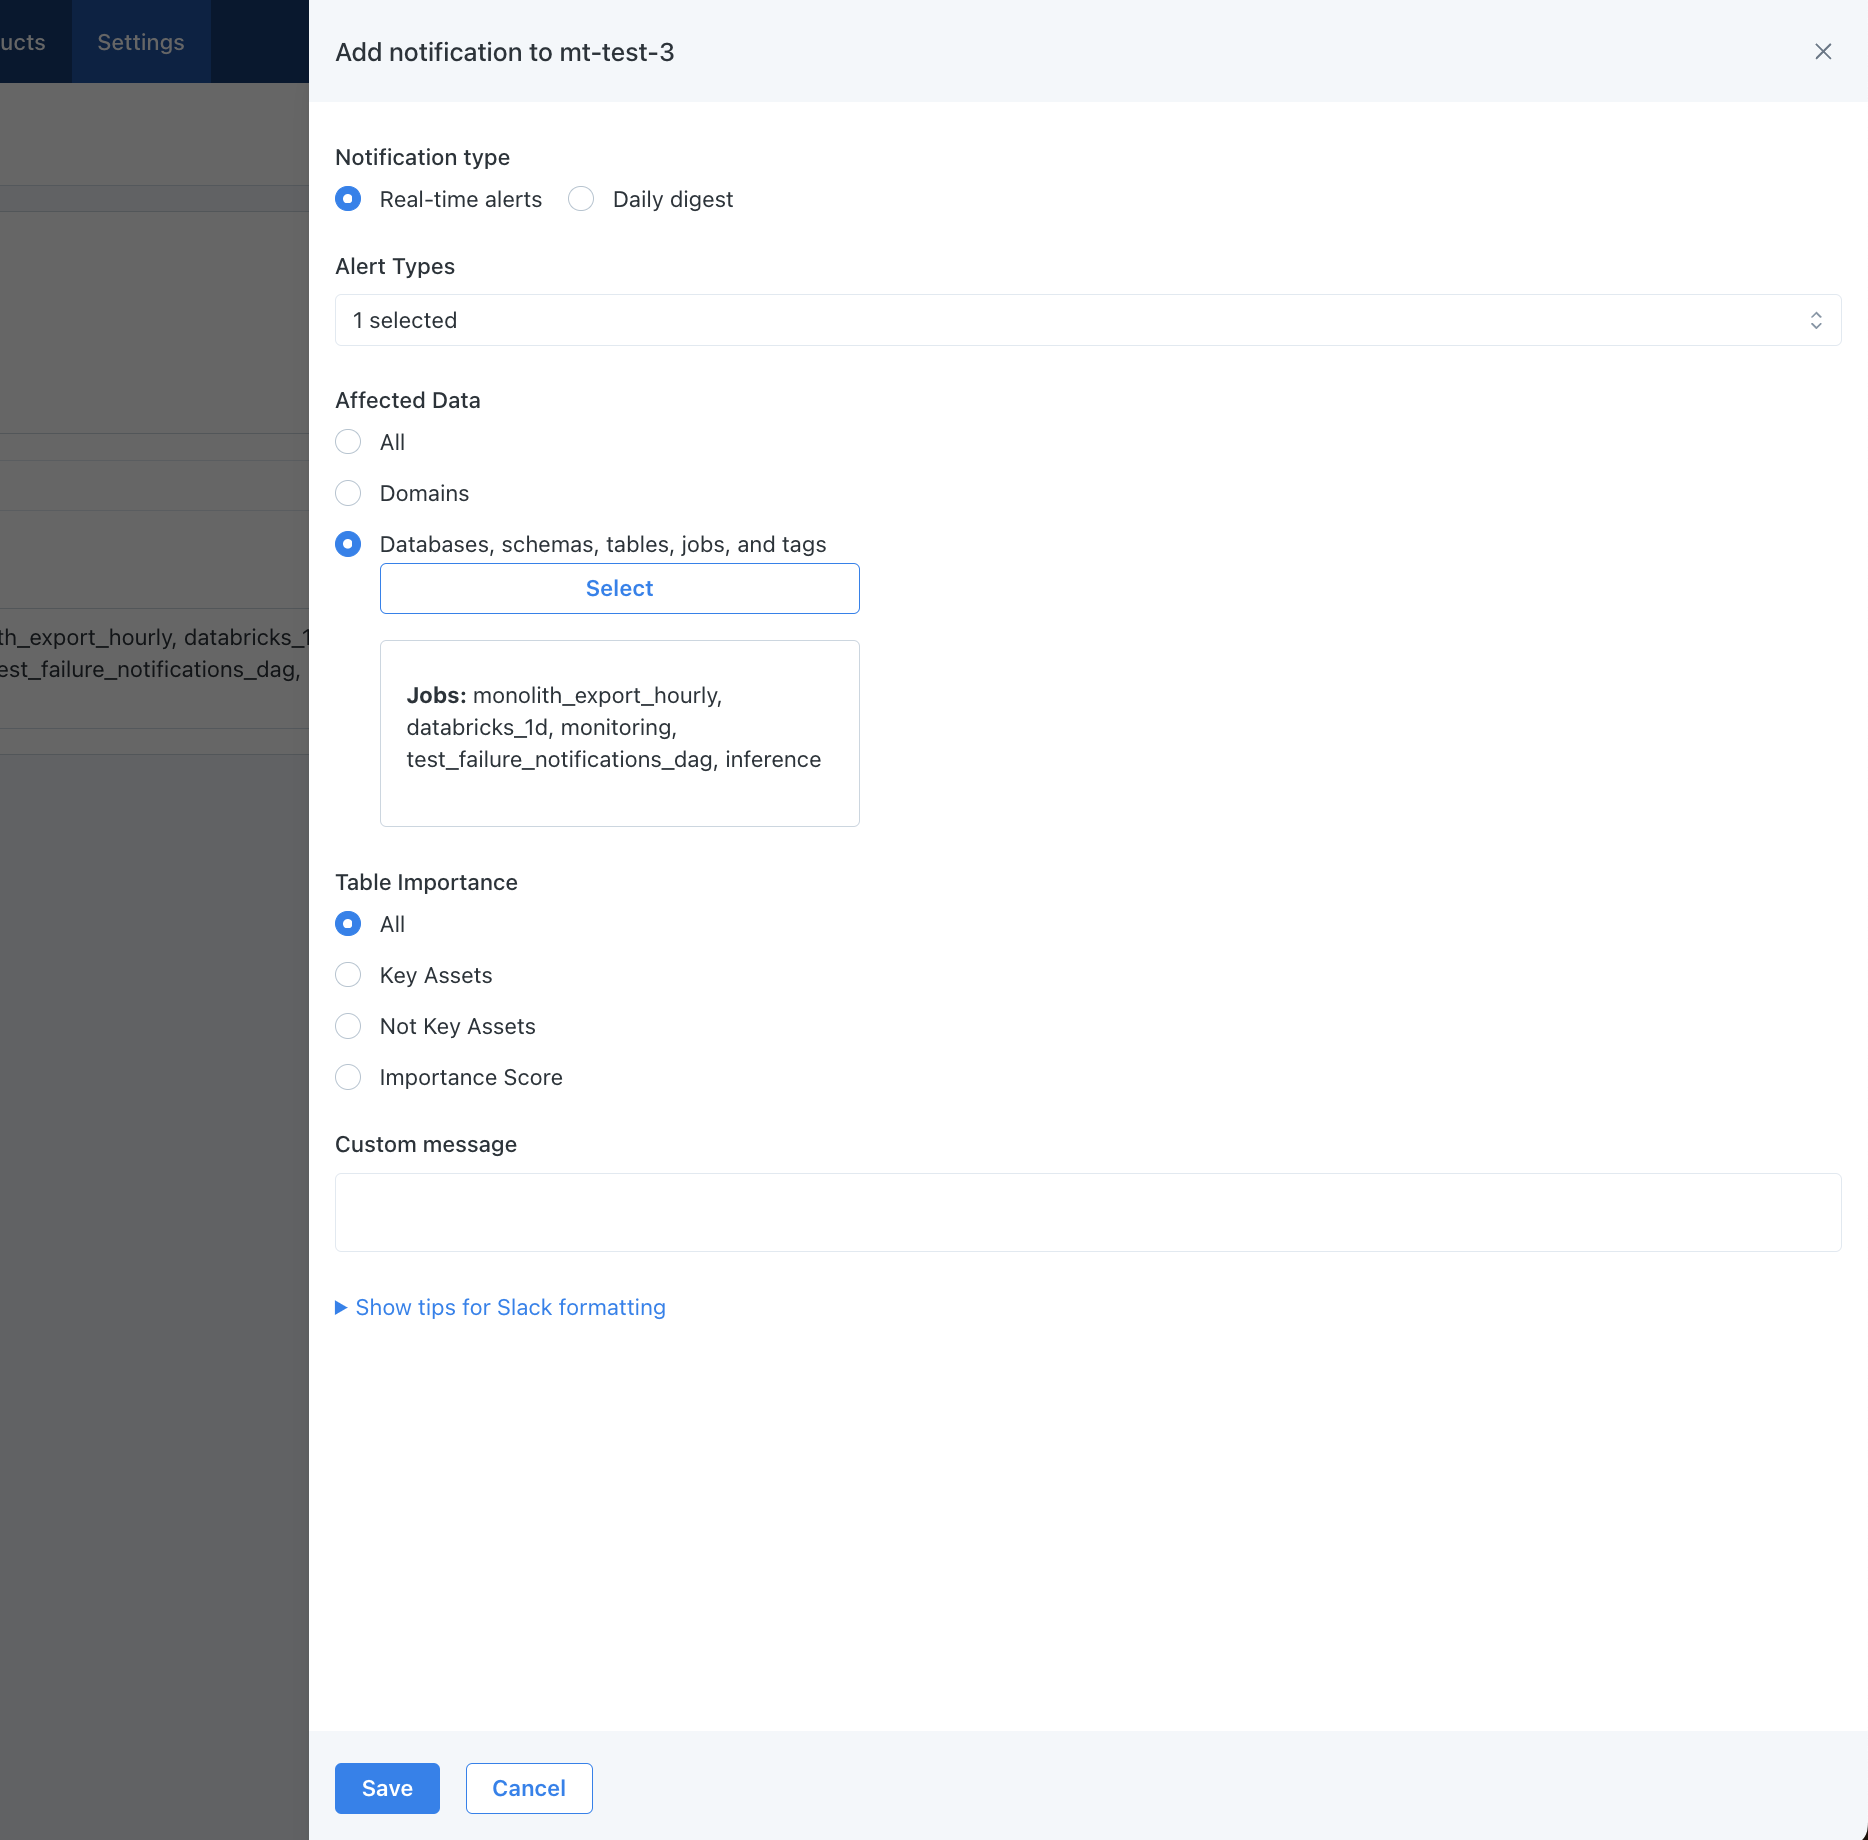
Notifications as Code 2.0 now supports all recipient types. Previously, just Slack, Email, and PagerDuty were supported. Now, the list of available recipient type is at parity with the UI, supporting recipients like Microsoft Teams, Jira, ServiceNow, Webex, Webhooks, and more. To learn more, check out the docs.

You can now give a display name to a recipient in an Audience. That display name will then show up anywhere the recipient is shown in MC, such as the Incident page and within custom monitors.

No more ugly URLs or alphanumeric keys that are meaningless to the average user!

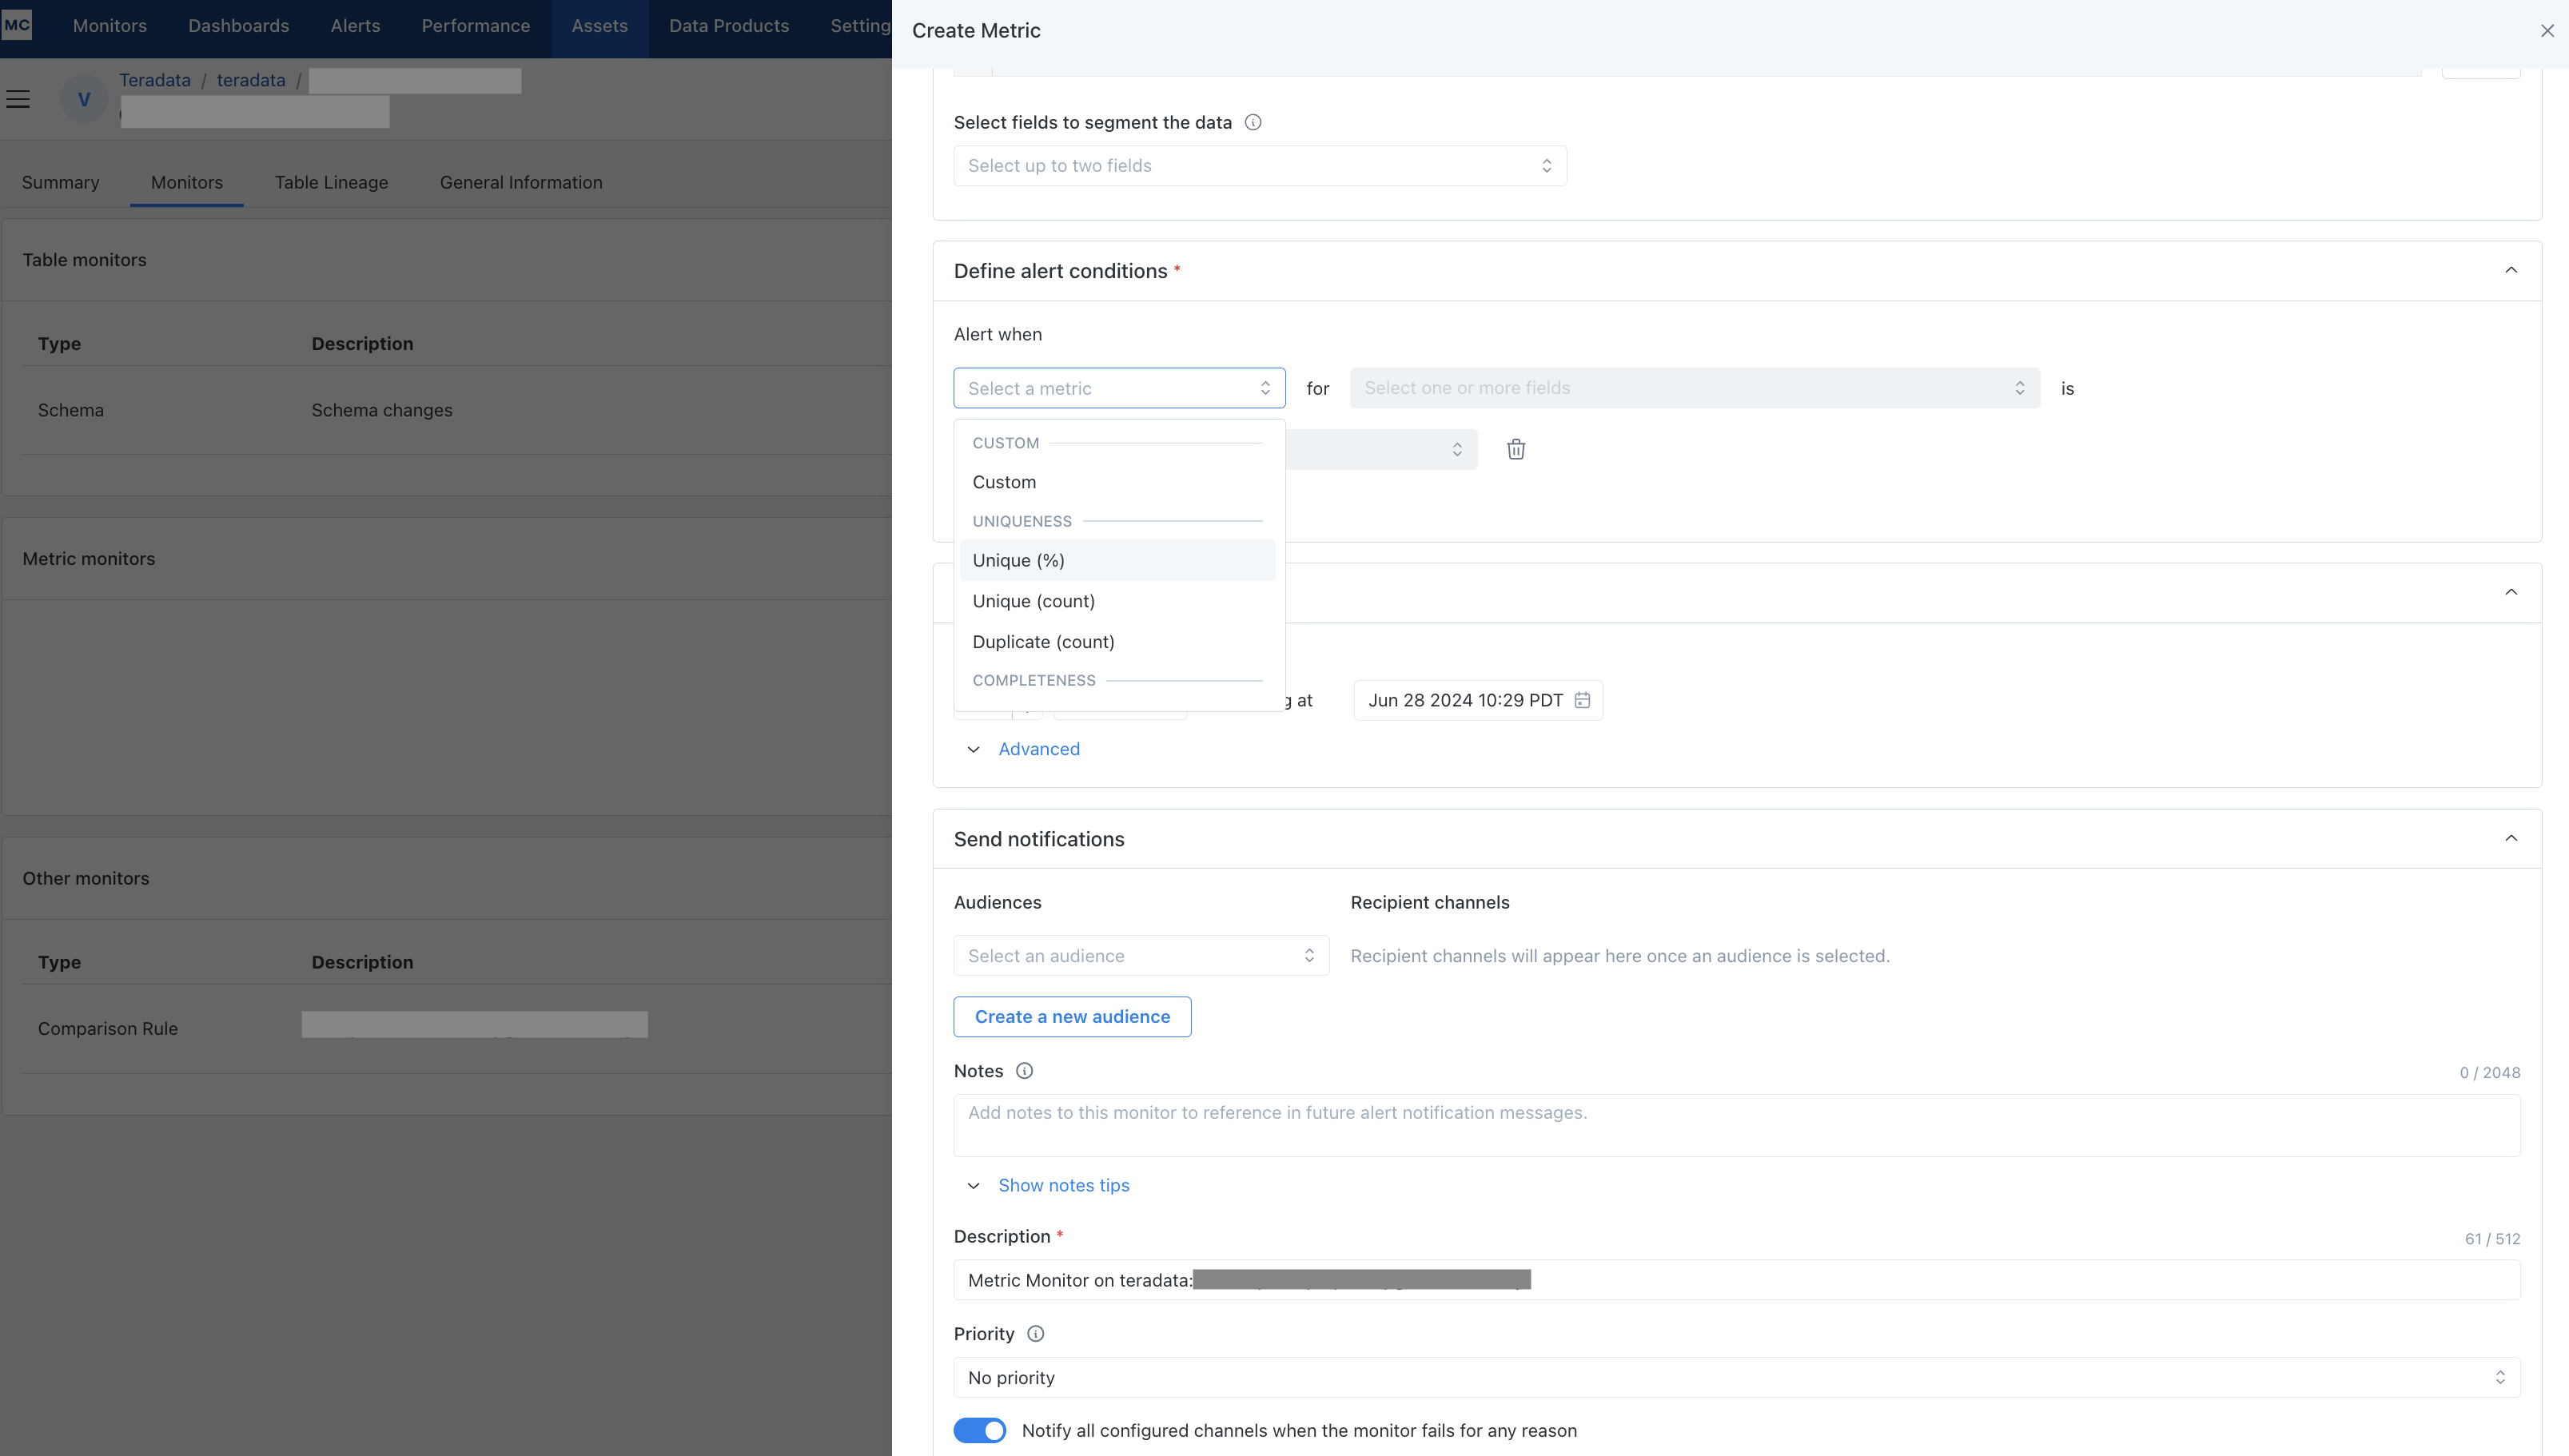
We've added 38 new metrics to Field Metrics Monitors. Check our docs page to see the full list of available metrics. Many of the newly released metrics are supporting manual thresholds only, and automated thresholds for them will be released soon.

In addition, we've introduced some categorization to help organize all the different field metrics:

  • Uniqueness: these check for duplicates in unique keys like UUIDs, and for changes in cardinality
  • Completeness: these check for ways that data can be null or otherwise unpopulated.
  • Distribution: these check for shifts in the numeric profile of data
  • Validity: check that values are honoring expected and usable formats, including common data entry errors.

Some large enterprises have more than one Monte Carlo environment. A subset of their users and admins need to frequently traverse between their multiple accounts. This used to be a cumbersome process to log out and log back in, but has been made much easier.

All the accounts for which an email address is a user are now presented in the top-right dropdown, allowing the user to easily switch between accounts.