We've rebuilt the Metric Monitor to address many key points of customer feedback! Improvements includes:

  • “Seasonal” pattern detection, with special attention to day-over-day and week-over-week patterns.
  • Tighter thresholds that ‘hug’ the trend line
  • ML thresholds available on all metrics
  • Rapidly trained thresholds by backfilling up to 1 year of historical metrics (learn more). Thresholds often appear after the first run of the monitor + backfill is complete
  • Requirement for minimum row count per bucket is removed

Note – to support these changes, the backend and data model needed significant refactoring. So much so that this a hard “v2” of the Metric Monitor. Existing Metric Monitors will continue to function without interruption, but only newly created monitors will get these improvements.

We encourage users to try it out! There are some slight differences in the configuration of a v2 Metric Monitor, compared to before. For example:

  • Users are now asked how many days or hours of recent data should be ignored, since it might not be mature yet for anomaly detection.
  • To support ingest of much more historical data, segmented metric monitors are now limited to a single alert condition, which can contain only 1 metric and 1 field.

Refer to our documentation on the Metric Monitor and available metrics for more details.


An example of the thresholds from a new metric monitor. Note that they 'hug' the trendline much better and incorporate week-over-week patterns in the data.

An example of the thresholds from a new metric monitor. Note that they 'hug' the trendline much better and incorporate week-over-week patterns in the data.

A Databricks Workflows integration is now available, which allows users to identify which Databricks job updated a given table, what are its recent run results, and how workflow runs impact the quality of a table. Very soon it will also alert on workflow failures.
Permissions to job system tables are required to enable the integration. More details here.

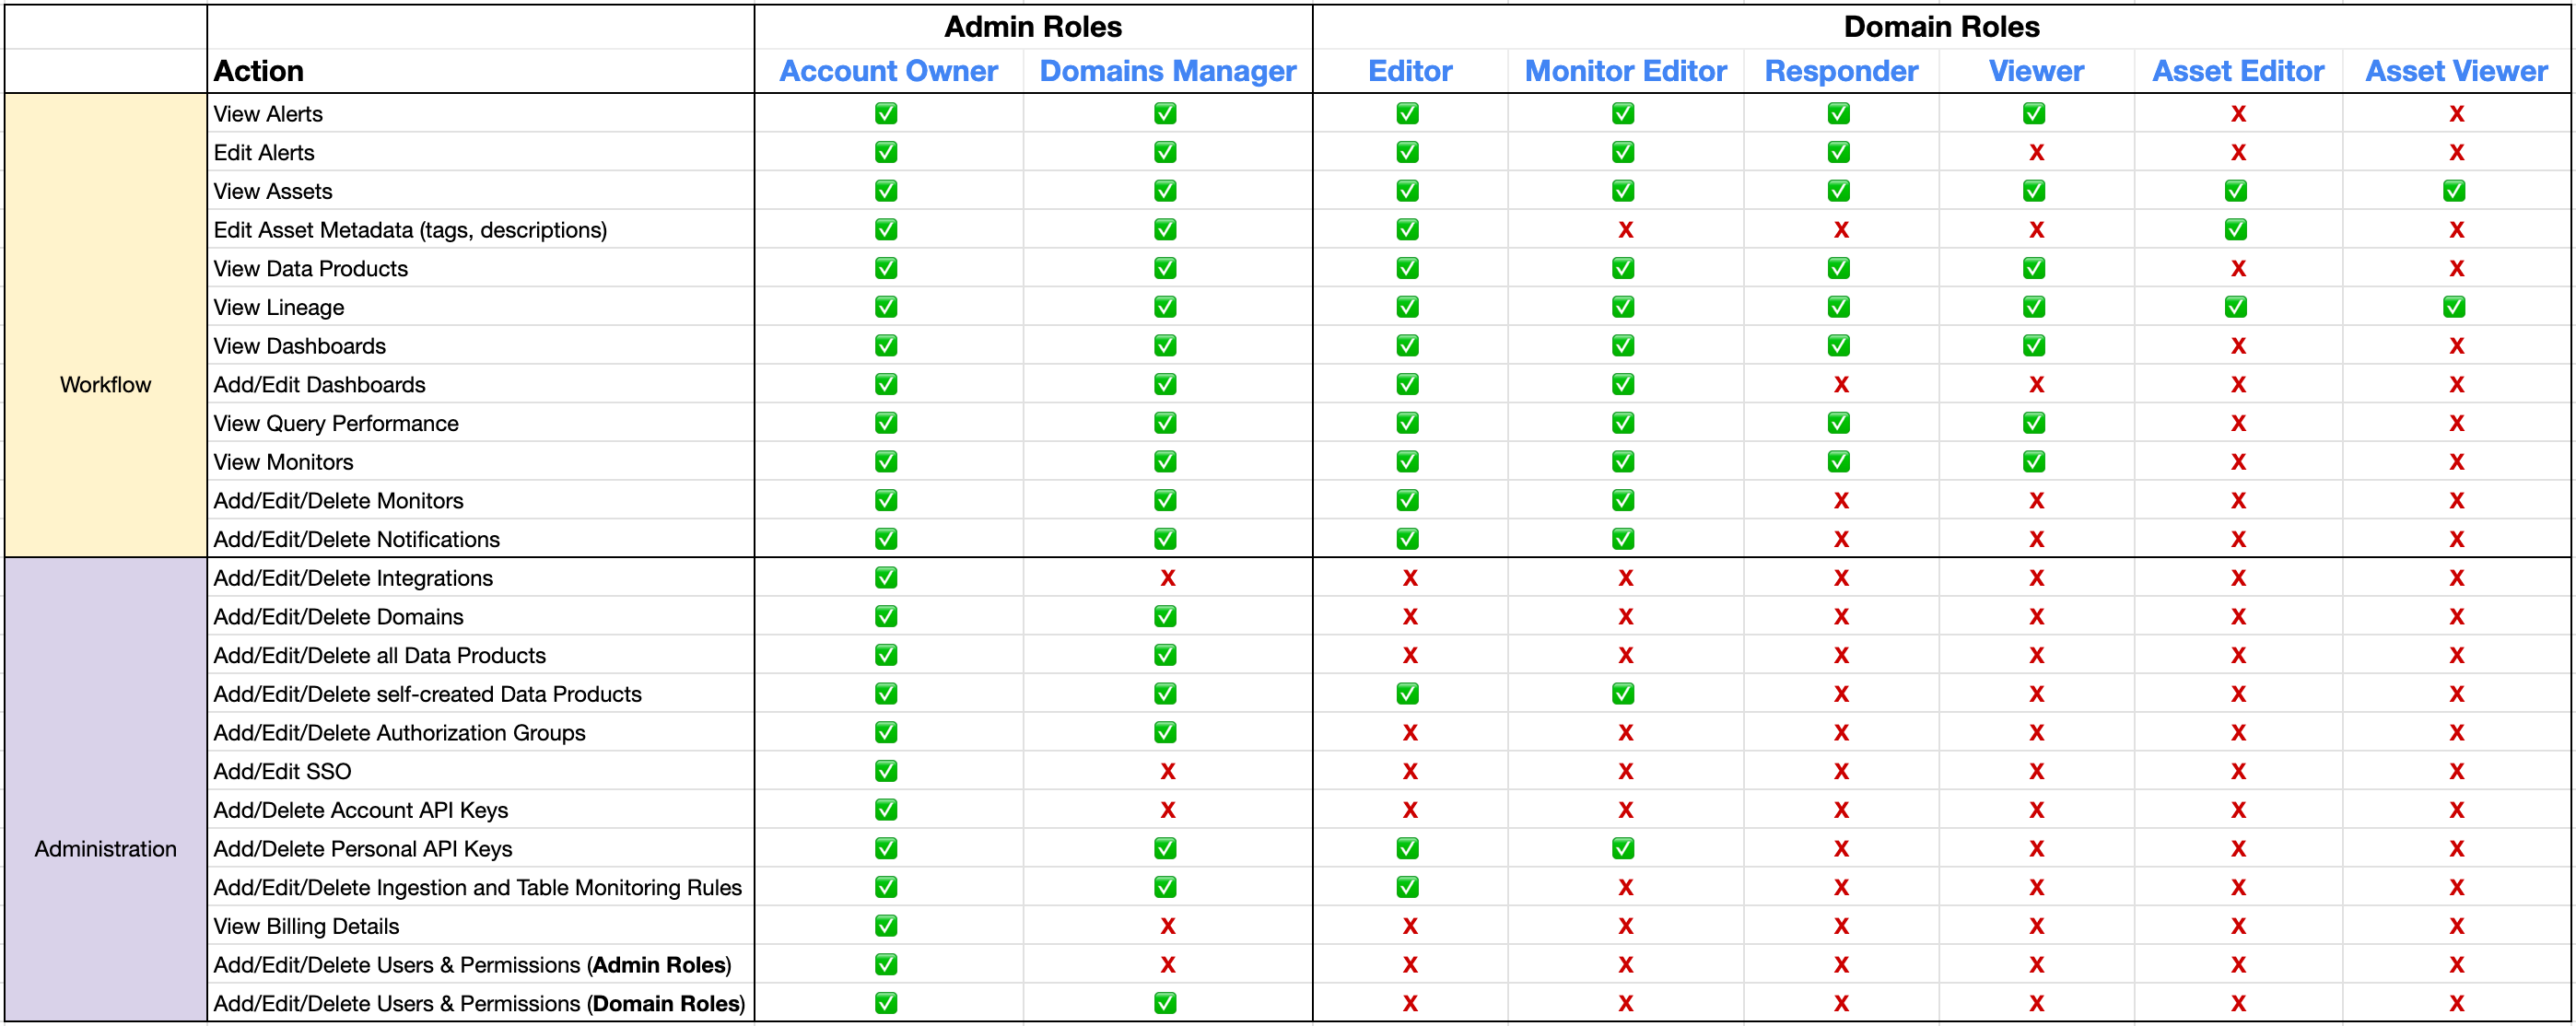
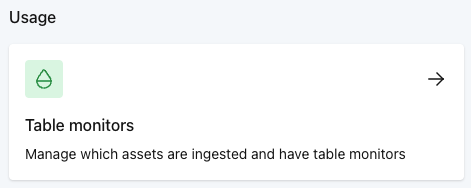
We've made an update to the permissions for access to the Usage UI.

  • Editors will now have access to Add/Edit/Delete Ingestion and Monitoring Rules in the Usage UI.
  • Account Owners and Domain Managers will retain permissions to Add/Edit/Delete Ingestion and Monitoring Rules in the Usage UI

This change aims to streamline permissions and ensure that Editors have access to make changes to what is ingested and monitored by Monte Carlo.

For more on Managed Roles and Permissions, refer to https://docs.getmontecarlo.com/docs/authorization#managed-roles-and-groups

Learn more about the Usage UI here: https://docs.getmontecarlo.com/docs/usage#access

A beta version of Azure Data Factory integration is now available. The initial version generates cross-database lineage, lets users check which ADF pipeline updated which table, and shows run details for each pipeline, to accelerate data incident resolution. In a few weeks, we will also let users centrally manage ADF pipeline failures in MC.

More details on the integration, such as setup instructions, in docs here: https://docs.getmontecarlo.com/docs/azure-data-factory

When investigating data alerts, understanding the potential impact of changes in data, system, and code is critical. The new pull request correlation feature simplifies the code investigation process by allowing you to quickly correlate any pull request from your git repositories with Monte Carlo alerts.

Pull requests that have been merged into your Git repositories are visually overlaid on alert charts. This enables you to easily determine timing on whether a specific pull request may have influenced the change you are investigating.

You can further investigate by navigating to the pull requests tab, where you can filter and search through pull requests based on repository, author, PR title, or even file names. This helps you pinpoint whether a particular pull request drove the alert you are investigating. If you need more detail, you can click directly on the GitHub link to examine the code changes.

In beta, this expanded support for pull requests is only available on freshness and volume alerts. Learn more with the GitHub docs for setup and pull requests (beta) for more information on using this functionality.

We’re rolling out an important update today to help you better manage and report on incidents. Now, when marking incidents, you’ll have the option to either create a new incident or merge alerts into an existing one. This change is designed to improve your workflow and ensure more accurate incident tracking on the data operations dashboard.

Sometimes, alerts from different monitors point to the same root cause. By merging related alerts into a single incident, you can group them together for clearer insights and more precise reporting over time. This complements the existing capability of splitting alerts.

Additionally, you can now mark alerts as incidents directly from the alert feed. Learn more about marking alerts as incidents.

The data quality dashboard provides a way to view the health of a set of monitors. In tandem with the the recent release of Monitor tags, you can now granularly measure data quality for a set of Monte Carlo validation, comparison, custom sql monitors. Use the data quality dashboard to report on:

  • SLAs : report on the current state and trend of specific monitors, rather than all monitors.
  • Critical data elements: report on a set of validations or metric monitors for a critical data element, applying tags like cde:total_revenue.
  • Data contracts: tag monitors with a specific tag per data contract or simply data-contract.

Learn more on the Data quality dashboard documentation.

In metric monitors, the relative row count metric will alert to sudden shifts in the distribution of values in categorical fields. It tracks the percentage of rows in a given segment compared to the overall number of rows, and alerts when the percentage for a segment suddenly spikes higher or drops lower. Learn more.

Some common examples where this is valuable:

  • An events table has an app_version field. The user would like to be alerted if any app_version is suddenly receiving a disproportionately high or low number of rows relative to overall volume, as it may indicate issues with that version.
  • An orders table has a country field. The user would like to be alerted if any country is suddenly receiving a disproportionately high or low number of rows relative to overall volume, as it may indicate an issue with processing order from that country.

Historically, this use case was addressed with dimension tracking. Existing dimension tracking monitors will continue to function, but to streamline the user experience, the creation of new dimension tracking monitors through the UI will be blocked. Fewer distinct monitor types makes it easier for new users to learn the platform and to maintain feature parity.

Several longstanding requests for dimension tracking are now resolved by including this in the metric monitor:

  • Visible thresholds
  • Sensitivity options
  • Showing more than 10 segments at once
  • Joins when choosing data the monitor
  • Supporting higher cardinality fields

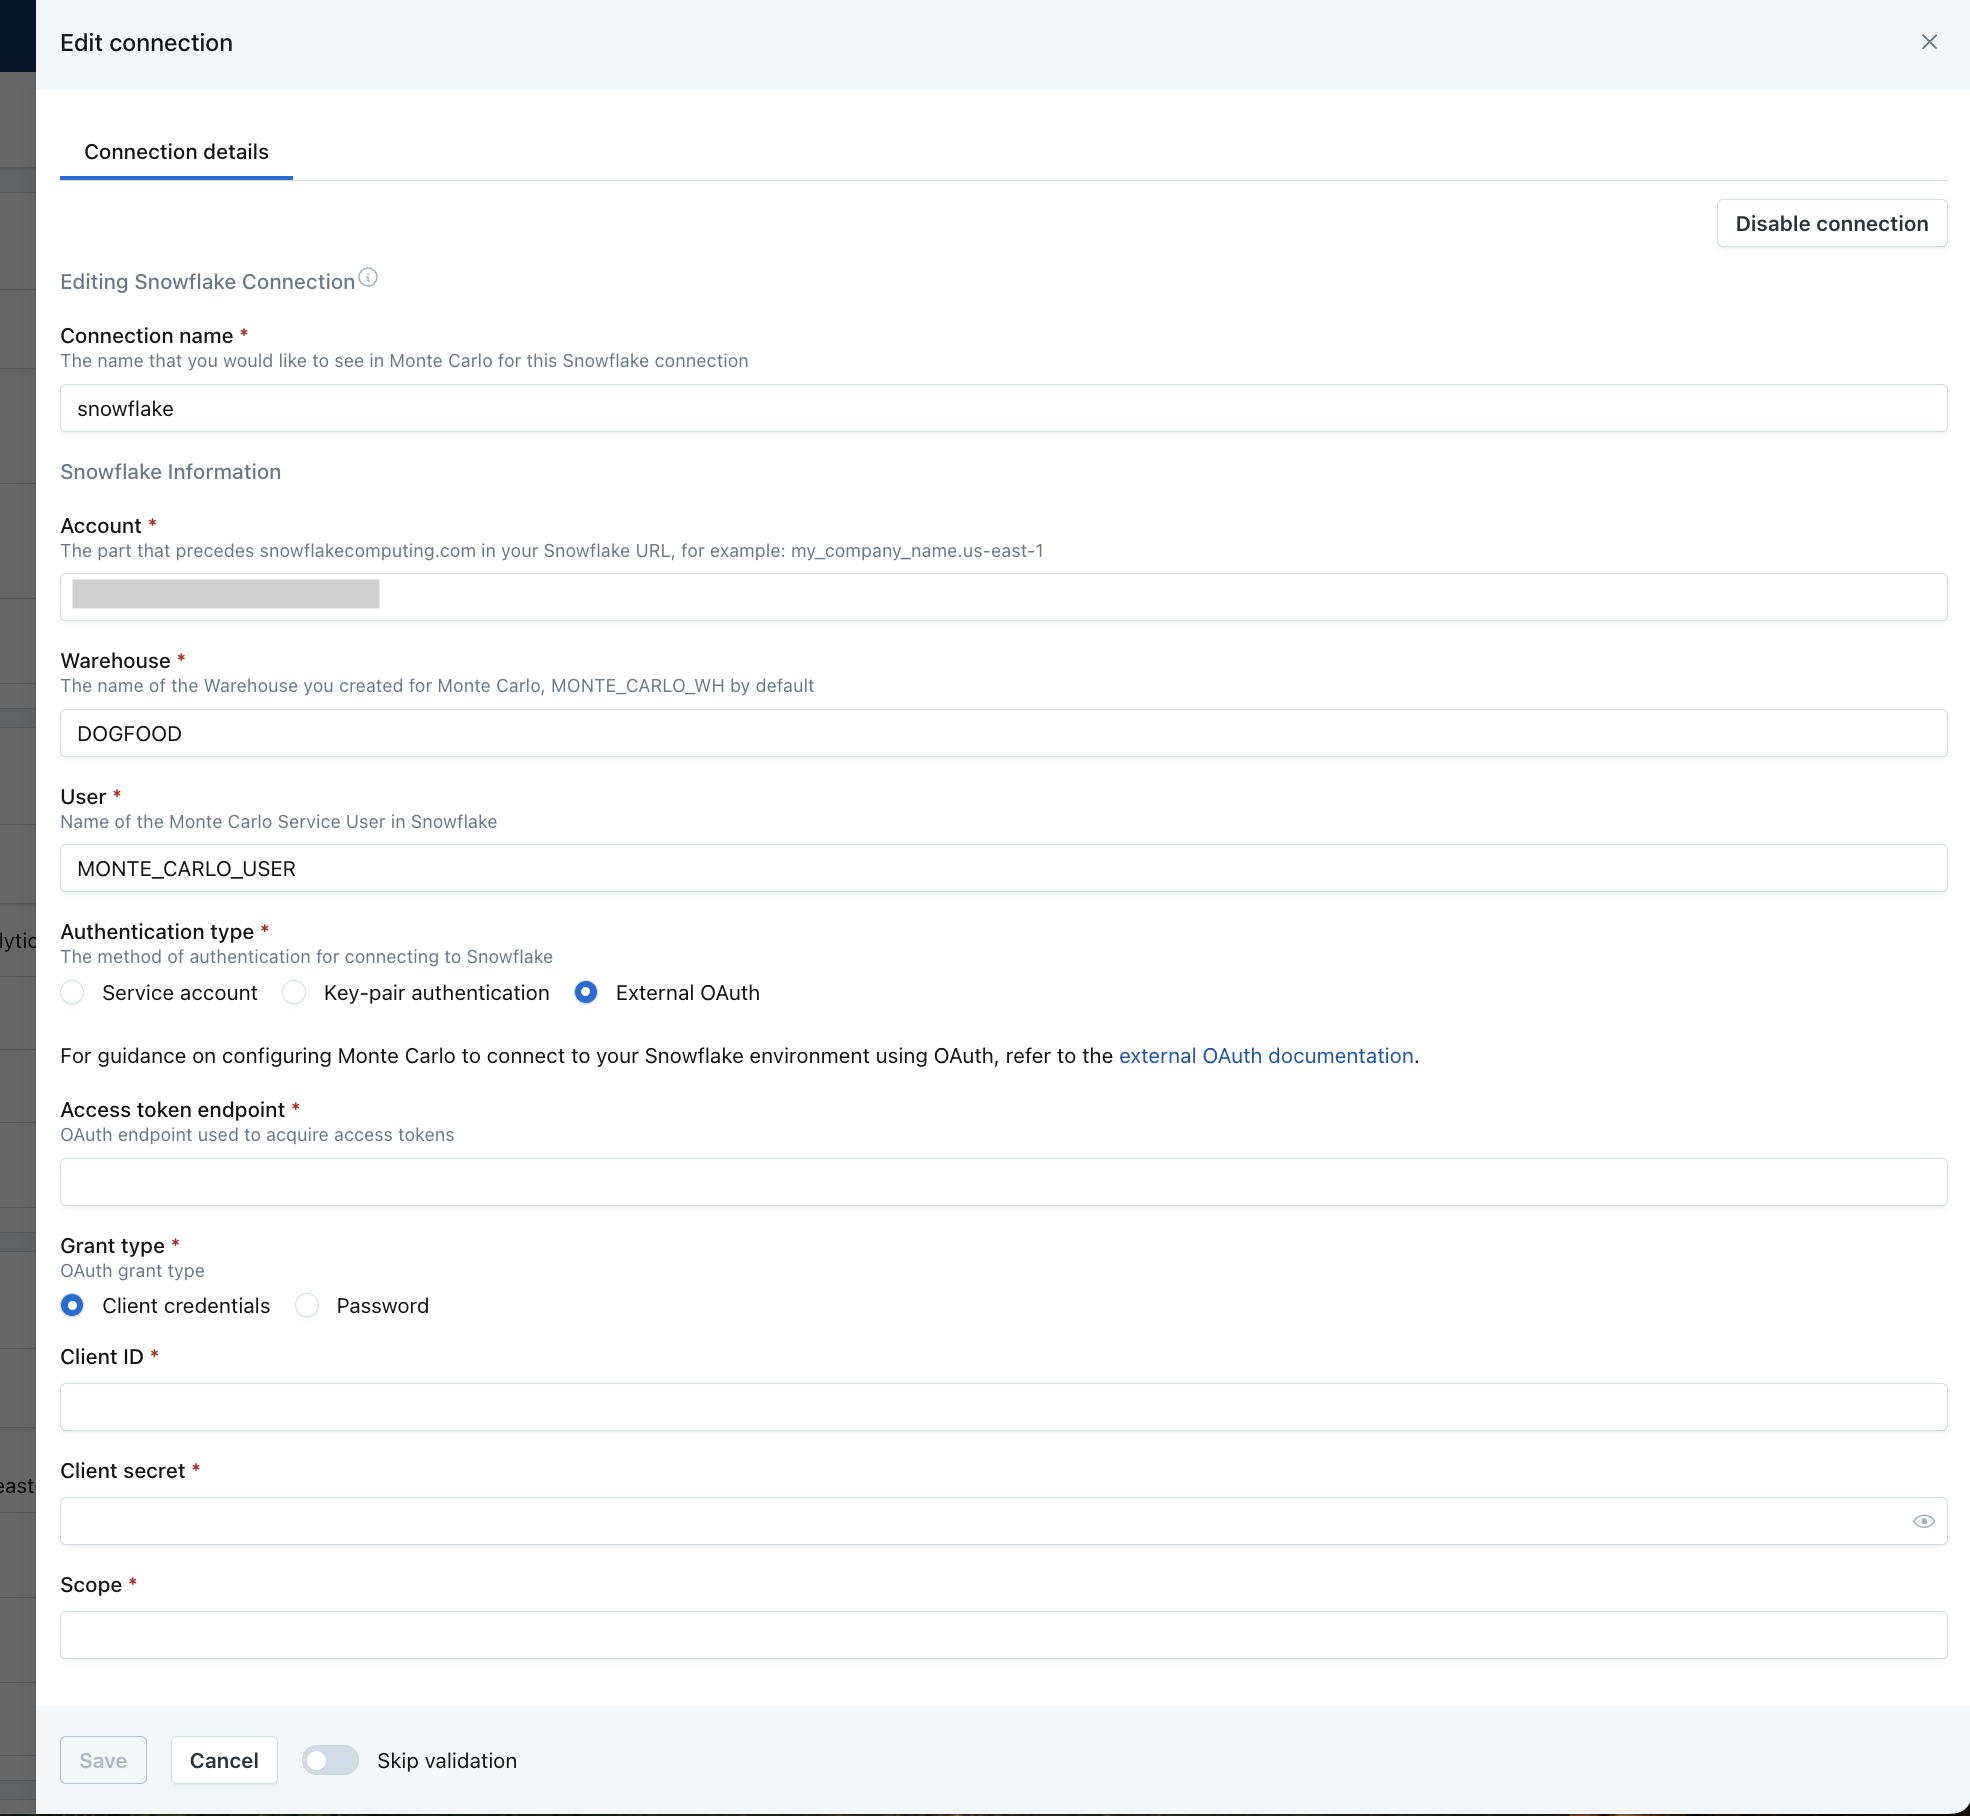
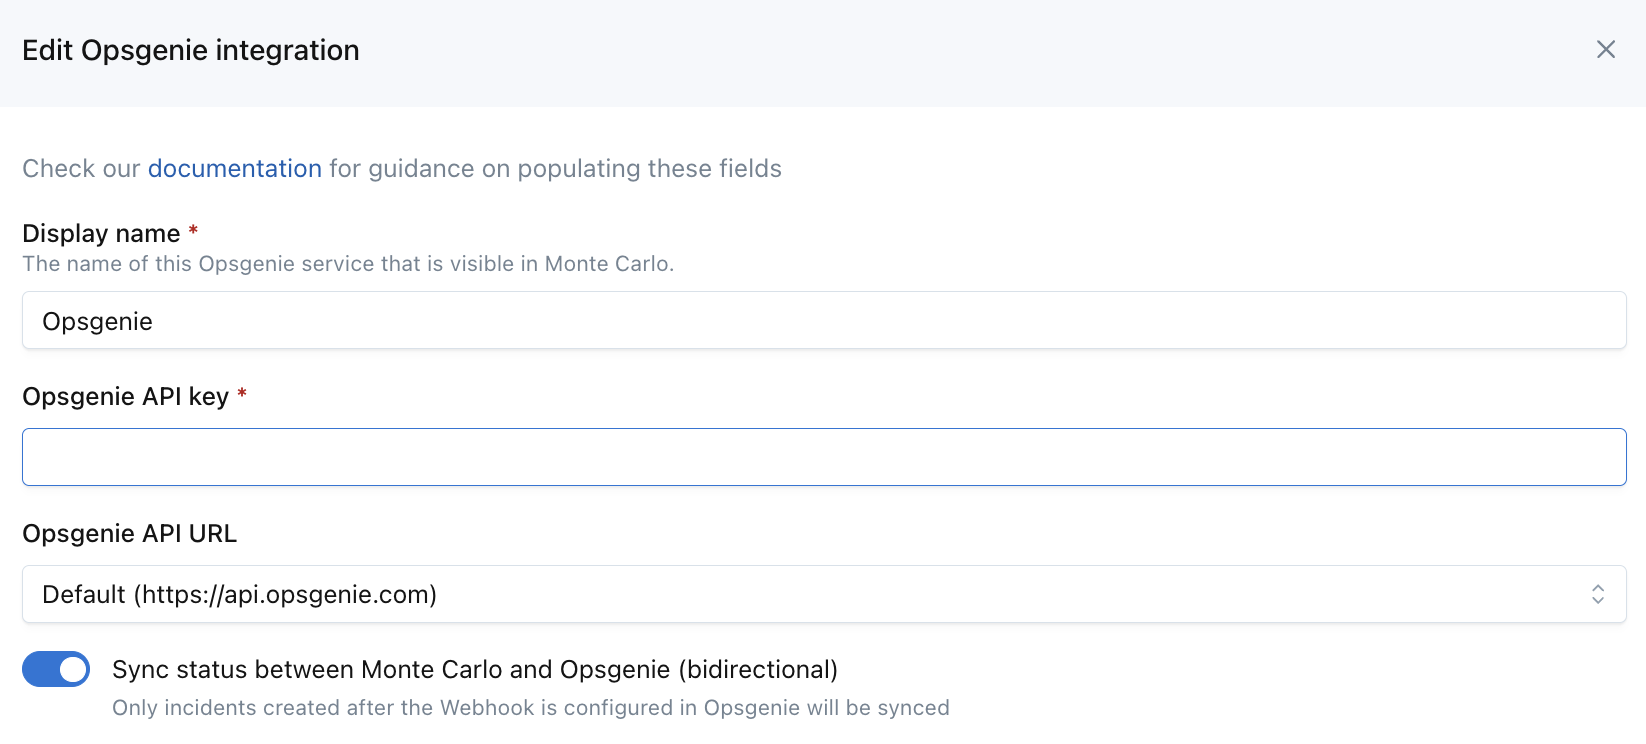
Monte Carlo now supports routing alerts and incidents to incident.io. Incident.io is an incident management platform that helps customers declare, collaborate, communicate around and learn from events that disturb their normal course of business - from critical infrastructure being down, to data breaches and security incidents.

Get started in the Incident.io documentation.