The settings view now has a new look! The previous tabular layout is replaced with tiles, making the UI more intuitive and easier to navigate. No functionality changes.
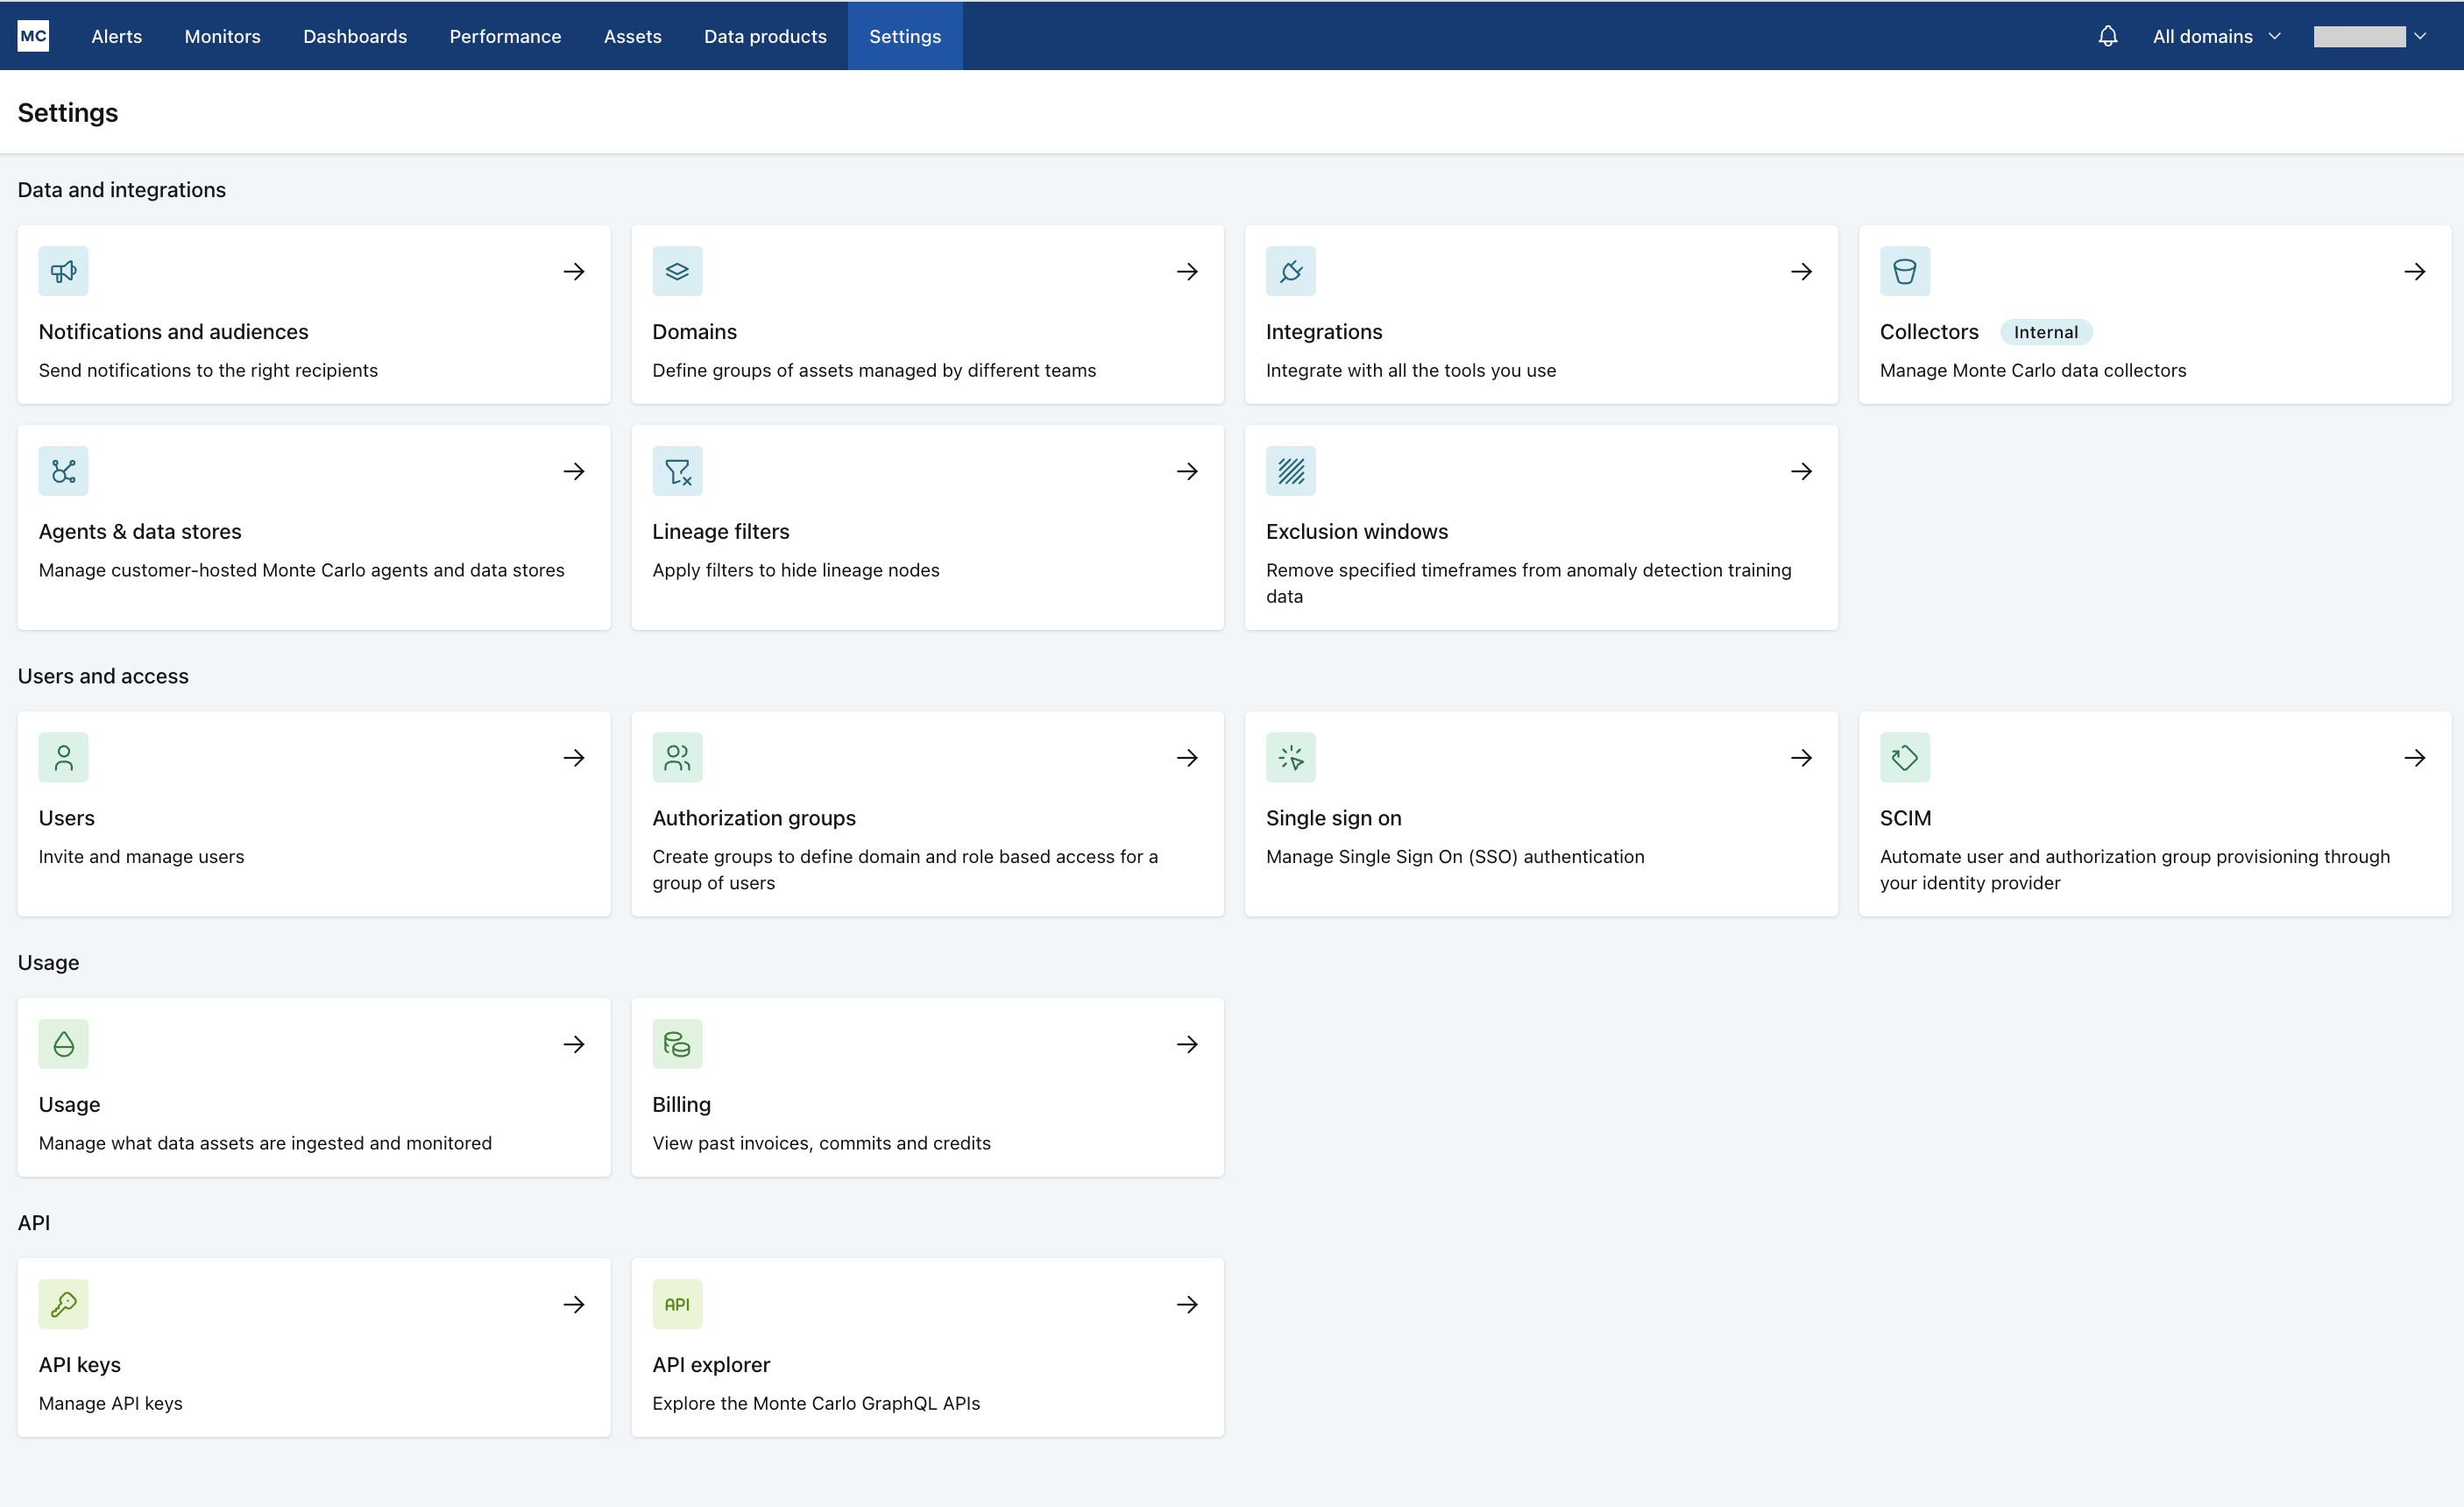
The settings view now has a new look! The previous tabular layout is replaced with tiles, making the UI more intuitive and easier to navigate. No functionality changes.

Following up on our recent improvements to Volume alerts, we've released a similar set of improvements for managing Freshness alerts (time since last update & time since last row count change). Same as the Volume release, we’re rolling this out gradually over the next few weeks. It is currently available to just a subset of customers.
Specific improvements:
With this change, all anomaly detection in Table monitors (Freshness & Volume) now behaves the same way. Anomalies are excluded anomalies by default from the data set that trains thresholds. And users can then choose to add them back in if they’d like to widen the threshold.
Read more about interacting with our anomaly detection.

Anomalies are now excluded from the set of training data by default, so that thresholds don't widen.
If the user does not want to be alerted to similar anomalies in the future, they can "Mark as normal" to re-introduce the anomaly to the set of training data.
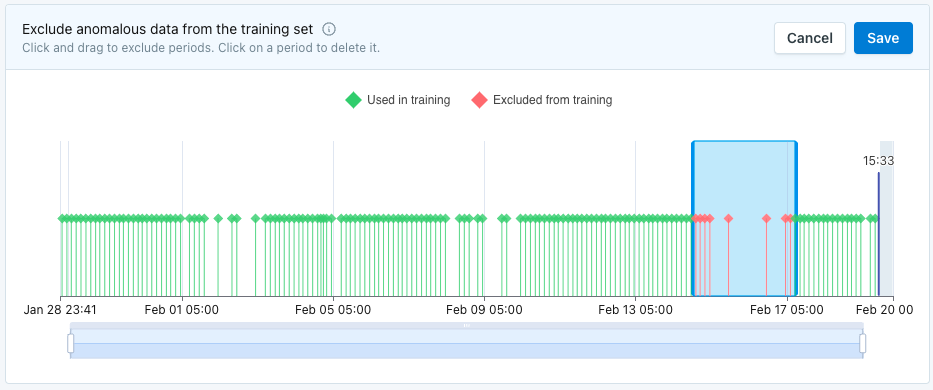
Easily exclude periods of undesirable behavior from the set of training data.
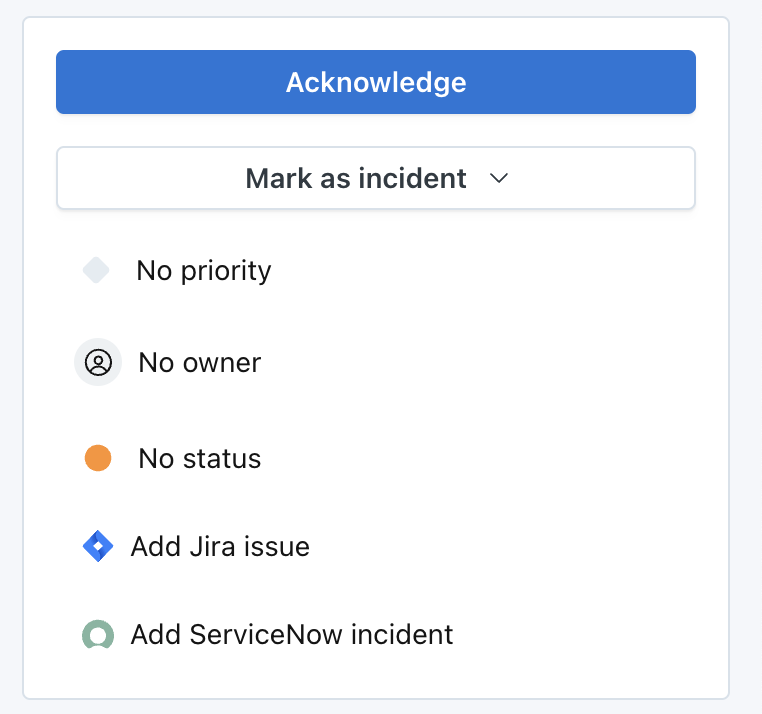
In addition to the existing workflow of sending alerts to ServiceNow via audiences, users can now minimize alert noise within their ServiceNow environments by manually reviewing alerts before forwarding them or linking alerts to existing ServiceNow incidents.
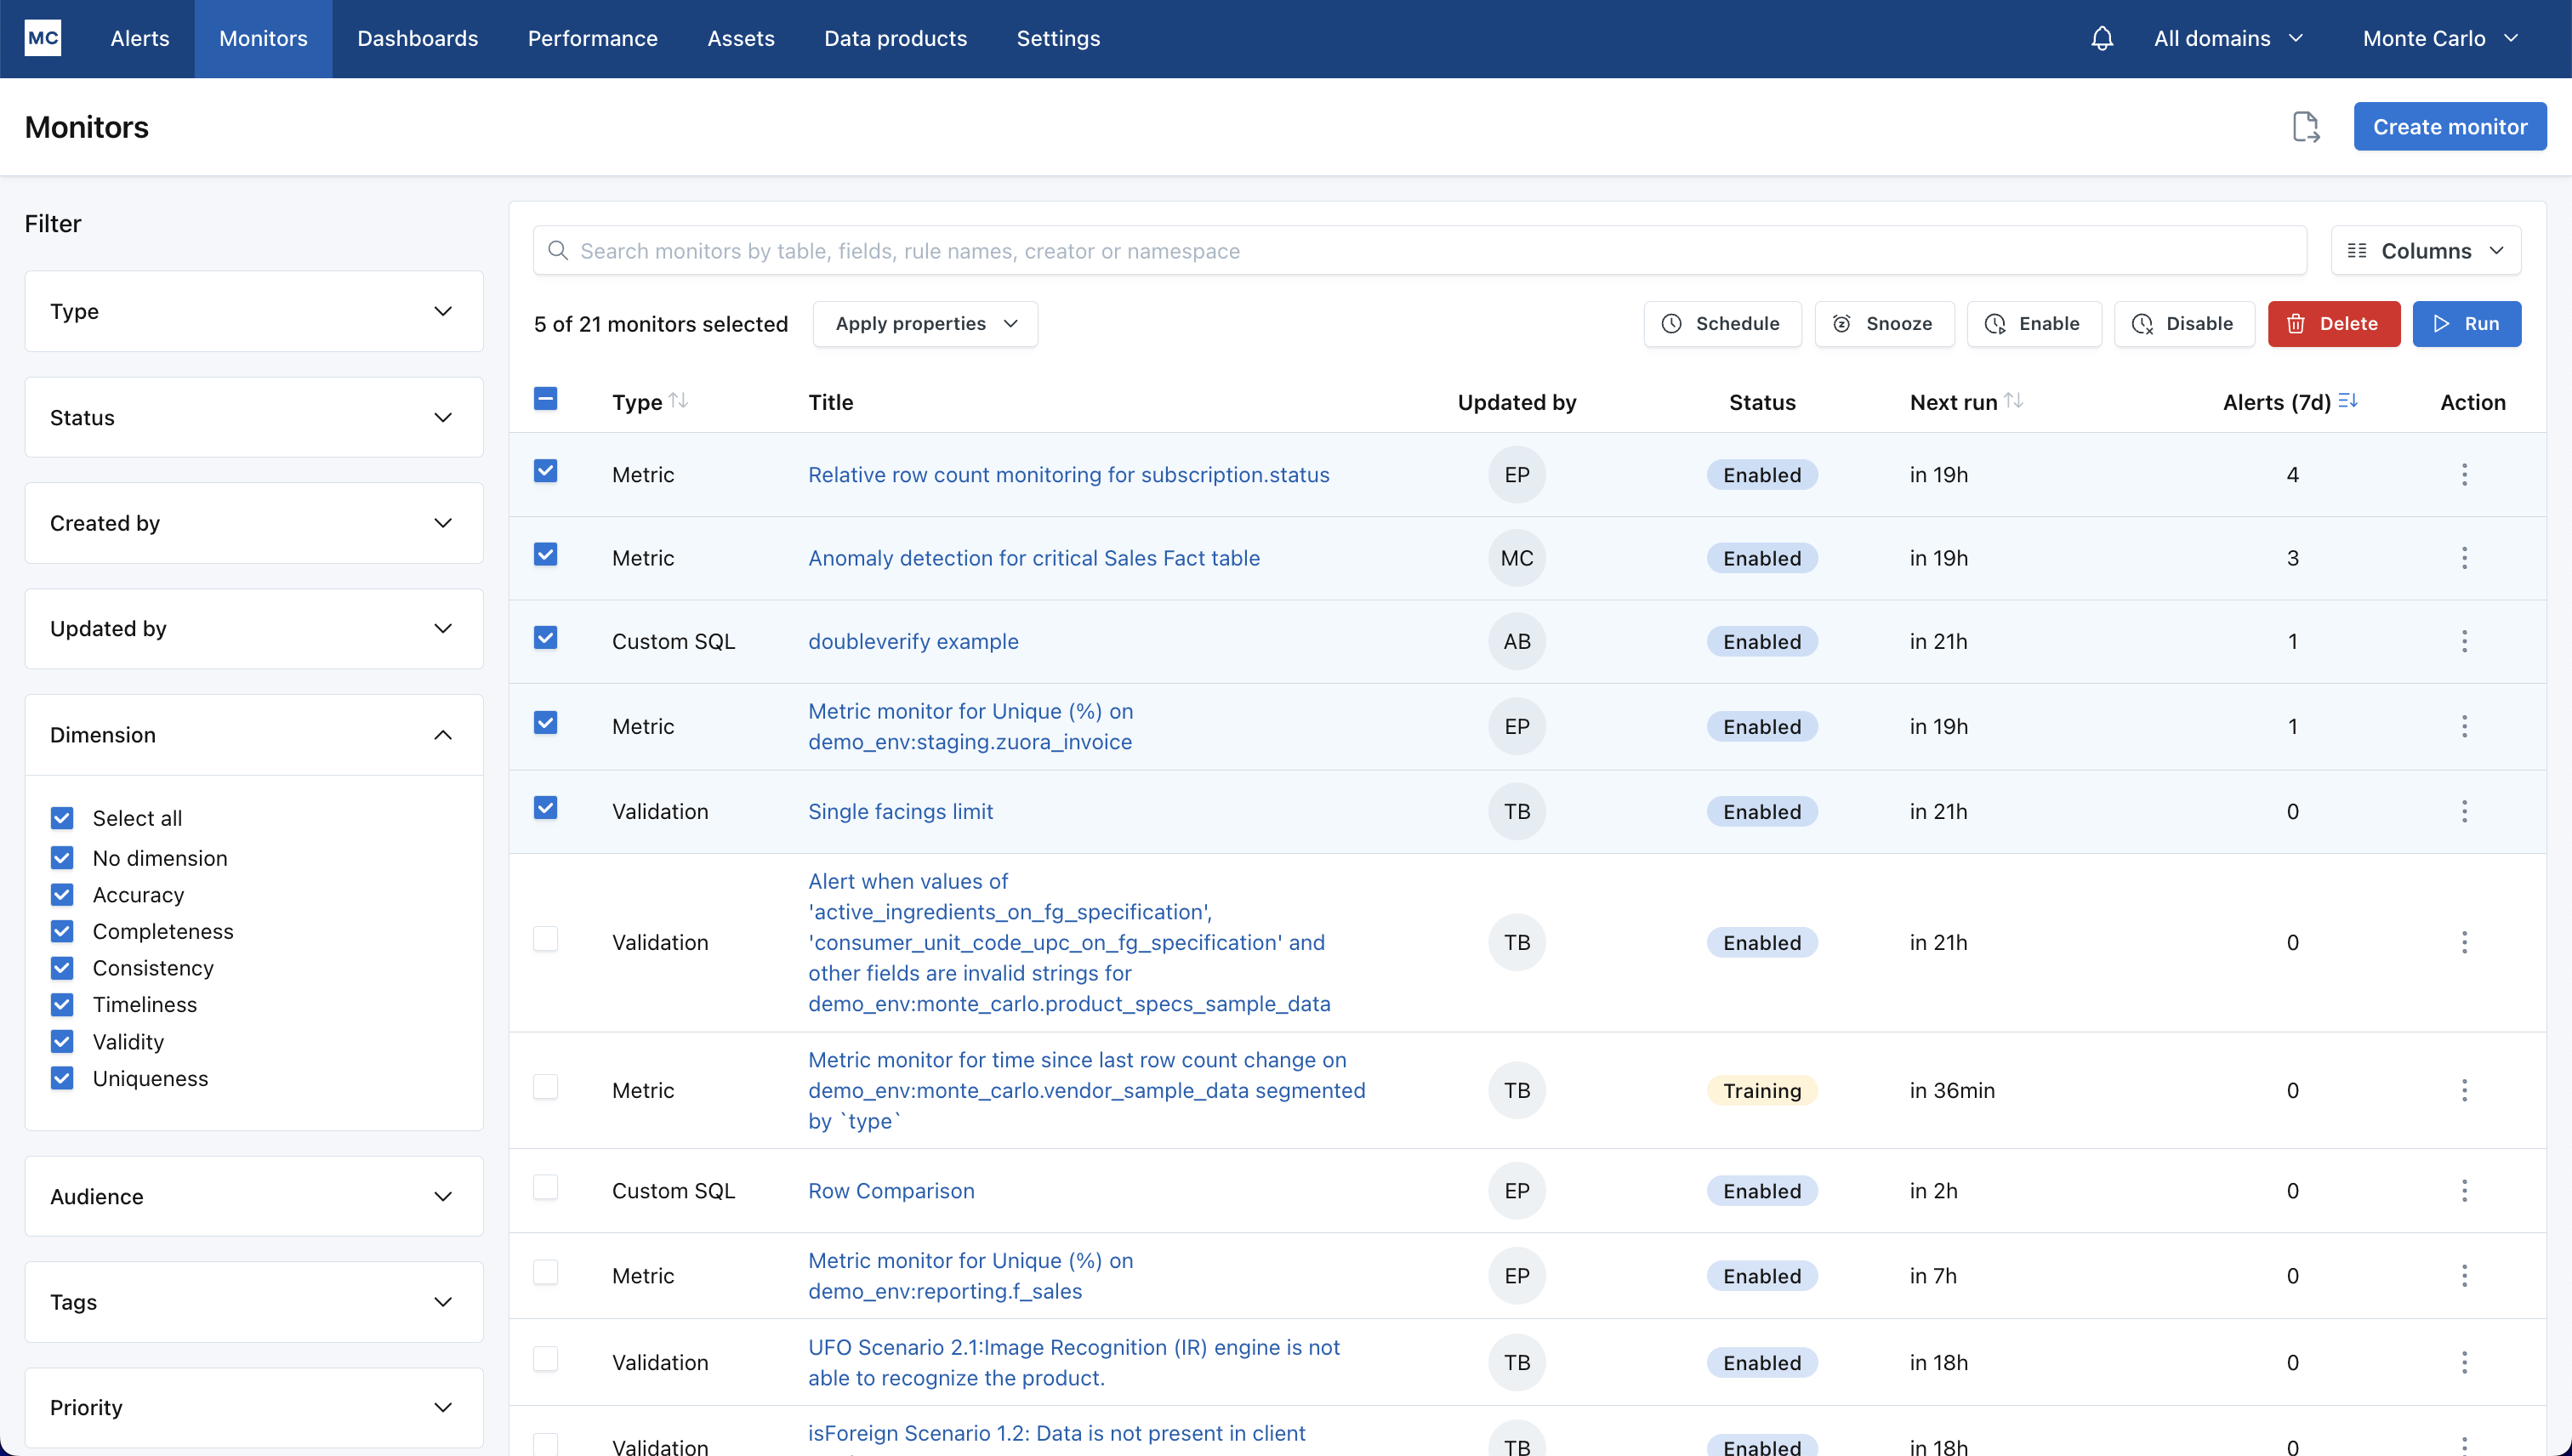
We've redesigned the monitor list and added new bulk actions, filtering, and sorting capabilities to simplify a variety of monitor management workflows such as:
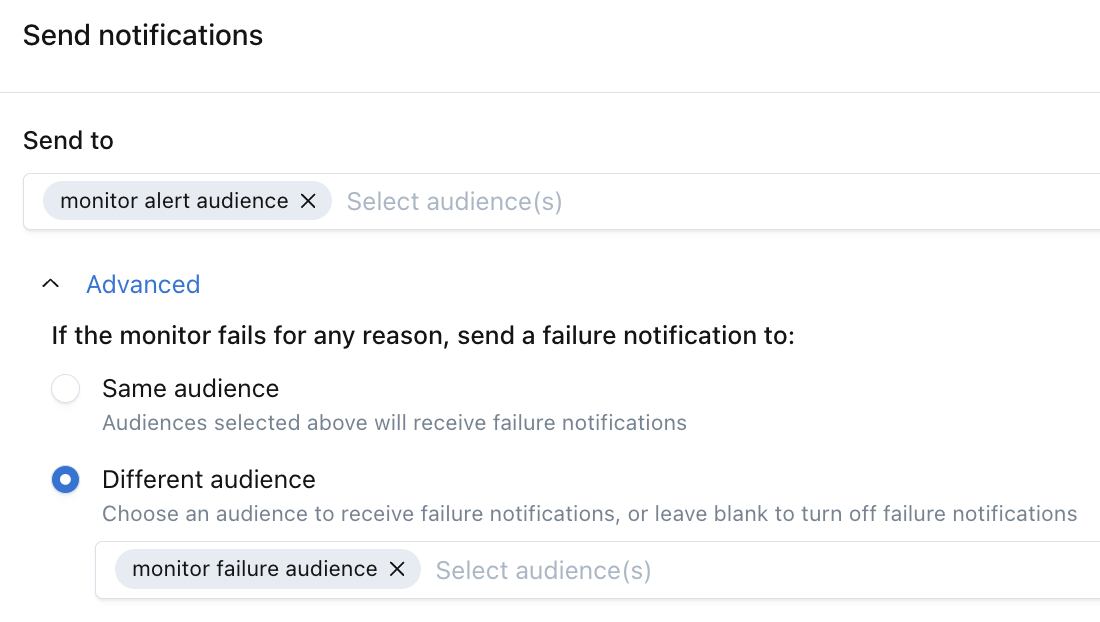
You can now configure monitor alert notifications and monitor failure notifications with different audiences in order to route issues to the appropriate stakeholders while minimizing noise and alert fatigue.
Last year, we released a big set of improvements to the Metric monitor that improved anomaly detection and the user experience on the Alert page. As part of this, we released a new metric property in Monitors as Code and the API.
Users have still been able to create monitors under the old “field_health” property, though its use to create new monitors has dwindled.
As of March 1, 2025:
field_health property. Existing monitors using that property will continue to function without interruption and will still be editable. When creating new Metric monitors, users should use the metric property instead. The differences between the field_health and metric properties are modest, and a guide for how to navigate the two is here.We're simplifying how users provide feedback to our anomaly detection models.
Up until recently, users had the option to "Share feedback" on any Alert in Monte Carlo. If the user marked the anomaly as "Helpful" in that workflow, then Monte Carlo would remove that anomaly from the set of data that was used to train thresholds. This would then restore thresholds to pre-anomaly levels.
This workflow has been deprecated and removed. Rationale:
Read more about how to interact with our anomaly detection here.
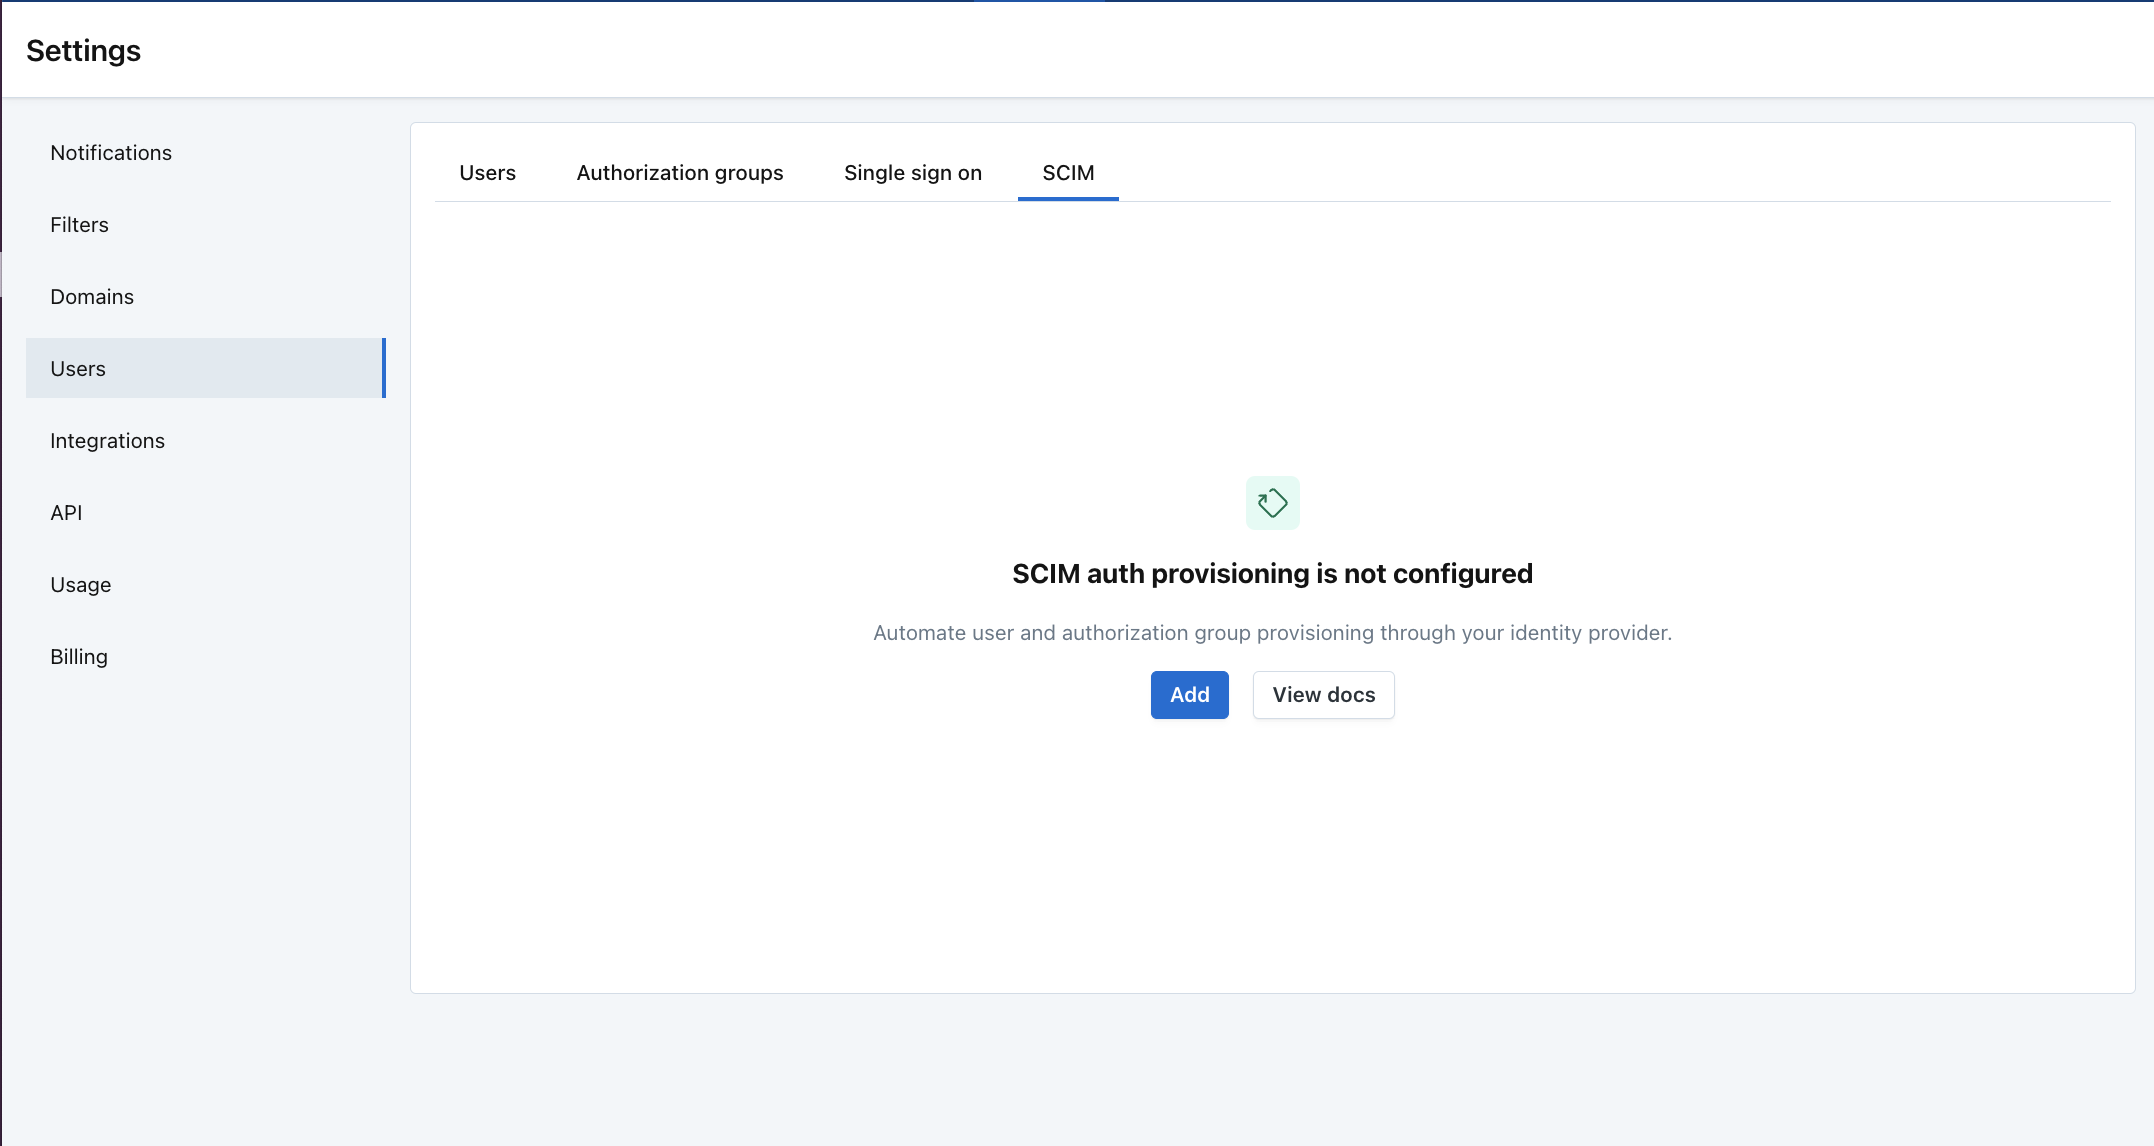
Users can now automatically provision and deprovision Monte Carlo users and authorization groups via their identity providers. Currently supporting Okta and Microsoft Entra ID.
Docs: https://docs.getmontecarlo.com/docs/auth-provisioning-with-scim
The volume monitor has been rebuilt to address a broad set of customer feedback from the past year. This will be a phased release to customers over the next few weeks, and it is currently available to just a subset of customers. These improvements apply just to Volume, but we intend to expand them to all monitors over the coming months.
Key improvements:
Read more about these improvements.
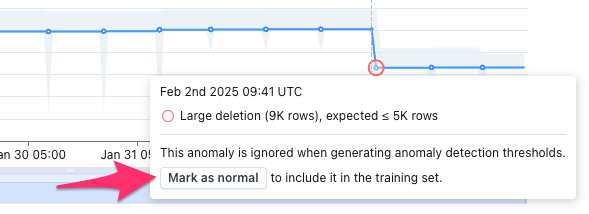
Anomalies are now excluded from the set of training data by default, so that thresholds don't widen.
If the user does not want to be alerted to similar anomalies in the future, they can "Mark as normal" to re-introduce the anomaly to the set of training data.
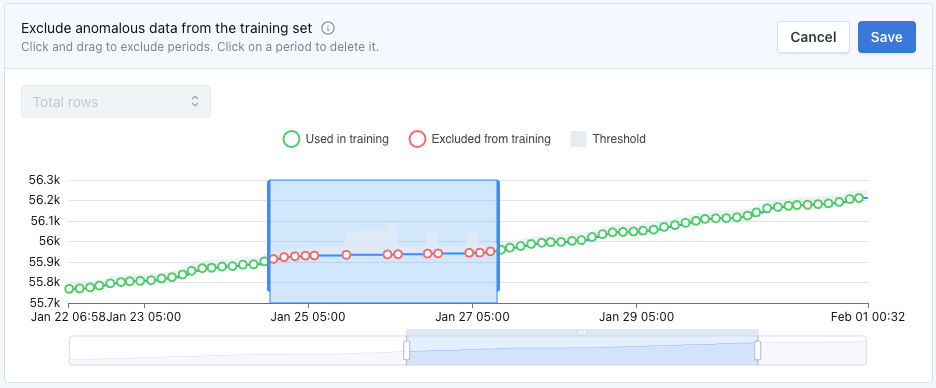
Easily exclude periods of undesirable behavior from the set of training data.
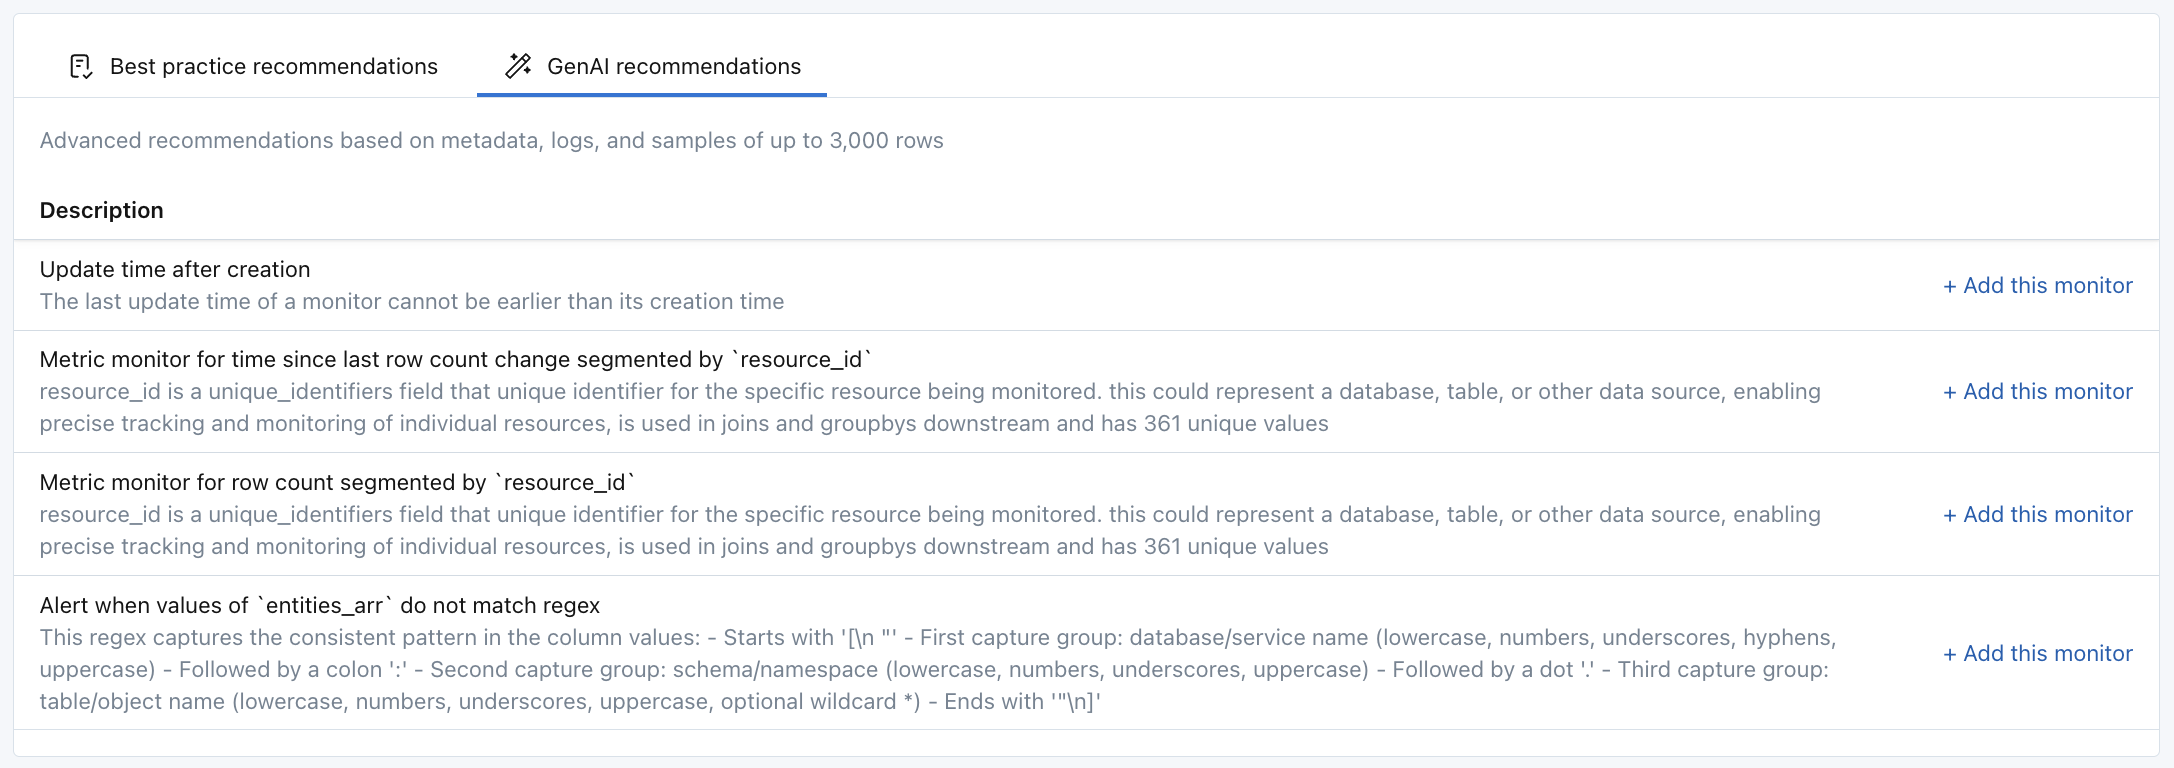
We built Data Profiler to help technical and non-technical users quickly deploy effective data quality monitoring on important assets. We're now introducing recommendations powered by large language models (LLMs) that analyze data samples, table metadata, and query logs to tailor monitoring to each asset: