undefined

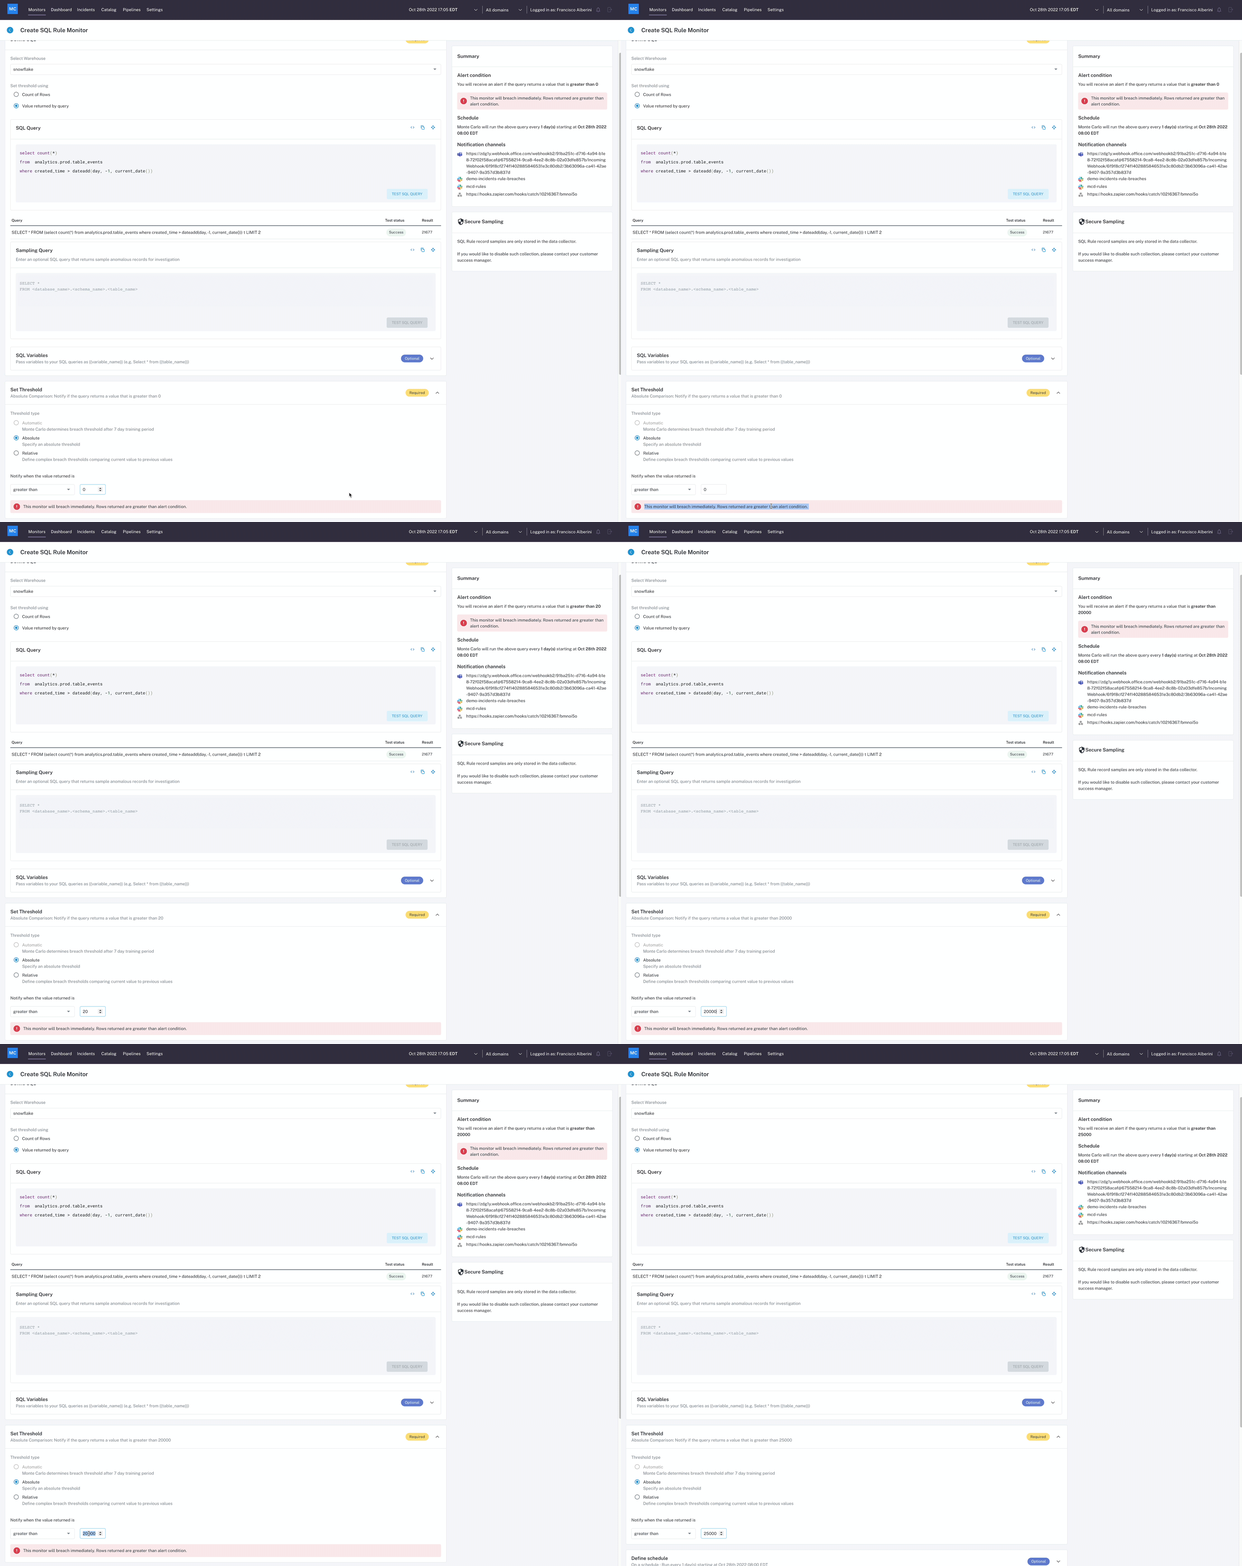
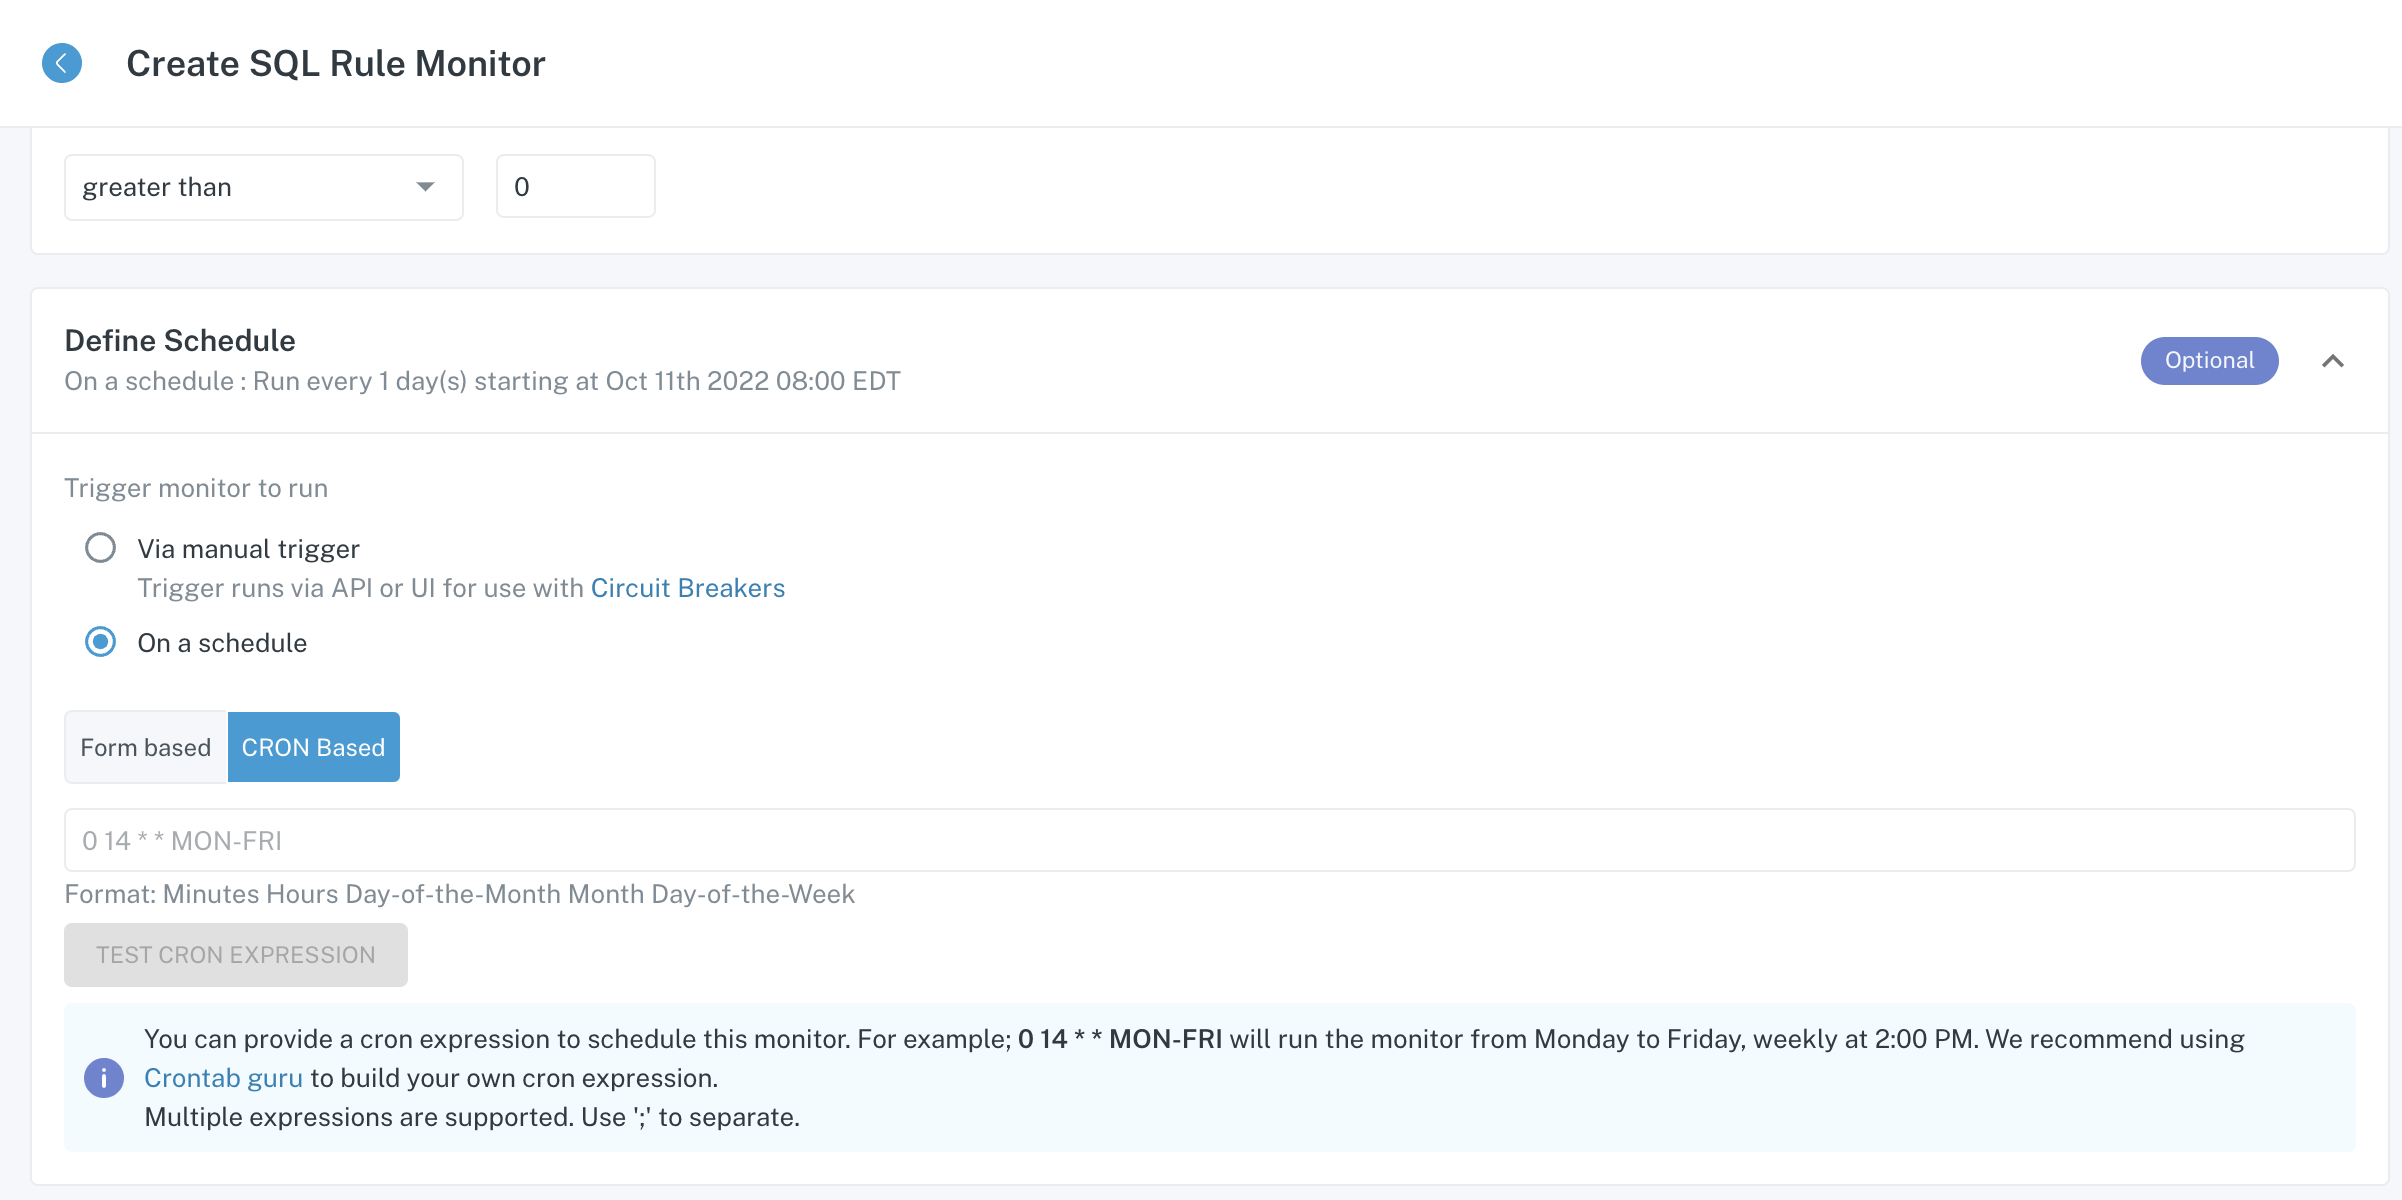
If you want to test a SQL Rule or run it after shipping a pipeline change, you can trigger the rule to run directly from the Monte Carlo App. Visit the SQL Rule detail page and click the Run button in the upper right corner of the page.

undefined

What's new

  • SQL Rules breach data profiling: for SQL rule breaches with sufficient number of breached rows, we now show overview of fields and types of the anomalous records, distribution metrics such as percentiles, and distribution of the most common field values. This feature is available for customers with data collector of version 2939 or later.
  • Granular incident type selection: schema changes are now broken down to fields added, fields removed, field type change, and volume anomalies are now broken down to unchanged size, bytes/rows added, bytes/rows removed, and abnormal small size change. The granular types are available via incident feed filter as well as notification route filters.
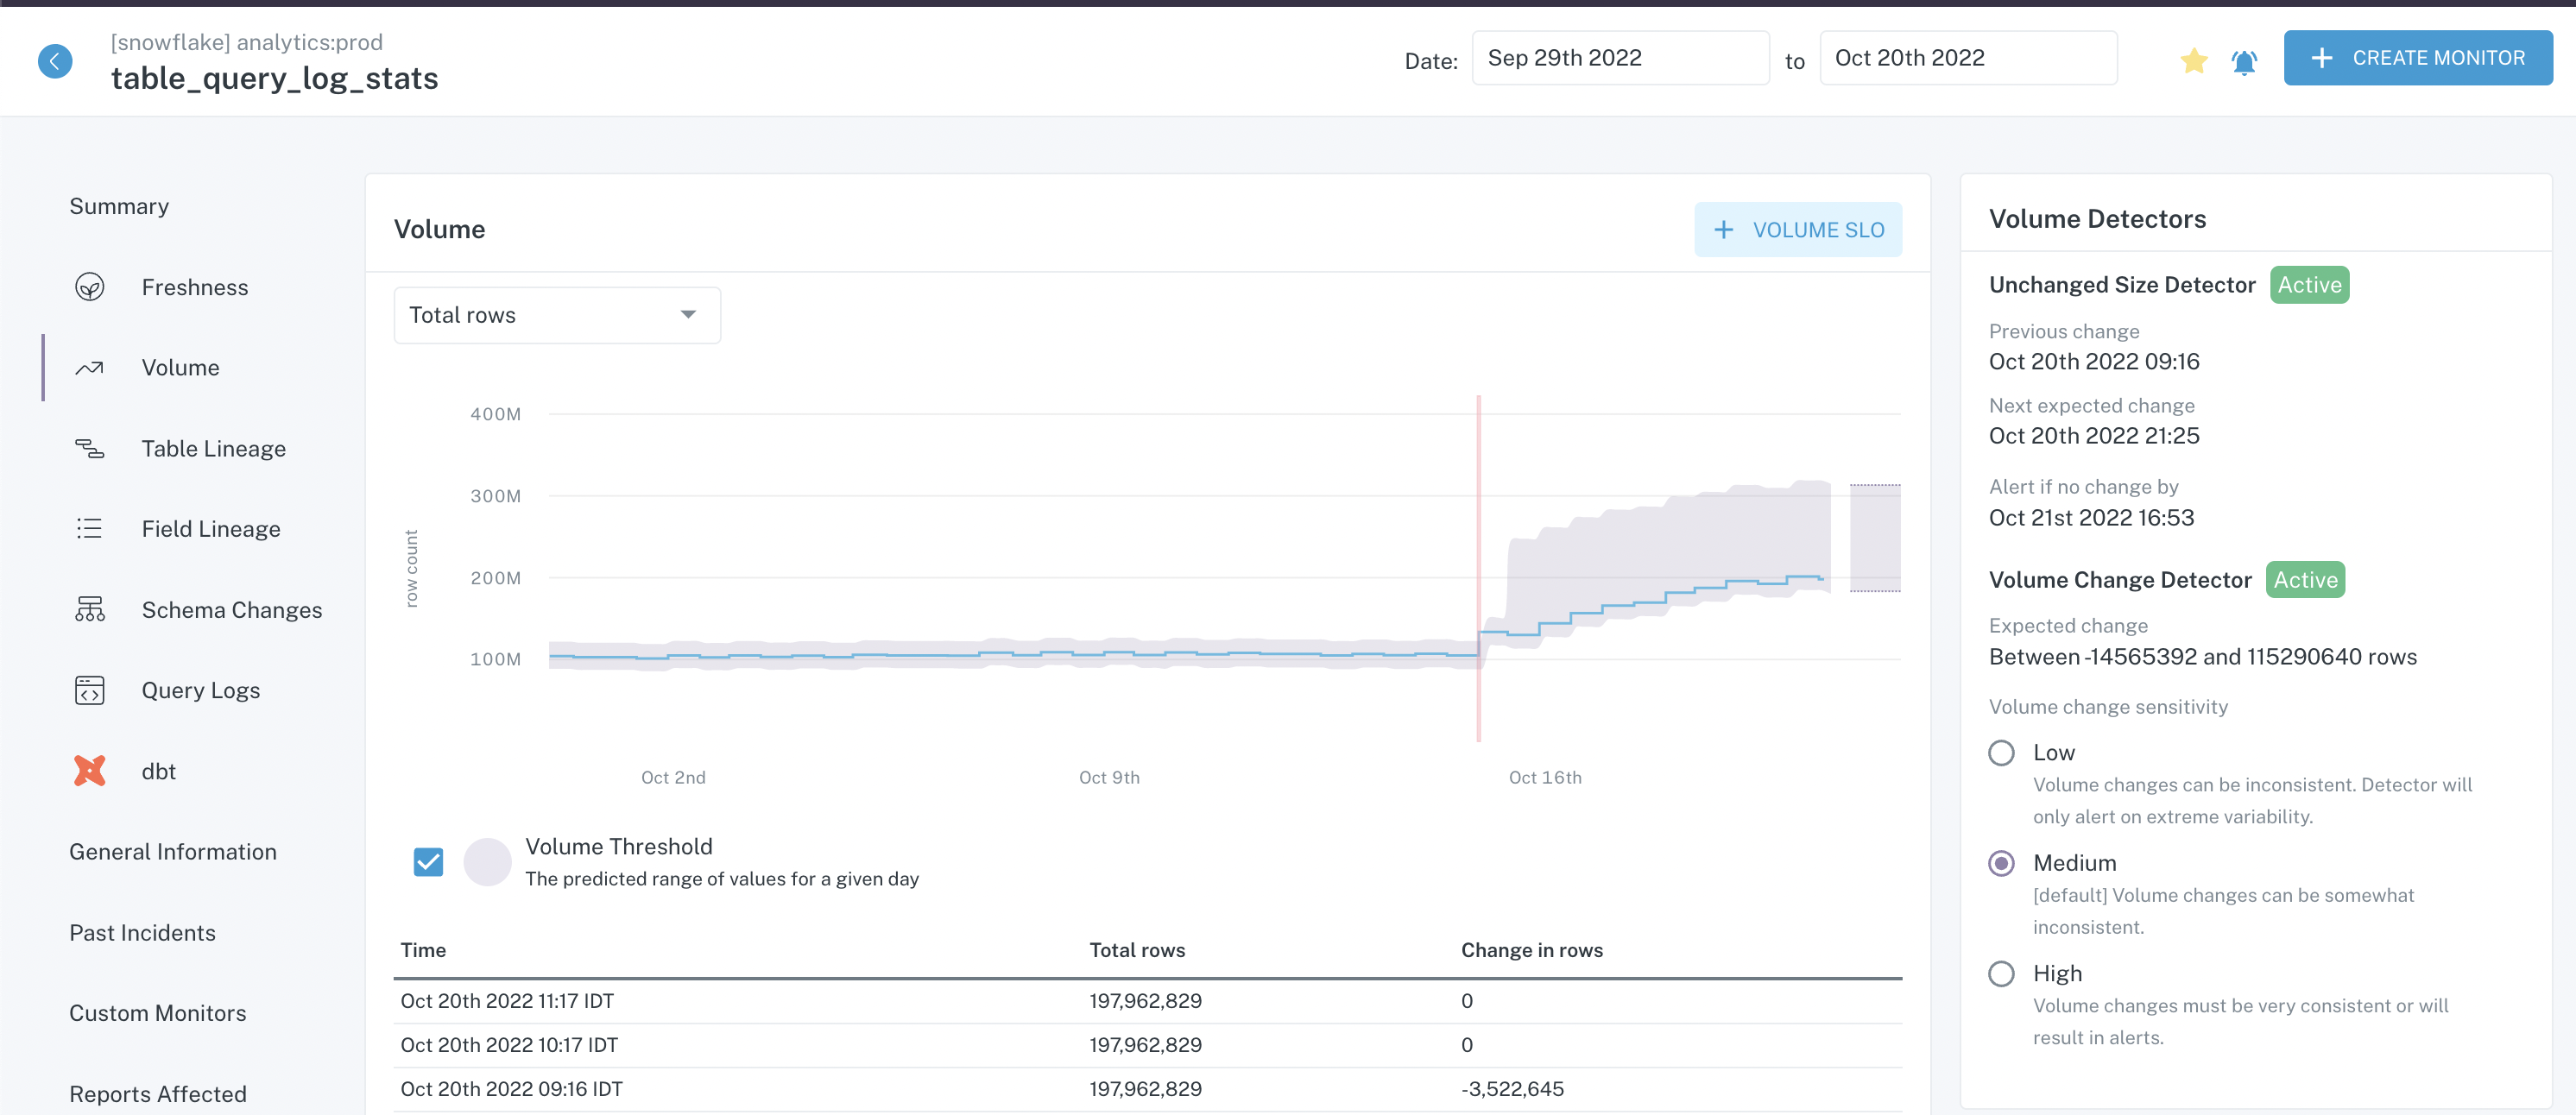
  • Volume SLI revamp and custom sampling: Revamped the volume SLI setup workflow to be more user-intuitive. Enabled volume metadata sampling at custom defined times. Currently supports SLIs based on total table size comparisons; SLIs based on table growth comparisons will be coming soon.
  • Dynamic table tags in notifications: users can now add keys of table tags to pass the values of the tags to incident notifications.
  • Monitor creation via catalog page: users can now directly create custom monitors from the catalog page of a table.
  • In-app notifications: released in-app notifications for product change logs and data collector upgrade reminders.

Improvements and fixes

  • Catalog search improvement: for catalog search, brought back the dropdown list of search matches that was previously removed; added grouping of search matches by categories, i.e. View, Table, Field.
  • Warehouse credentials storage: customer warehouse credentials are now stored in HashiCorp Vault, an industry-standard secrets management system.
  • SSO Disablement: SSO can now be disabled via the UI under Settings.
  • Notification filter enhancement: users can now multi-select SQL rules and SLIs in notification filter settings without the selection list closing on every click.

What's next

  • Field lineage integration with Looker: see field level dependencies with Looker dashboards.
  • SQL rules variables: users will be able to set up custom SQL rules for multiple tables/fields at once, streamlining the creation and management of large number of SQL rules.
  • Volume SLI based on table growth comparisons: the next version of release will enable customers to set up volume SLIs against volume growth measurements in addition to the existing total volume measurements.

undefined:** Quickly check if upstream tables/fields had incidents to determine if the root cause started upstream of the current table + change the look-back range for when upstream incident occurred

  • Query change Root Cause Analysis: RCA helper indicates if the write query on the table changed when the incident occurred to help quickly pinpoint the root cause

Improvements and fixes

  • Granular SQL Rule and SLI filtering options: Released new granular filtering options to the Incident feed and Notification rules to improve relevance of Incidents
  • Improved Incident Owner functionality: Assigning owners to incidents is now significantly easier with dropdown typeahead search, email notifications and the ability to remove owners
  • Private Slack Channel Support: Send notifications to private Slack channels by entering the Private Channel ID in the Notification setup flow
  • Field lineage improvements: Added support for parsing additional SQL clauses including GROUP BY, ORDER BY, UPDATE FROM, MERGE INTO, UPDATE () to our Field Lineage parsing engine
  • Notes support for Monitors as code: Add notes to SQL Rule monitors specified in Monitors as Code
  • Time window filtering to Incident IQ graphs: Change the look-back window of graphs in Incident IQ to help with investigations
  • Recent Incidents in Monitor Detail page: When reviewing the details of a custom monitor, view all recent incidents generated by said monitor

What's next

  • Airflow integration: View airflow task logs from within Monte Carlo to support investigations and orchestration context
  • Field lineage integration with Looker: See field level dependencies with Looker dashboards
undefined

What's new

  • Slack-UI Bidirectional Status Sync: When users update incident status in the UI, the corresponding incident status in Slack will also be updated accordingly.
  • Airflow Integration Beta: beta version of the Airflow integration is available for customers who store their Airflow logs in s3. This feature helps users troubleshoot data incidents by exploring Airflow DAG and task failures directly from Incident IQ. Please reach out to your customer success manager to set up the integration.
  • Incident Feedback: users are now able to provide feedback on the helpfulness of each incident by clicking on the emojis next to incident cards, or on top of the incident IQ page.

Improvements and fixes

  • Field lineage in Incident IQ: for field health and dimension tracking incidents, we now show in the Incident IQ page the corresponding field level lineage in addition to the table lineage.
  • Affected Reports Usability: the list of reports in the Affected Reports module is now filterable by report type and searchable via report name.

What's next

  • Domains-based Access Controls: Define user groups to assign read only or write access per domain
  • Field lineage integration with Looker: See field level dependencies with Looker dashboards
  • Automated Root Cause Analysis: A suite of RCA tools to identify high correlations between certain field values and field anomalies, build statistical profile for anomalous rows, and trace upstream incidents using lineage.
undefined

What's new

  • Segmented field health: Users can now set up field health monitor segmented by a specified field so anomalies can be detected for each segment.  
  • SQL rules and SLIs misconfiguration warnings: in insight report, snowflake data share, and the monitors page in UI, we now show warnings if any SQL rules or SLIs are breaching 80% of the times they run, and if there is not enough data to detect anomalies for SQL rules with ML thresholds.
  • Looker lineage liquid templates: added capability to parse and interpret liquid templates in Looker.
  • Incident Status Tracker: released a visual tracker for incident status updates on incident feed page. Note that the tracker can be filtered by domains but not by other filters on the incident feed page.
  • Freshness detector sensitivity tuning: For the automated freshness and unchanged size detectors, customers can now set a minimum number of hours that must pass since last update before an alert can be issued. Users can access t his feature by going to the freshness or size module in Catalog page.

Improvements and fixes

  • Sampling/reproducing feature via Slack: Users can now go into sampling queries and reproducing queries for dimension tracking and field health incidents directly from Slack.
  • Rules breach incident titles in email: rule breach alerts via email now clearly specify in their titles whether the rule breaches are freshness SLIs, volume SLIs, or SQL rules. 
  • CLI improvement: Monte Carlo's CLI now supports Python 3.7, 3.8, 3.9, 3.10, and the current 3.11 alpha. In addition, Users can now generate help text via montecarlo help to retrieve documentation on all commands, subcommands and options.
  • Incident dashboard improvement:  In incident dashboard, users can now click on the summary stats or the chart bars to drill in to the data behind the dashboard.

What's next

  • Domains-based Access Controls: Define user groups to assign read only or write access per domain
  • Airflow integration: View airflow task logs from within Monte Carlo to support investigations and orchestration context
  • Field lineage integration with Tableau: See field level dependencies with Tableau dashboards and worksheets.

undefined 

  • Tableau field level lineage: Expanded field level lineage coverage all the way to Tableau workbooks to better understand field-level relationships across the warehouse and BI layer
  • Enhanced support for seasonality and irregular table update patterns: Released multiple improvements to our anomaly detection models to reduce incidents generated by expected weekend usage patterns, irregularly updated tables, and more.
  • Automatic Freshness and Volume detector status: We now show the detector status for our automatic Freshness and Volume detectors in the table detail view and soon the catalog view
  • Snowflake streams support: We now support Snowflake streams in lineage and catalog to help improve the e2e coverage of your data stack in Monte Carlo

Improvements and fixes

  • Impact radius: We now group data warehouse queries by user to help you more quickly parse the queries and determine the impact of the incident
  • Show SQL Rules in recent incident module in Catalog: We now show SQL Rule incidents for a specific table within the Catalog Recent Incidents module
  • Incident Status tracker improvements: We now breakdown the incident status tracker by status Type and show when there are no new incidents for the current week
  • PyCarlo SDK improvements: Improved error handling including configurable automatic retries on typically transient errors (see release notes here)

What's next

  • Domains-based Access Controls: Define user groups to assign read only or write access per domain
  • Airflow integration: View airflow task logs from within Monte Carlo to support investigations and orchestration context
  • Field lineage integration with Looker: See field level dependencies with Looker dashboards
undefined

What's new

  • Dashboard tab redesign with Incident graph: Completely redesigned the Dashboard tab to help analyze incident trends and evaluate MC coverage
  • Editable Key Assets: Manage which tables are considered Key Assets, view table authors and importance score
  • Alation integration: Enable the Alation integration to automatically send Monte Carlo Incidents into Alation to display on the table's resource page
  • Incident feed tag filters: Added support for filtering the Incident feed with tags

Improvements and fixes

  • Differentiate between SQL Rules and SLI Incidents: Incident cards now differentiate between SQL Rule breaches and Volume or Freshness SLI breaches
  • Monitor link from Incident IQ: View the custom monitor that generated an incident event right from Incident IQ
  • Add table counts to Schema Muting UI: When muting schemas, we now show the count of tables within the selected schema that will be muted
  • Looker lineage improvements: Improved support for variable replacement in LookML files and user attributes in the lineage parser
  • Field-level cleanup suggestions: A new downloadable Insight report lists fields that have no downstream activity and thus are good candidates for deletion
  • Added timezone to all timestamps: All timestamps across the app now specify which timezone is being used

What's next

  • Domains-based Access Controls: Define user groups to assign read only or write access per domain
  • Airflow integration: View airflow task logs from within Monte Carlo to support investigations and orchestration context
undefined

You can now set up integration with dbt Cloud in 10min!

What's new

  • dbt Cloud Integration: Released a new dbt Cloud integration which allows customers to use the data collector to automate the integration process. Customers simply need to use the Monte Carlo CLI to perform a one-time installation process, and the data collector will automatically sync data from the dbt Cloud accounts to Monte Carlo. This will also ensure that the data is comprehensive and current from dbt. Docs can be found here.
  • Compare Queries: Users can now compare two queries side by side to analyze the differences. You can access this feature by going to the Query Log section in either Catalog or Incident IQ, toggle on "compare multiple queries", click on the query graph for each of the queries of interest, and hit "Compare Queries".
  • Filter by domains: Customers who have set up domains can now use those as dataset filters to route notifications.

Improvements and fixes

  • Bulk muting: On the "Mute Datasets" and "Mute Tables" tabs under notifications settings, users can now search by regex and mute or unmute all visible search results in bulk. 
  • Looker report links: The "Metadata" section in Catalog page for Looker dashboards, Looks, and Explores now include links to those reports in Looker. 
  • Monitor label improvement: Updated the color labelling for each monitor type on the monitors page as well as in Incident IQ page under "Active monitors".
  • DW Users improvement: The details tables for DW Users metric on incident Impact Radius are now organized by data warehouse usernames. 
  • Insights on docs site: Added a docs page for each Insight report from Dashboard. The docs include definition for every field included in each Insight report.

What's next

  • Edit Key Asset: Soon users will be able to overwrite the automatically designated Key Assets to customize which tables are treated as Key Assets.
  • Airflow error logs: Integrate Airflow task error logs into Incident IQ to help users investigate pipeline issues for incidents
undefined

Despite the short month, the team continued to ship a bunch of great features across the app!

What's new

  • SQL Rule Circuit Breakers:To help prevent data issues, you can now use Monte Carlo circuit breakers to stop pipelines when a SQL Rule check fails. We developed multiple mechanisms to integrate seamlessly with your pipelines including an Airflow provider, Python operator, and direct API support. See docs here
  • Expanded Reproducing and Sample query support:To speed up incident investigations we now show queries to reproduce an anomaly and to sample anomalous data in the Incident cards and in Incident IQ
  • Importance score & Key Asset Notification filters:To improve the relevance of notifications you can now filter notifications by Monte Carlo's computed importance score for tables
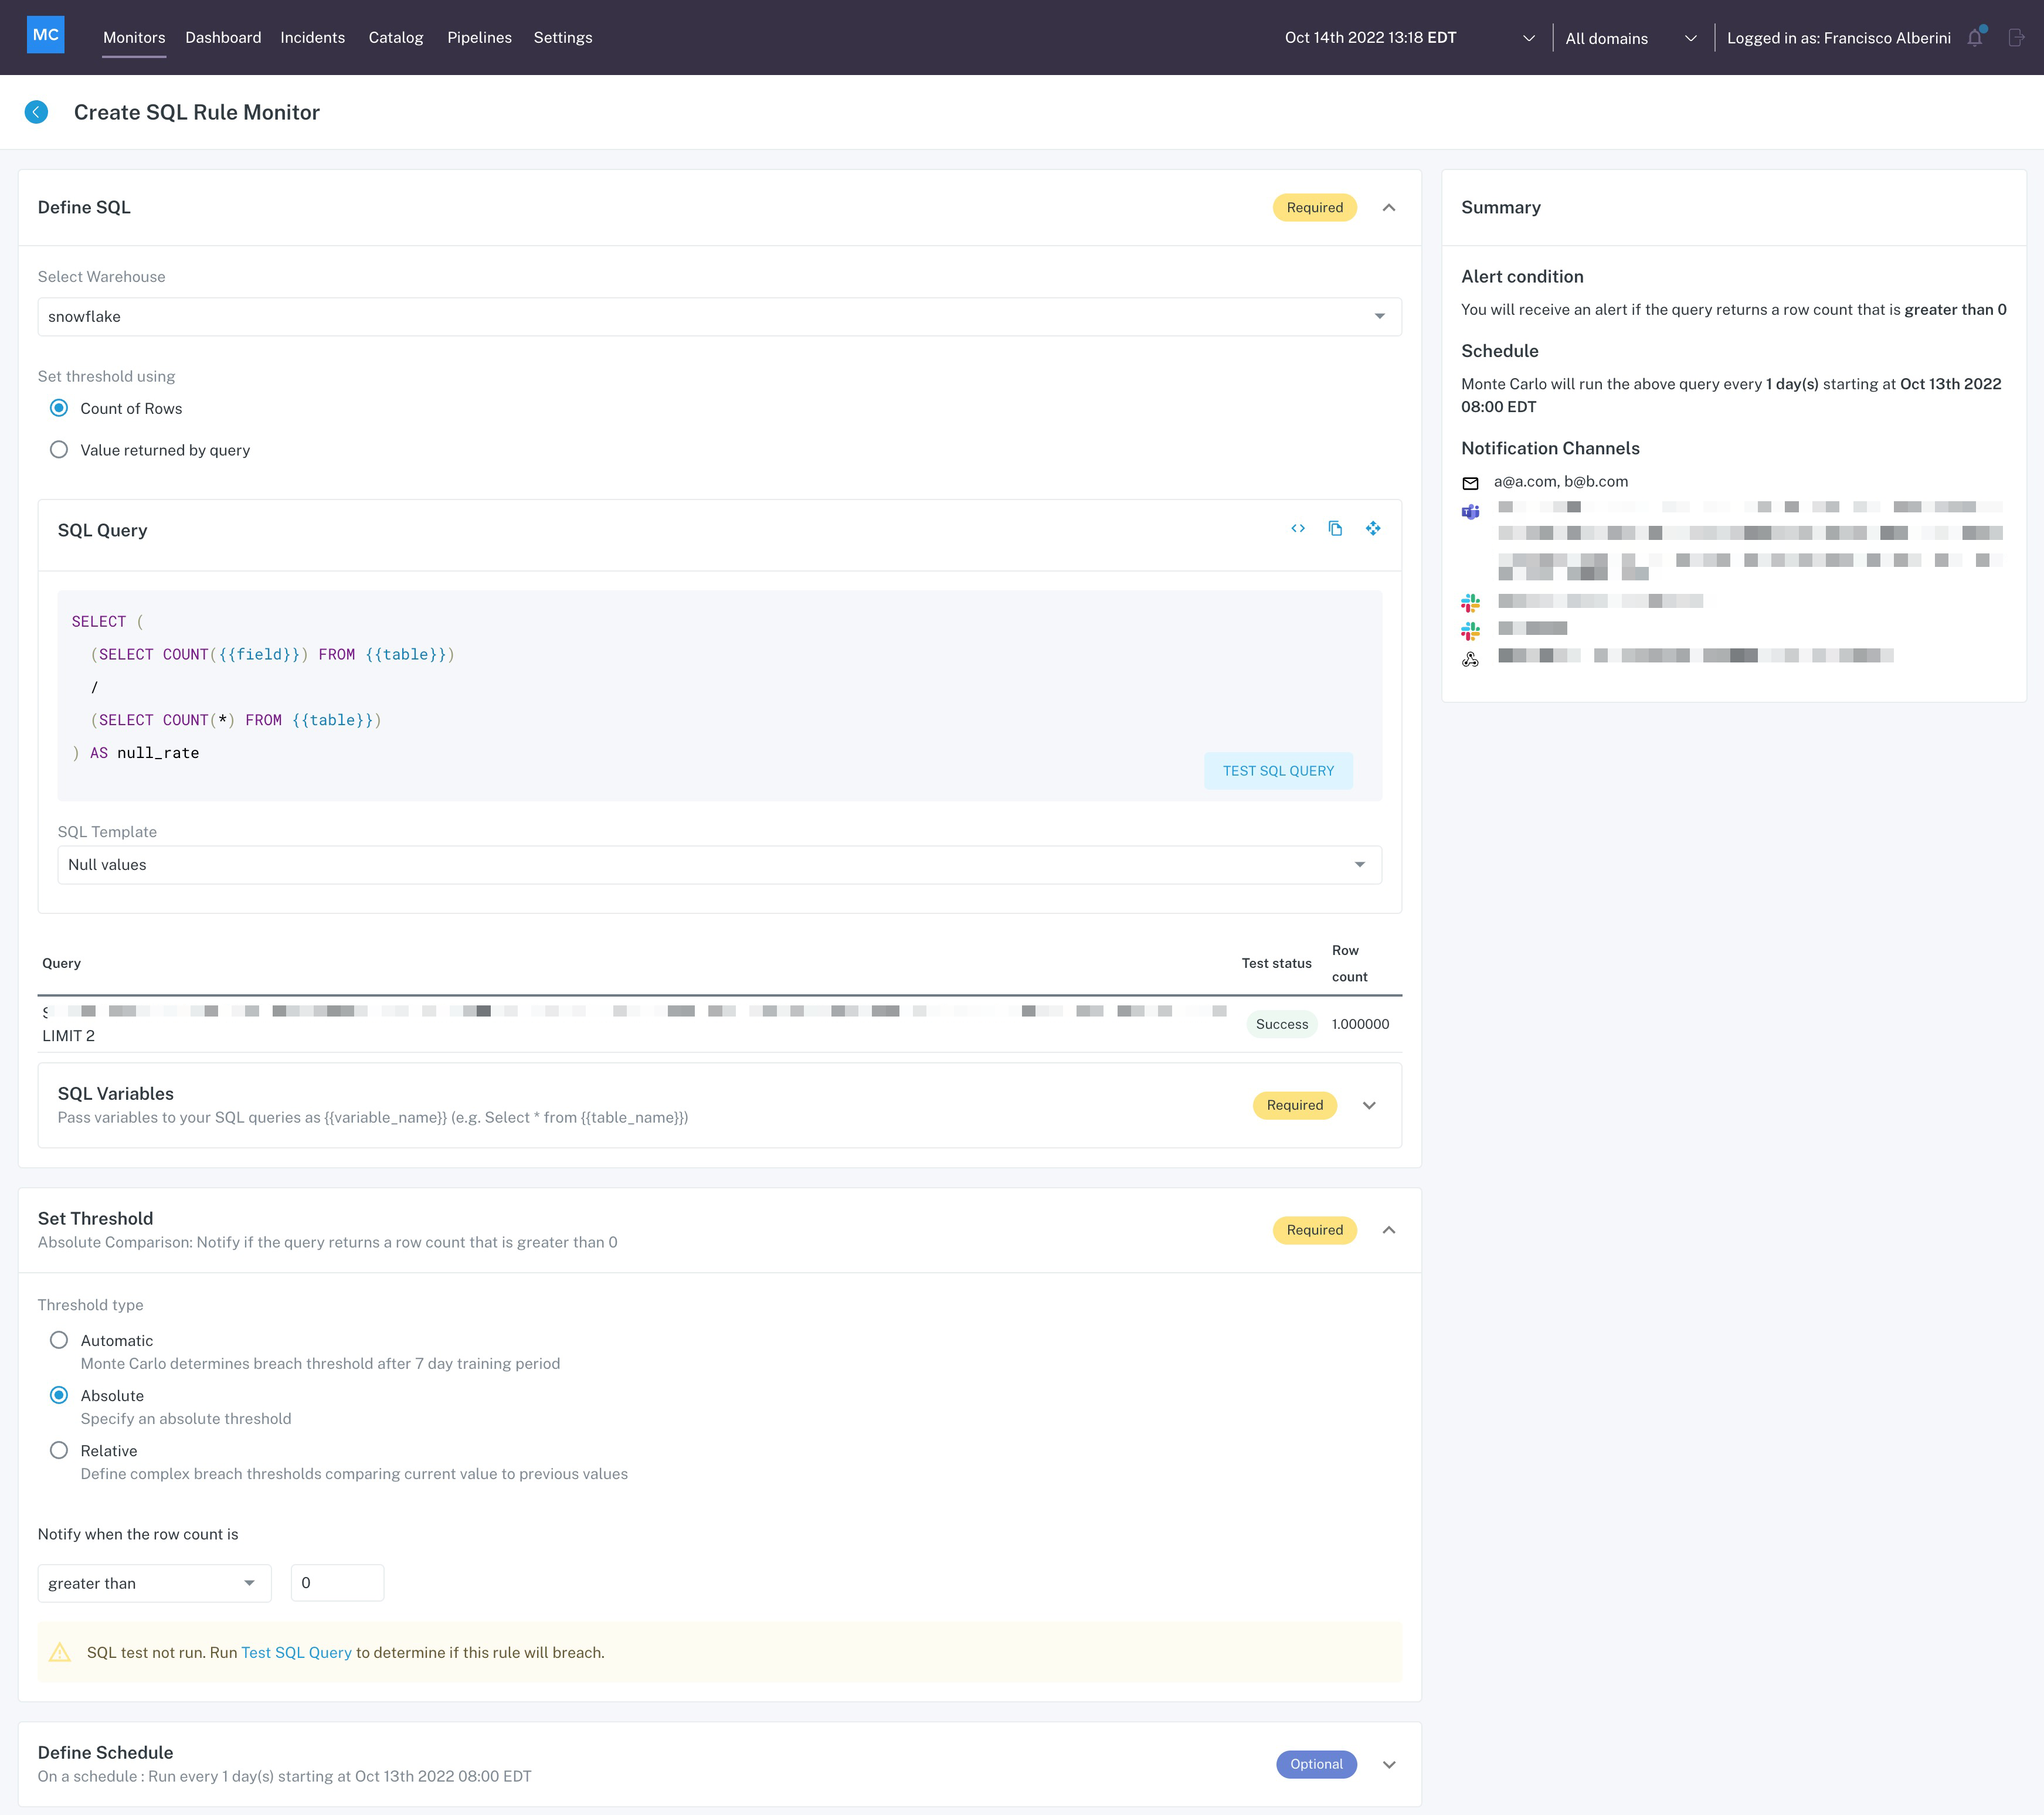
  • Automatic thresholding for SQL Rules: Instead of explicitly defining a threshold for each SQL Rule, we now offer a ML-based threshold detector that will notify you of abnormal activity in number of rows returned by the SQL Rule

Improvements and fixes

  • Weekly seasonality support for volume detectors: When a FH monitor is applied to a table, we also deploy volume monitors that look for more detailed volume changes. Those monitors now incorporate seasonality to provide more reliable detections.
  • Add support for editing integrations: Users can more easily edit Tableau and Looker integration settings from the UI
  • Fix new Impact Radius module rendering issues: Fixed a bug that was causing issues rendering the Impact Radius module for some customers

What's next

  • Airflow error logs: Integrate Airflow task error logs into Incident IQ to help users investigate pipeline issues for incidents
undefined

We just launched a series of new features in Incident IQ to help customers quickly evaluate the priorities of incidents and investigate them!

What's new

  • Impact radius: we now display an impact radius diagram for each incident in the Incident IQ page. The diagram aggregates stats on users, queries, and reports affected by the incident to help users determine the priorities of incidents (explainer video here. Users can see any dbt error, warning, or failed tests for tables involved in incidents. Users can also check dbt model and test run logs from the UI (See dbt integration setup instructions here and explainer video here. 
  • Sampling queries: queries to sample the anomalous rows are provided in incident IQ page as well as on incident cards for field health anomalies with metrics including % unique, % null, % negative, %zero. Sampled records are provided in Incident IQ for freshness anomalies and volume anomalies (explainer video for the feature here. 
  • Reproducing queries: queries to reproduce anomalies are now provided in incident IQ for 2 incident types: field health anomalies and dimension tracking anomalies. Users can run the provided queries in warehouse to reproduce the anomalous m etrics that Monte Carlo caught (explainer video for the feature here.

Improvements and fixes

  • IAM policy automation: IAM policies can now be auto-generated via our CLI with the relevant values and permissions derived. Athena and Glue are supported by the policy generator. See doc here. 
  • IAM role creation with CloudFormation template: released a command that derives and auto-builds a CloudFormation template to create an IAM role compatible with MC Data Collector. See docs here.
  • Rule notes Slack tip: added a tip to SQL rule notes creation in monitors creation view on how to tag Slack users in rule notes. 
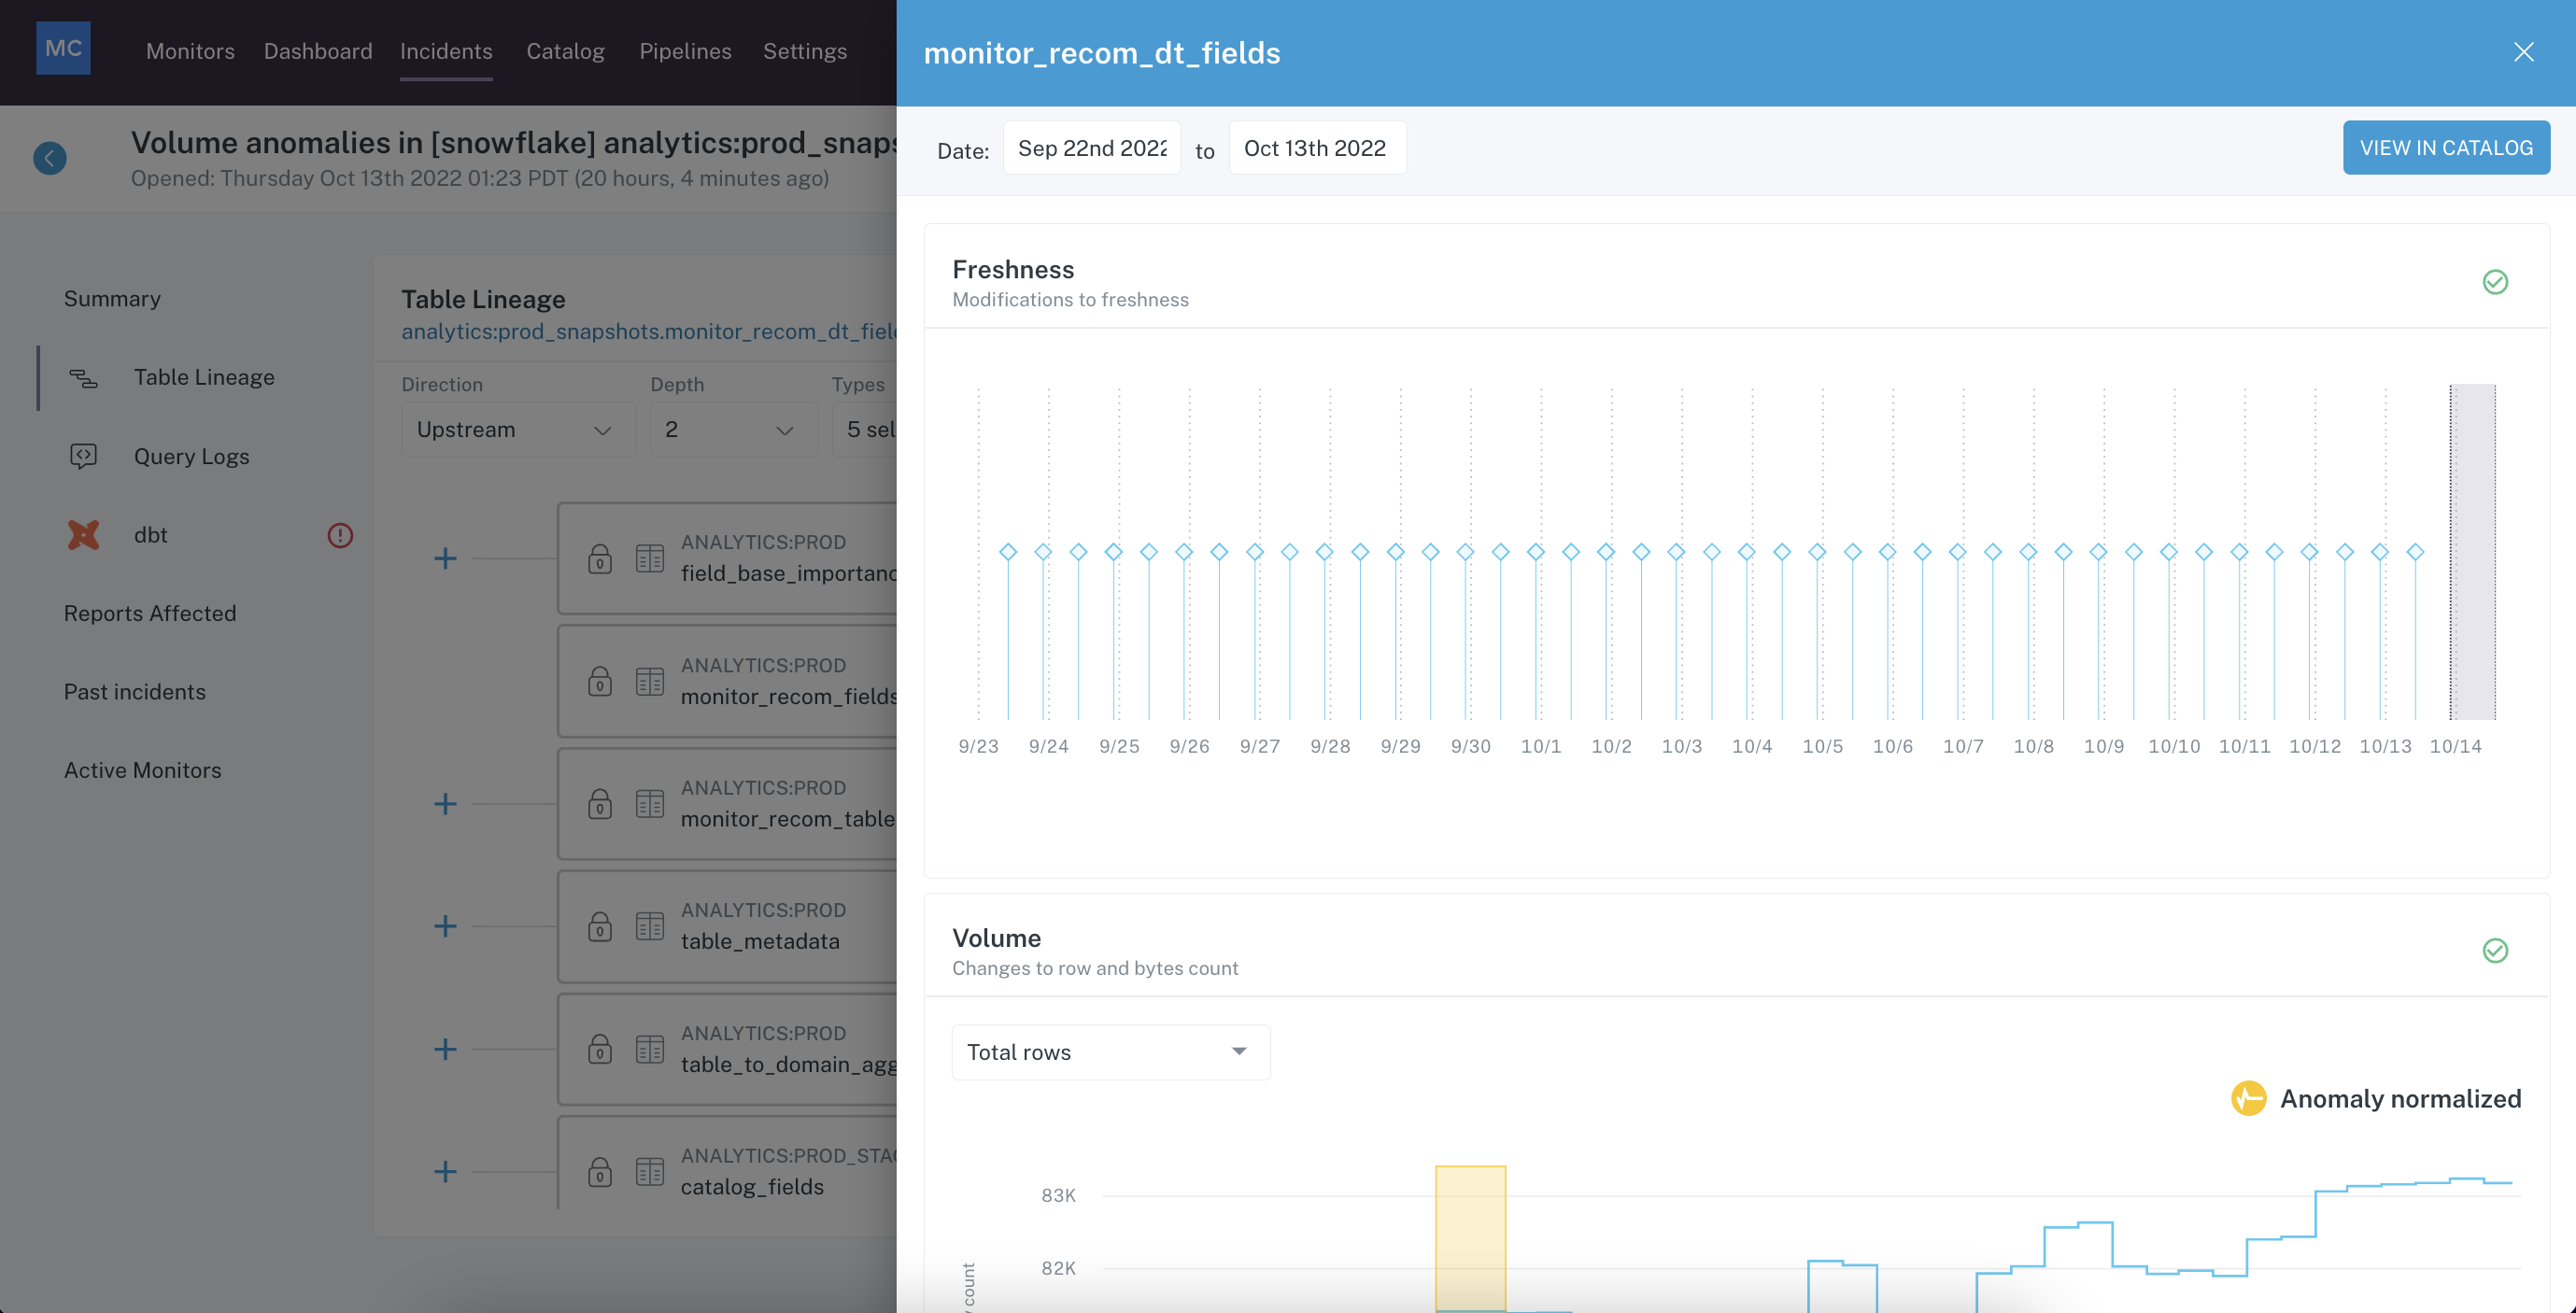
  • Lineage in incident IQ: added table lineage view in incident IQ page so users can quickly identify the immediate upstream and downstream dependencies for each table involved in an incident.
  • Runbook removal: removed the runbook tab in incident IQ.
  • Rule notes in root cause analysis: SQL rule notes are added to the Root Cause Analysis module in incident IQ for SQL rule breaches so users can easily reference the rule notes for context for incident investigation.
  • High correlation insights in root cause analysis: any high correlation between volume anomalies and field dimensions are included as insights in Root Cause Analysis module in incident IQ for volume anomalies (see explainer video here.
  • Query log in root cause analysis: query logs are added to Root Cause Analysis module in incident IQ so users can check for any query changes that can provide clues for incident investigations.

What's next

  • Circuit breakers: trigger Monte Carlo data quality checks and validate incidents with code to stop problematic jobs before they pass data downstream.
  • Airflow error logs: integrate Airflow task error logs into Incident IQ to help users investigate pipeline issues for incidents.