undefined

What's new

  • DBT metadata in Catalog: the catalog page now imports dbt information including models, tags, descriptions, so users can manage all metadata centrally in Monte Carlo. See dbt integration setup instructions here.
  • Rule notes: customers are now able to create notes for each SQL rule monitor and receive such notes in rule breach notifications, so teams can refer to such notes for context. 
  • Heavy Queries insight report: released a new insight report that shows the heaviest queries from each warehouse/user every week, so customers can preemptively stop data issues and reduce warehouse load.
  • Network recommender for onboarding: added CLI capability to help with onboarding by analyzing resource and collector configurations and making step-by-step recommendations on how to connect. See docs here.

Improvements and fixes

  • Deteriorating Queries insight: added visualized trends in query execution time as html file in insight report "Deteriorating Queries".
  • Monitor as Code bug fix: shipped a bug fix so that when new configuration is applied via monitor as code any monitors previously defined via code are no longer displayed as "UPDATED" as long as no attributes are changed for those monitors.
  • Key assets in Slack: key assets in slack notifications will have a star emoji next to them so they can more easily spotted to help users prioritize incidents.
  • Incident IQ CTA: redesigned the Incident IQ button on incident card to make that CTA more obvious and clear to users.

What's next

  • Impact radius: help customers assess the impact of each incident by aggregating metrics on relevant users, queries, and downstream dashboards.
  • Root Cause Analysis module: summary of incident investigation pointers in Incident IQ to help users check and eliminate possible root causes for given data incidents.
  • Circuit breakers: trigger Monte Carlo data quality checks and validate incidents with code to stop problematic jobs before they pass data downstream.
undefined

What's new

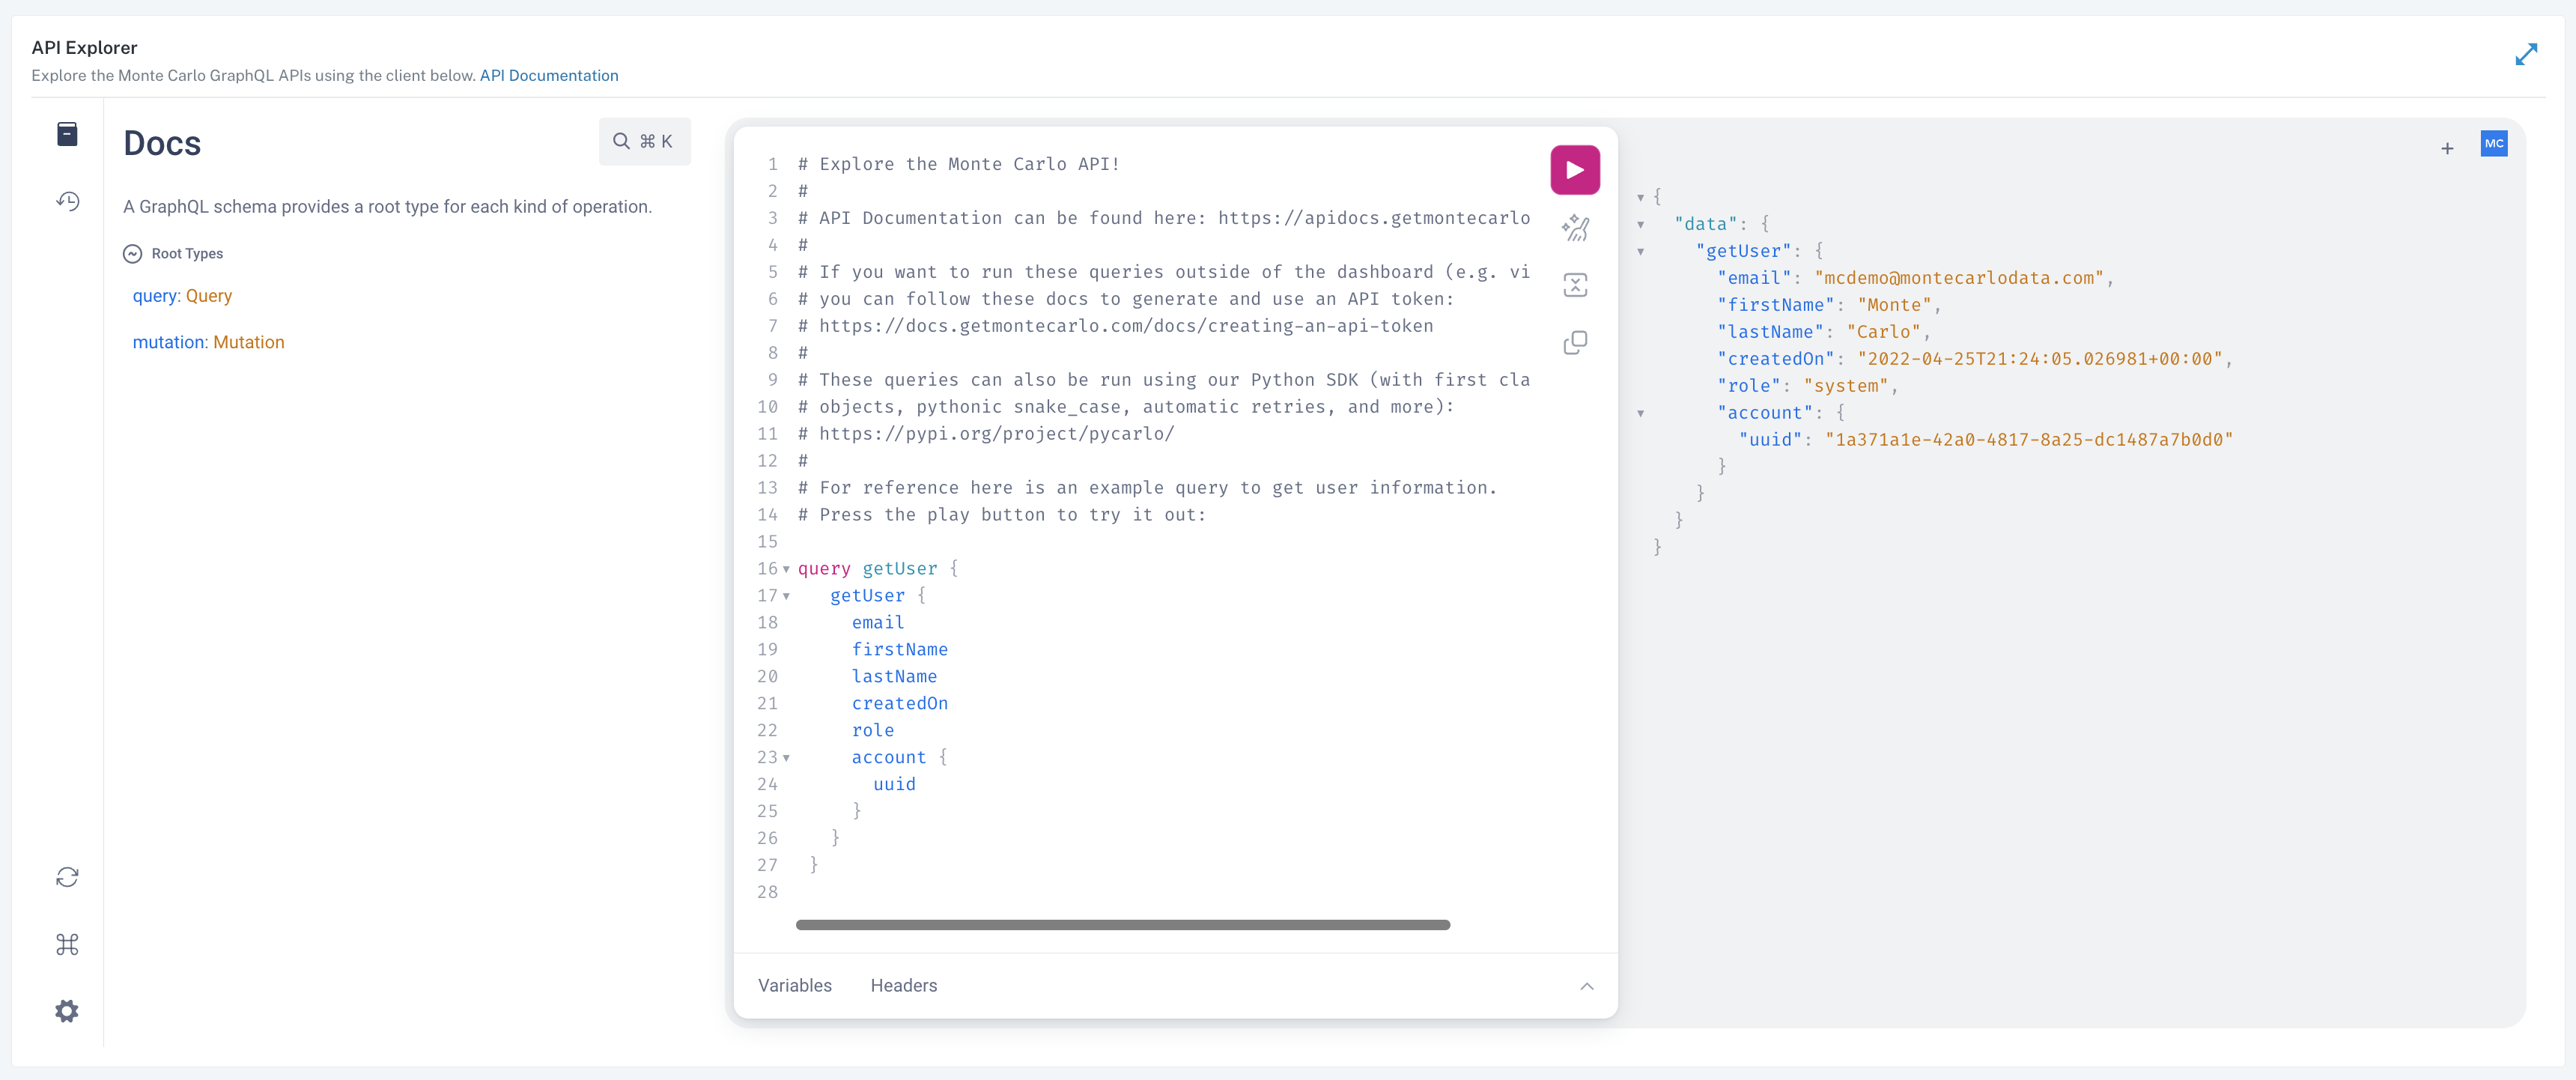
  • "PyCarlo" - Monte Carlo's Python SDK: we just released an alpha Python SDK! All available queries and mutations via the APIs today will be supported via the SDK. This will be the foundation for customers to easily access Monte Carlo capabilities programmatically going forward. 
  • Schema changes daily digest: Users are now able to receive notifications on schema changes in the form of a daily digest via email. Slack support will follow shortly. This can be configured in notifications setting under "Delivery Cadence".

Improvements and fixes

  • Pipelines chart improvement: The pipelines chart can now load nodes with up to 100,000 upstream or downstream dependencies, significantly expanding on the previous limit of 1,000 nodes.
  • Monitor status: on the monitors page, added a new column on Monitor Status, which shows if each monitor is in error, training, etc. Users can filter for monitors by status and can easily see if any monitors are misconfigured. 
  • Network connectivity test: customers can now specifically test data collector's network connectivity issues separately from other connection problems (i.e. timeouts / permissions). Network testing is available both in onboarding wizard and under integrations settings.  
  • Email group UX fix: email notifications created with multiple recipients are now treated as a single notification, so that users no longer have to edit notifications setting for each individual email separately.

What's next

  • Rule notes: users will soon be able to add notes to each SQL rule monitor, so that when rule breaches happen teams can reference the notes, i.e. for troubleshooting.
  • Impact radius: help customers assess the impact of each incident by aggregating metrics on relevant users, queries, and downstream dashboards.
  • Circuit breakers: trigger Monte Carlo data quality checks and validate incidents with code to stop problematic jobs before they pass data downstream.
undefined

What's new

  • Anomalous rows in SQL rule breach: when SQL rule breaches happen, Monte Carlo now displays the rows in breach to help customers investigate the incidents. Such data is stored in the data collector only and not in Monte Carlo's cloud services.
  • RCA Insight in BigQuery: This feature identifies high correlations between volume anomalies and field dimensions, which are shown as insights to provide clues for incident investigations. The availability of this feature is now expanded from Snowflake and Redshift to also BigQuery customers.

Improvements and fixes

  • User invite: users can now invite other users who have existing Monte Carlo accounts to join their organization accounts.
  • Incident details rendering fix: domain filters are now removed from incident details page, so that users will not run into unavailable incident details page when a different domains is selected.
  • WHERE filter edit bug fix: the WHERE filter edit button in the monitor details view now links to the correct editing screen.

What's next

  • Impact radius: help customers assess the impact of each incident by aggregating metrics on relevant users, queries, and downstream dashboards.
  • Circuit breakers: Trigger Monte Carlo data quality checks and validate incidents with code to stop problematic jobs before they pass data downstream.

undefined insight reports via Snowflake data share. This capability is also supported in multiple regions across cloud providers.

  • SQL rule monitor warehouse selection fix: in the edit view of a SQL rule monitor, the corresponding warehouse now remains selected.
  • Freshness thresholds display fix: thresholds for freshness issues are now only shown in catalog view, not in incident chart.

What's next

  • SQL Rule monitor breached rows: users will soon be able to see which rows breached SQL rule monitor condition in addition to just the number of rows.
  • Circuit Breakers: Trigger Monte Carlo data quality checks and validate incidents with code to stop problematic jobs before they pass data downstream.
undefined

What's new

  • Incident History Insight Report: includes incidents detected by Monte Carlo over the last 6 months to help customers report incident status, track response time, and spot trends.
  • BI Dashboard Analytics Insight Report: provides dashboard importance score based on number of report views and access days.
  • UI Access during Onboarding: new customers that finish technical setup in onboarding can now access the MC UI right away, initially to monitors page and catalog page

Improvements and fixes

  • Incident feed filter bug: fixed a bug on dataset filters for incidents from SQL rule breaches. SQL rule breaches were previously not listed when a dataset was selected and now they are correctly filtered.
  • User login case insensitivity: enabled input case insensitivity for non-SSO user logins.
  • Volume SLI setup summary text error: corrected summary texts for volume SLI absolute monitor setup page. The text previously erroneously described thresholds on volume delta; now it is corrected to define total volume thresholds.

What's next

  • SQL Rule monitor breached rows: users will soon be able to see which rows breached SQL rule monitor condition in addition to just the number of rows.
  • Circuit Breakers: Trigger Monte Carlo data quality checks and validate incidents with code to stop problematic jobs before they pass data downstream.
undefined

Ho ho ho...two big gifts from Santa just in time for Xmas: custom monitor bulk recommendations and interactive features via MS teams channels.

What's new

  • Custom monitors bulk creation: users can now bulk create field health and dimension tracking monitors in the UI from a list of recommendations.
  • Status updates & snooze via MS Teams channels: users can now update incident status and snooze incidents from MS Team channels.

Improvements and fixes

  • Lineage node deletion API: released an API mutation to delete lineage nodes and their connected edges.
  • Distribution anomaly description fix: more accurately describe what the distribution percentages typically are as compared to anomaly percentages for dimension tracking monitors.

What's next

  • SQL Rule monitor breached rows: users will soon be able to see which rows breached SQL rule monitor condition in addition to just the number of rows.
  • Circuit Breakers: Trigger Monte Carlo data quality checks and validate incidents with code to stop problematic jobs before they pass data downstream.

Spark lineage available in beta, UI improvements across notifications and onboarding flows.

What's new

  • Spark Lineage Beta: beta version of Spark lineage is now ready for testing! Please reach out to your point of contact at Monte Carlo to get access.
  • Delete integrations via UI: users can now remove connections from the integrations settings page.

Improvements and fixes

  • User invite during onboarding: user invite feature can now be accessed from the top navigation bar, so customers can invite others during the onboarding process as well.
  • Slack channel refresh: in notifications setting, added the ability to refresh the list of Slack channels so customers with Slack integration can access any newly updated Slack channels from Monte Carlo.
  • Dataset selector in notifications settings: in notifications setting, updated dataset selector setting so that if rules is selected as as the only type of incident then dataset selector is disabled, but if other types of incidents are selected along with rules then data selector is enabled.
  • Affected reports loading bug: fixed a bug to show a loading indicator before affected reports are loaded in catalog, instead of showing "no affected reports" previously.

What's next

  • MS Teams integration - status updates: in addition to alert routing, we will soon let users update incident status and snooze incidents from MS Team channels.
  • Custom Monitors Bulk Creation: users will soon be able to bulk create field health and dimension tracking monitors in the UI from a list of recommendations.
undefined

Improvements and fixes

  • Monitor as Code source control: disabled edit and removal of monitors from UI if the monitors are created via code.
  • Pipeline download improvement: moved the download button for Pipelines to the header so users can download Pipeline files even if the graph could not be rendered.
  • Data lake volume chart display fix: fixed incident chart display in the scenario where anomaly lasts for more than 3 days.
  • Notifications dataset selection bug: fixed a bug in notification setting so that the custom dataset/tag selection from previous session would not persist to the next session.

What's next

  • MS Teams integration - status updates: in addition to alert routing, we will soon let users update incident status and snooze incidents from MS Team channels.
  • Spark lineage: For our Spark customers, we're working on surfacing the lineage between tables/fields from Spark jobs.
  • Circuit Breakers: Trigger Monte Carlo data quality checks and validate incidents with code to stop problematic jobs before they pass data downstream.
undefined

The past two weeks have been full of exciting developments!

What's new

  • Mode Integration: A light-weight Mode integration is now supported! Any Mode dashboards that customers have are automatically included as an object in Catalog and as part of table lineages.
  • Volume monitor thresholds for next update & expected size: Added visual thresholds to Size graphs which show when our anomaly detection models expect the next update to occur as well as the expected table size growth.
  • Granular anomaly type filtering: The all-encompassing "anomalies" label in notification settings route filter, incident list filter, and incident titles are now broken down to 4 granular types: freshness anomaly, volume anomaly, dimension anomaly, and field health anomaly.
  • User Tagging via Notifications: added instructions for tagging Slack users via custom message in the notification setting workflow.
  • Faster new pattern detection for Freshness: our freshness anomaly detection ML models are now able to detect a pattern shift within the 3 week training window.

Improvements and fixes

  • Field lineage temp table support: temp tables generated via dbt are now resolved into final destination tables in field level lineage graphs.
  • Improved monitors filtering: In the Creator column of the custom monitors list, added option to filter based on monitor creation - via UI v.s. via Monitor as Code. Also added ability to filter for one type of monitor by clicking on the color chip.
  • Field health metrics navigation: Users can now click on the right arrow button on field health incident card or Incident IQ to navigate to the monitors details view for the relevant field and metric.
  • SSO setup improvement: Instead of immediately disabling all password users when SSO is added to an account, we now wait until the first successful SSO login from a user from an account, to allow for smoother transition from password to SSO logins
  • Warehouse connection test: Users can now go to Settings -> Integrations to test existing warehouse connections.
  • Data Governance dashboard: a fully interactive version of this Looker dashboard can now be recreated for customers using Snowflake data share.
  • Field Search in Catalog: users are now able to search for fields in the Field Lineage section of the Catalog page.

What's next

  • MS Teams Integration: Incident communications via Microsoft Teams will be supported very soon.
  • Spark lineage: For our Spark customers, we're working on launching lineage which will allow you to map how queries interact to form lineage.
  • Circuit Breakers: Trigger Monte Carlo data quality checks and validate incidents with code to stop problematic jobs before they pass data downstream.
undefined

Another week of exciting developments to improve observability into Monte Carlo and further reduce false positive incidents!

What's new

  • Freshness next update thresholds: Added visual thresholds to Freshness graphs which show when our anomaly detection models expect the next table update to occur
  • Notification filter exclude support: Add support for excluding schemas, tables, tags, etc to help refine which notifications get sent to each channel - for example, send notifications for all tables in a schema that do not have a in_dev:true tag

Improvements and fixes

  • Field Health and Dimension Tracking Monitor Suggestions: Released 2 new insights reports that provide recommendations on which tables and fields to apply both FH and DT custom monitors on based on importance and similarity to previously configured monitors
  • Anomaly detection model improvements: Released a set of changes to improve recall and precision of notifications to further reduce false positives
  • Improved SQL editor UX: When editing SQL for SQL rules, users can now expand the editable space to support bigger queries and format them easier

What's next

  • Spark lineage: For our Spark customers, we're working on launching lineage which will allow you to map how queries interact to form lineage
  • Circuit Breakers: Trigger Monte Carlo data quality checks and validate incidents with code to stop problematic jobs before they pass data downstream