Advanced Monitors now fully support MySQL and Oracle, enabling customers to leverage Data Profiler and Monitoring Agent recommendations, as well as deploy metric, validation, and comparison monitors on their MySQL and Oracle assets.
MC can now observe Clickhouse! The MC-Clickhouse integration currently supports flexible custom SQL monitors and schema change detections. More capabilities will be added over time.
Docs: https://docs.getmontecarlo.com/docs/clickhouse#/
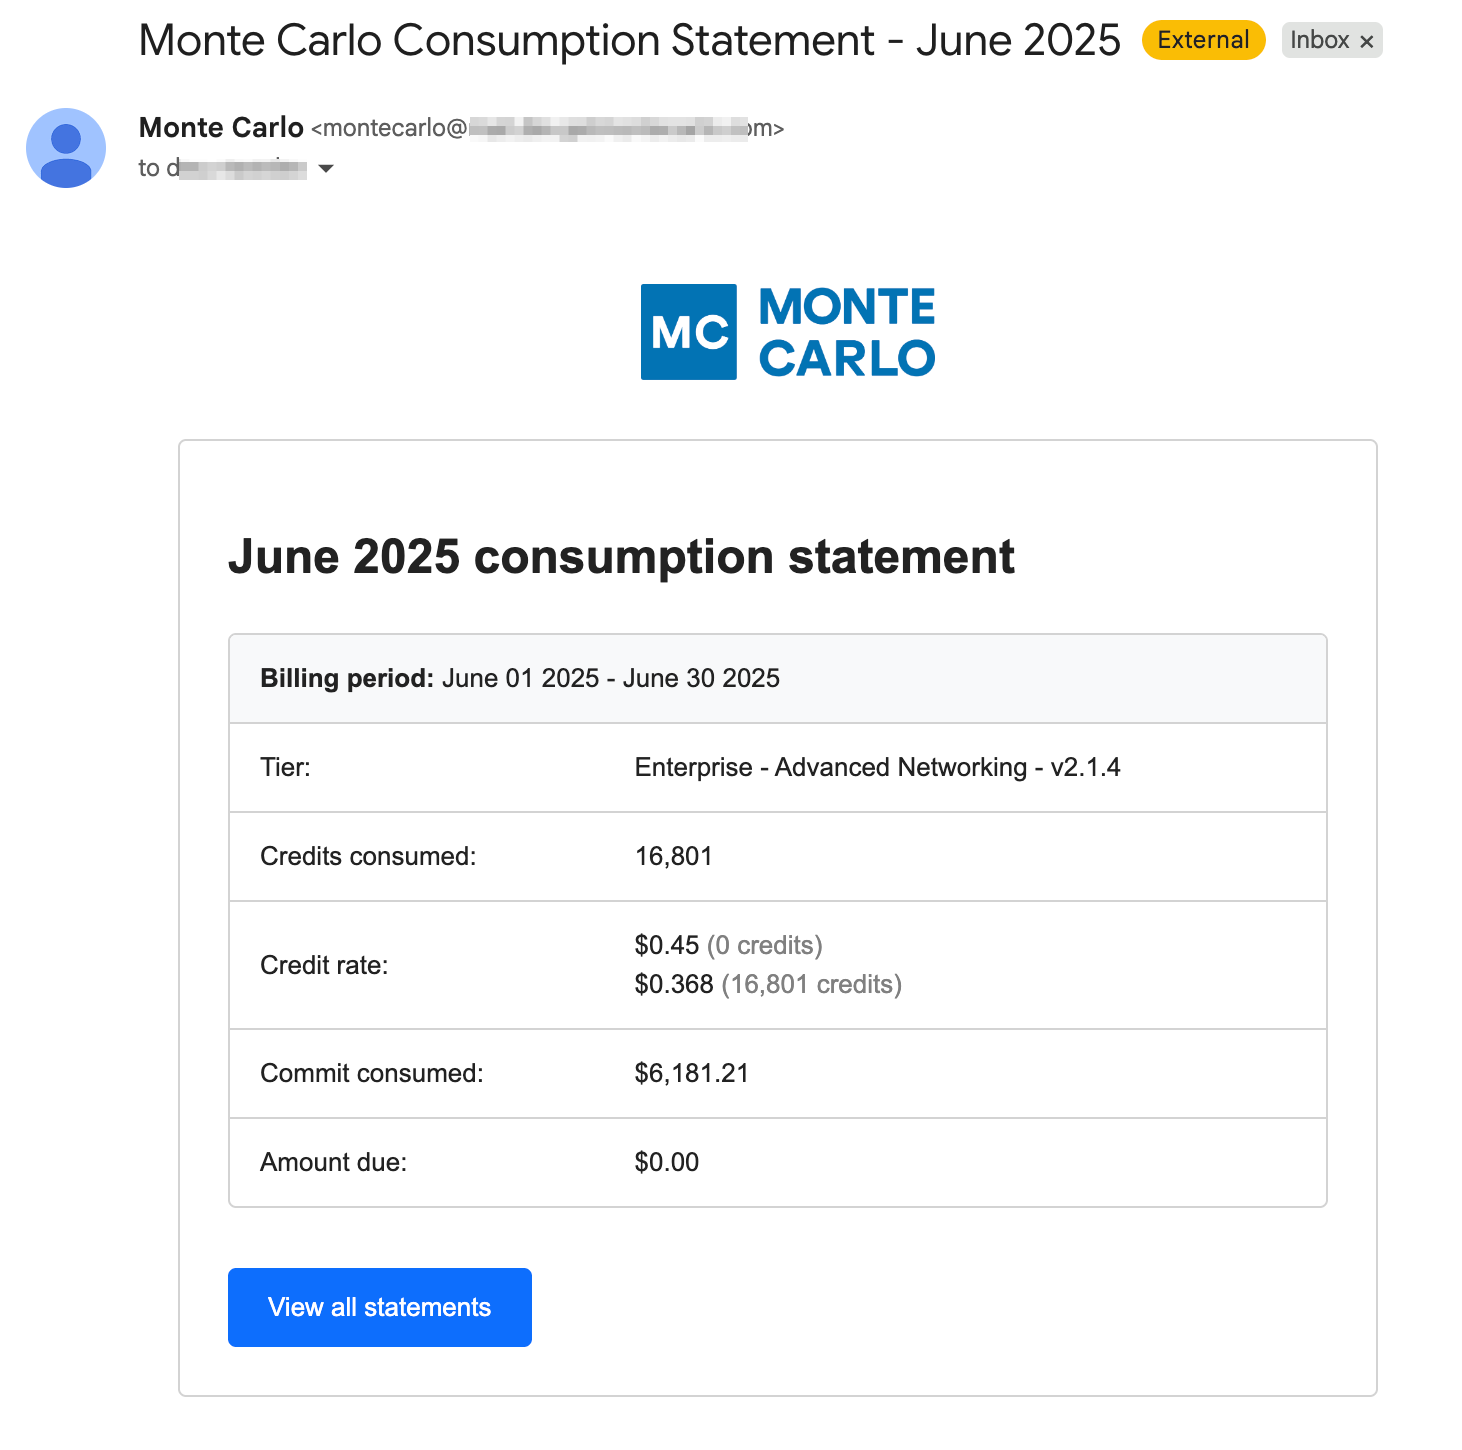
For customers on consumption pricing plans, Monte Carlo now sends an email summary of consumption once per month to all Account Owners. It includes detail from the previous month about credits consumed, credit rate ($), commit consumed ($), and amount due ($). This email is typically sent around the 5th of the month, but may be received off-cycle as well if you undergo a change in pricing plan.

It is possible to customize the recipient list of this email by clicking the Email statements button in the Current running statement section.

Monte Carlo now supports Salesforce CRM database! Current capabilities include SQOL rule monitor and schema change detection. More monitoring capabilities will be added over time.
More details and setup instruction here https://docs.getmontecarlo.com/docs/salesforce-crm
Salesforce Data Cloud is the widely adopted customer 360 data platform in Salesforce, which unifies data from various sources including data warehouses/lakes.
MC now supports SQL rule monitor and schema change detection for Salesforce Data Cloud. More capabilities like comparison monitor and metrics monitor will be added soon.
Follow docs here to set up the integration https://docs.getmontecarlo.com/docs/salesforce-data-cloud
For many of our customers who use SQL rules for data quality, getting a full list of all rows violating the rule is critical, as internal teams need to follow up on each and every one of them. When SQL rules were launched, we limited the number of rows to 500 per alert in order to constrain scale/complexity. This has just gotten a lot better! Users now have access to up to 5,000 rows when a SQL rule alerts.
Please note: requires reaching out to our support team to raise account level limits. The default remains 500 rows per alert.
For customers that use Redshift data sharing for sharing data between producer and consumer clusters, MC can now support lineage between such clusters and allow custom monitoring on each.
See docs here for more details
We have previously announced that Insights are being deprecated on July 1. In the next 24 hours, this feature will no longer be available. You can read more about that announcement here.
Insights are replaced by Exports, which make critical Monte Carlo objects—Monitors, Alerts, Events, and Assets—exportable in clean, consistent formats. By making this well-modeled data available, customers can build better and more reliable analytics than they could before.

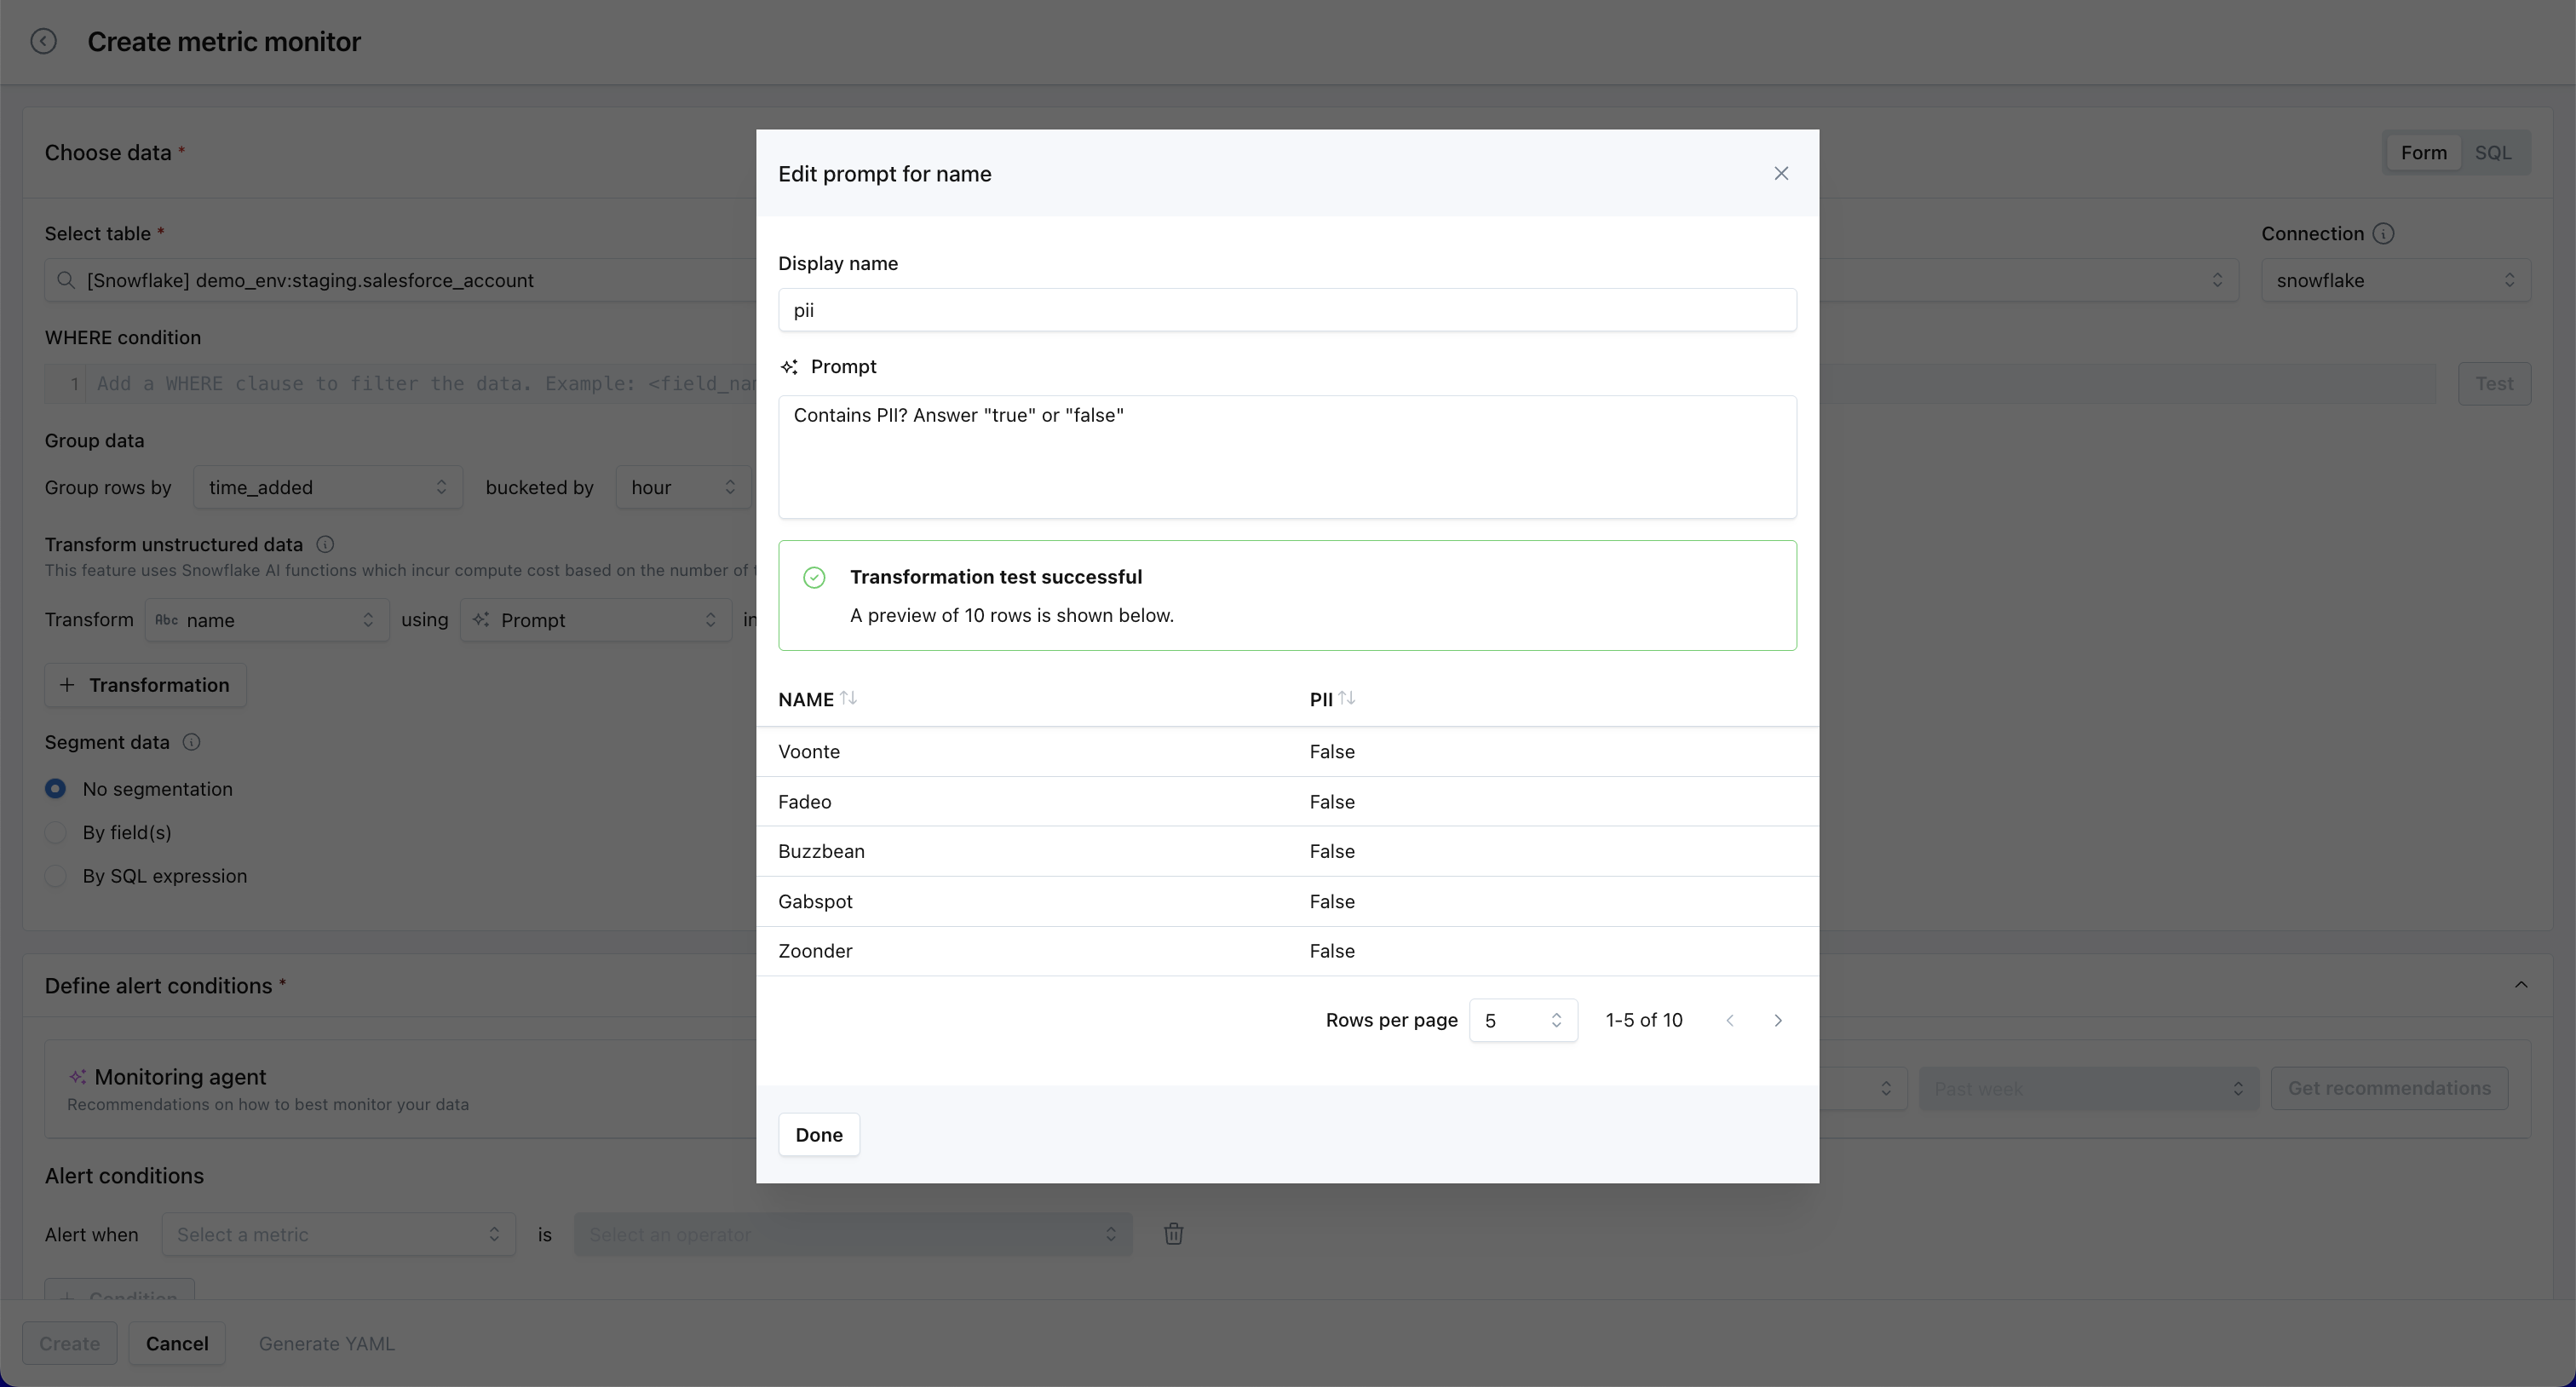
Monte Carlo now supports unstructured data monitoring in metric monitors, enabling data and AI teams to apply LLM-powered transformations—such as sentiment analysis, classification, and custom prompts—to text columns from Snowflake and Databricks. Transformed columns can be used in alert conditions and to segment data—no SQL required. Built-in guardrails ensure performance and cost-efficiency at scale. This unlocks observability for LLM and RAG pipelines, allowing users to monitor things like tone drift in generated output, hallucination-prone responses, or consistency between input context and generated text.
Historically, if you were logging into Monte Carlo for the very first time, we did not offer much in-product onboarding. This was a jarring way to experience the product for the first time.
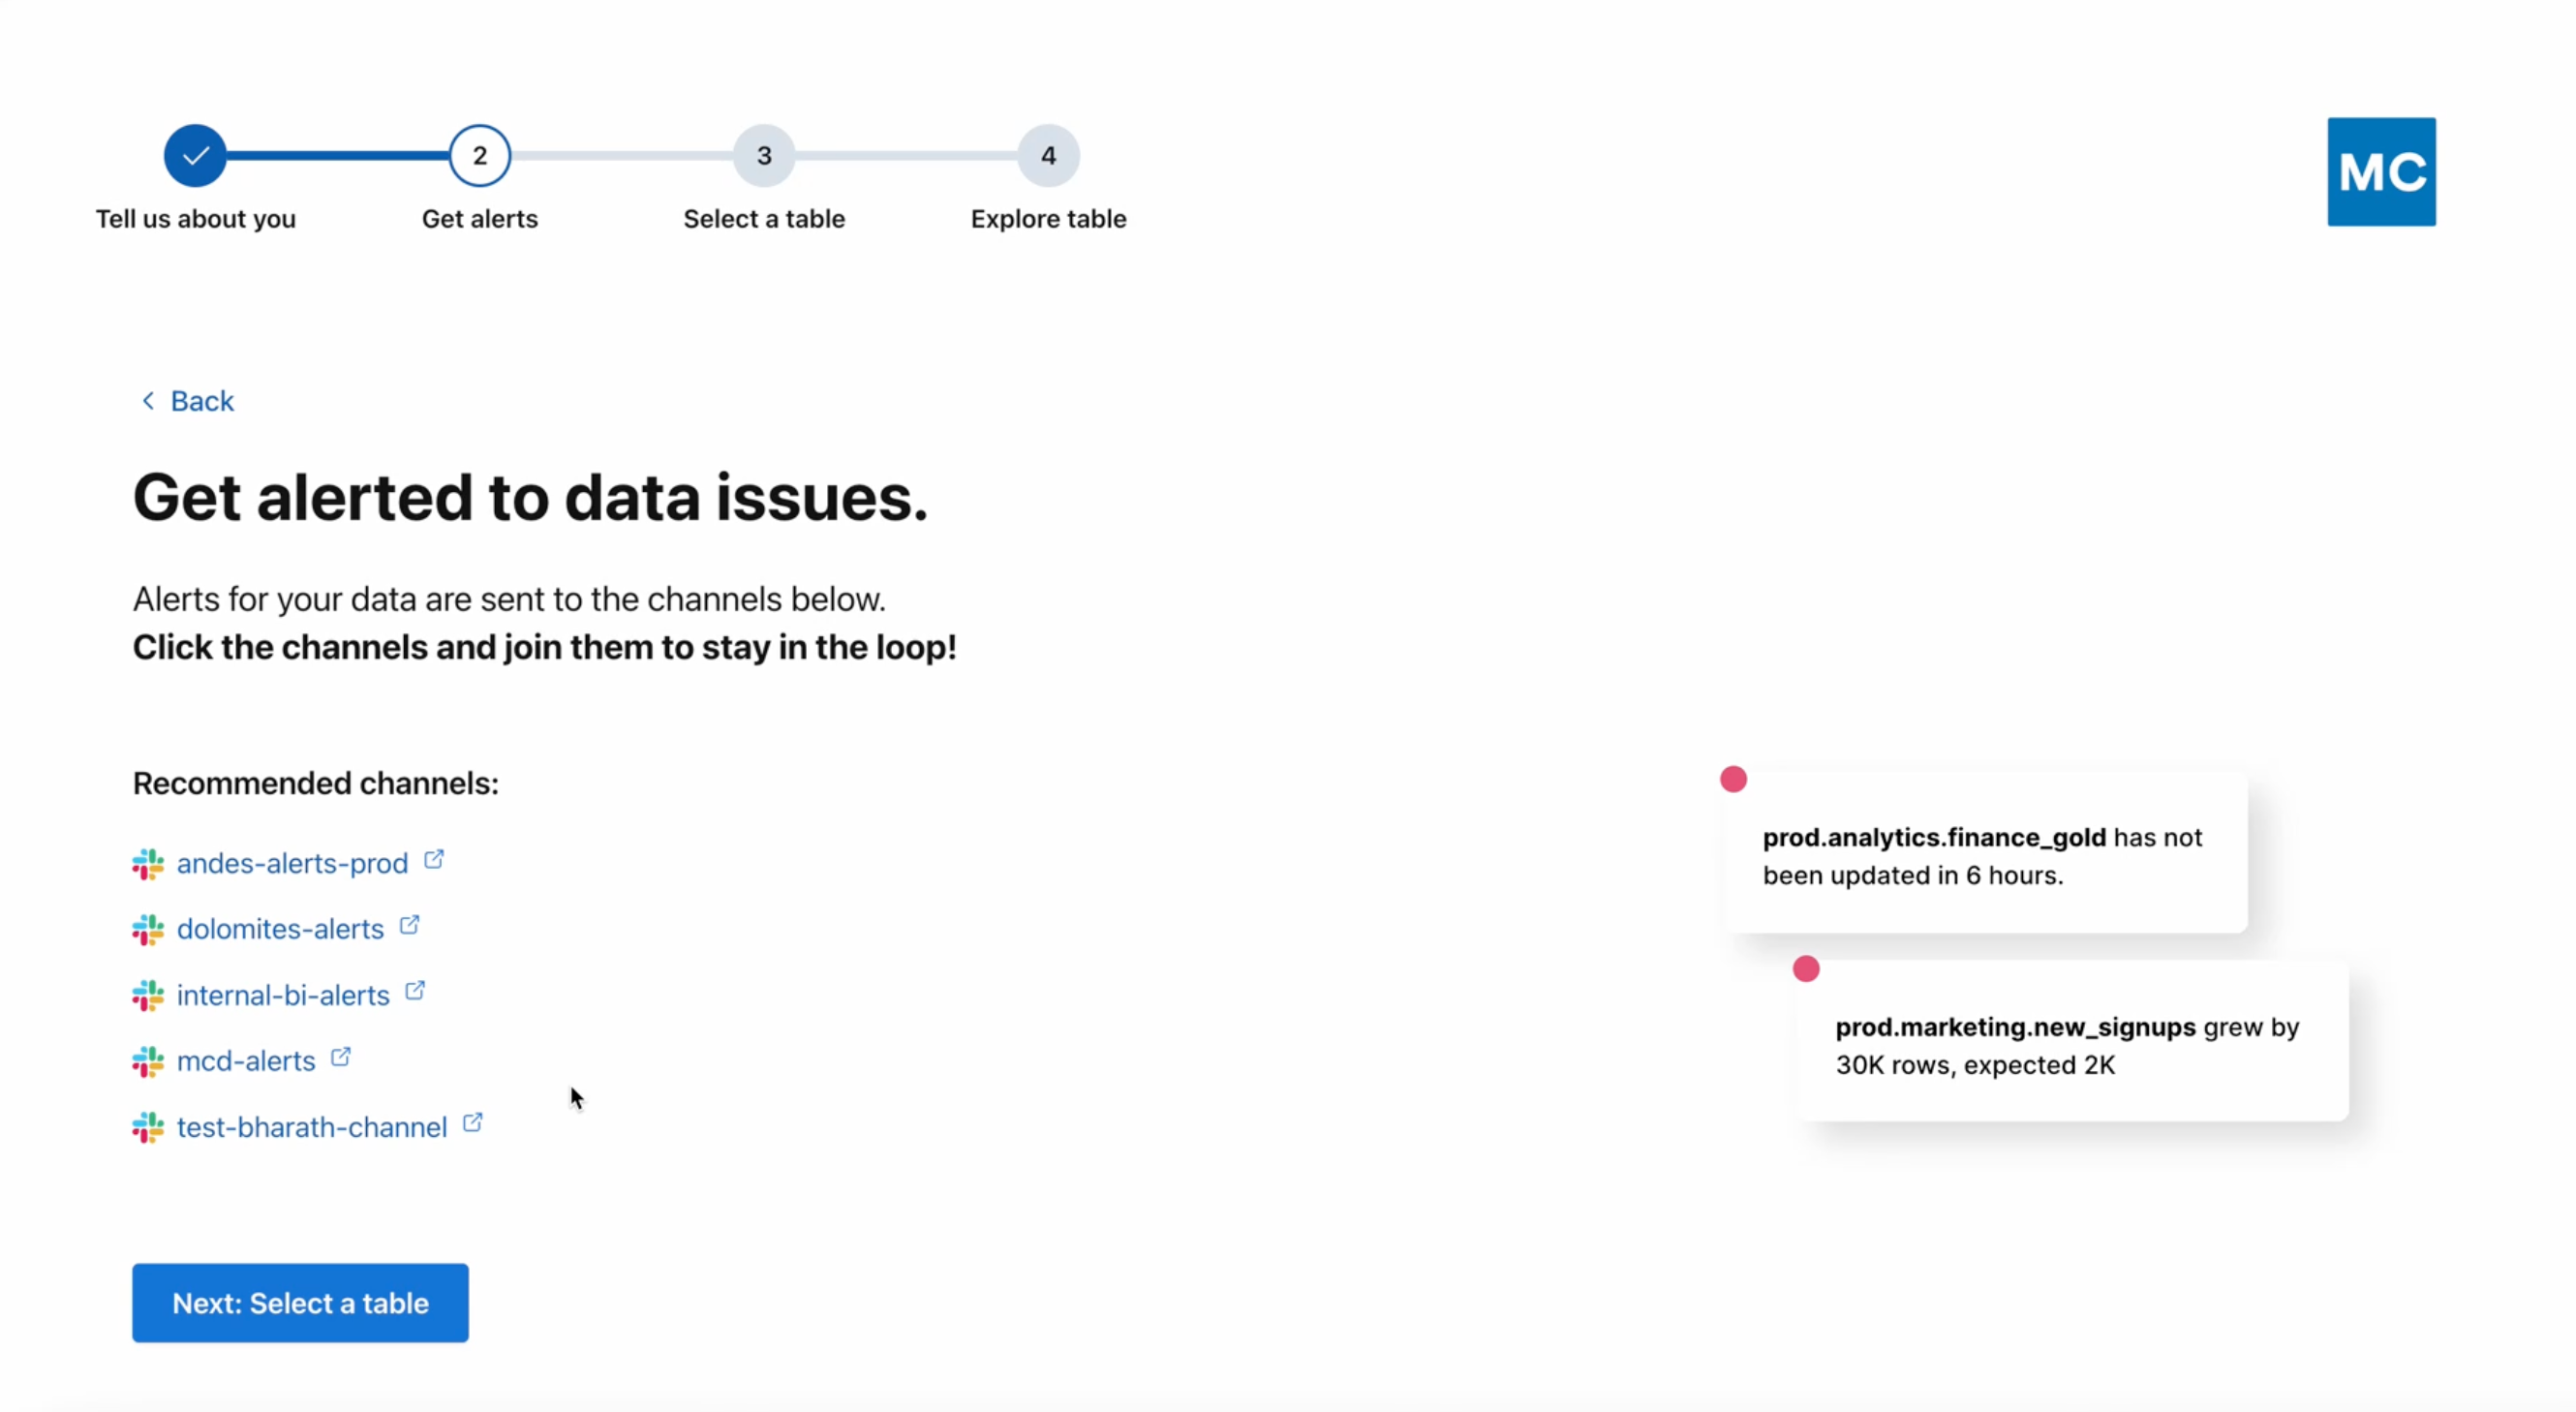
We're now sending new users through a more opinionated, in-app onboarding flow. It's designed to:
- Encourage users to join channels (Slack, Teams, etc) where alerts from that account are already being sent.
- Guide them to common actions for a table they care about, such as seeing recent alerts, viewing lineage, or creating a monitor.
(1) is one of the most effective things we've found to drive user retention, and (2) reflects the most common actions we saw successful users taking in their first session.
Our intention is to help more users satisfy their intent in their first visit into Monte Carlo, and create healthy habits that ensure they continue to see value.

One of four steps in the onboarding flow shown to new users when logging into Monte Carlo for the first time. This one encourages they join channels (Slack, Teams, etc) where alerts are already being sent.
