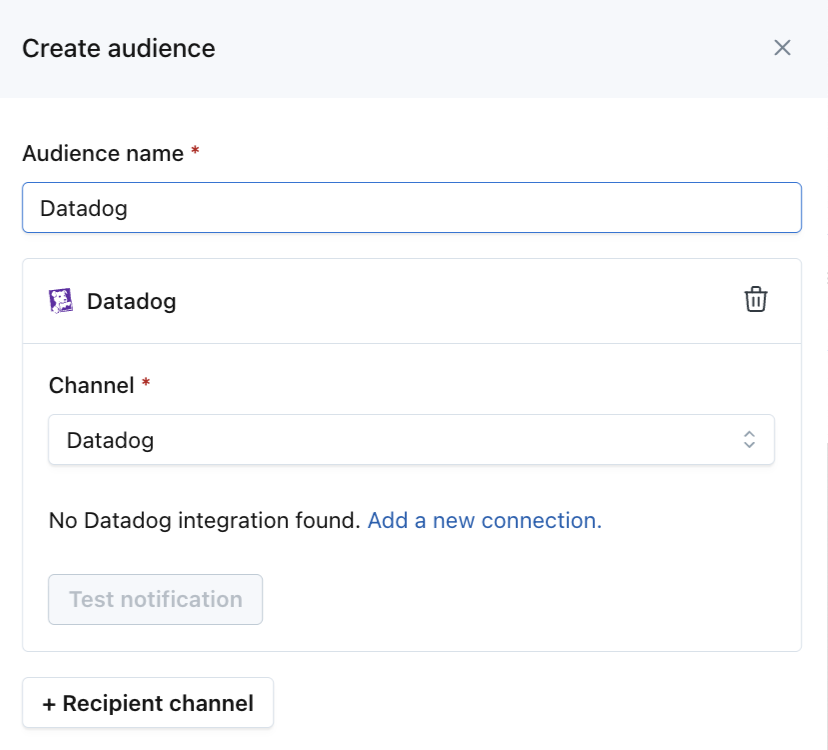
You can now connect Monte Carlo to Datadog Incident Management. Create or link incidents directly from alerts, sync status and ownership automatically, and add Datadog as a notification channel.

You can now connect Monte Carlo to Datadog Incident Management. Create or link incidents directly from alerts, sync status and ownership automatically, and add Datadog as a notification channel.
We've released much better support for "Chargebacks", a common need in enterprises who wish to attribute consumption & cost back to the appropriate lines of business. Detailed documentation is available here.
Specifically, we have shipped a new Consumption data export which details consumption by monitor for the last 30 days. This can be easily joined to the Monitors data export using monitor_id, which allows enterprises to trace credit consumption back to particular creators, domains, audiences, etc. Different enterprises have different processes for how they manage and trace chargebacks, so this flexibility is important.
This is only available for customers that meet BOTH of the following conditions:
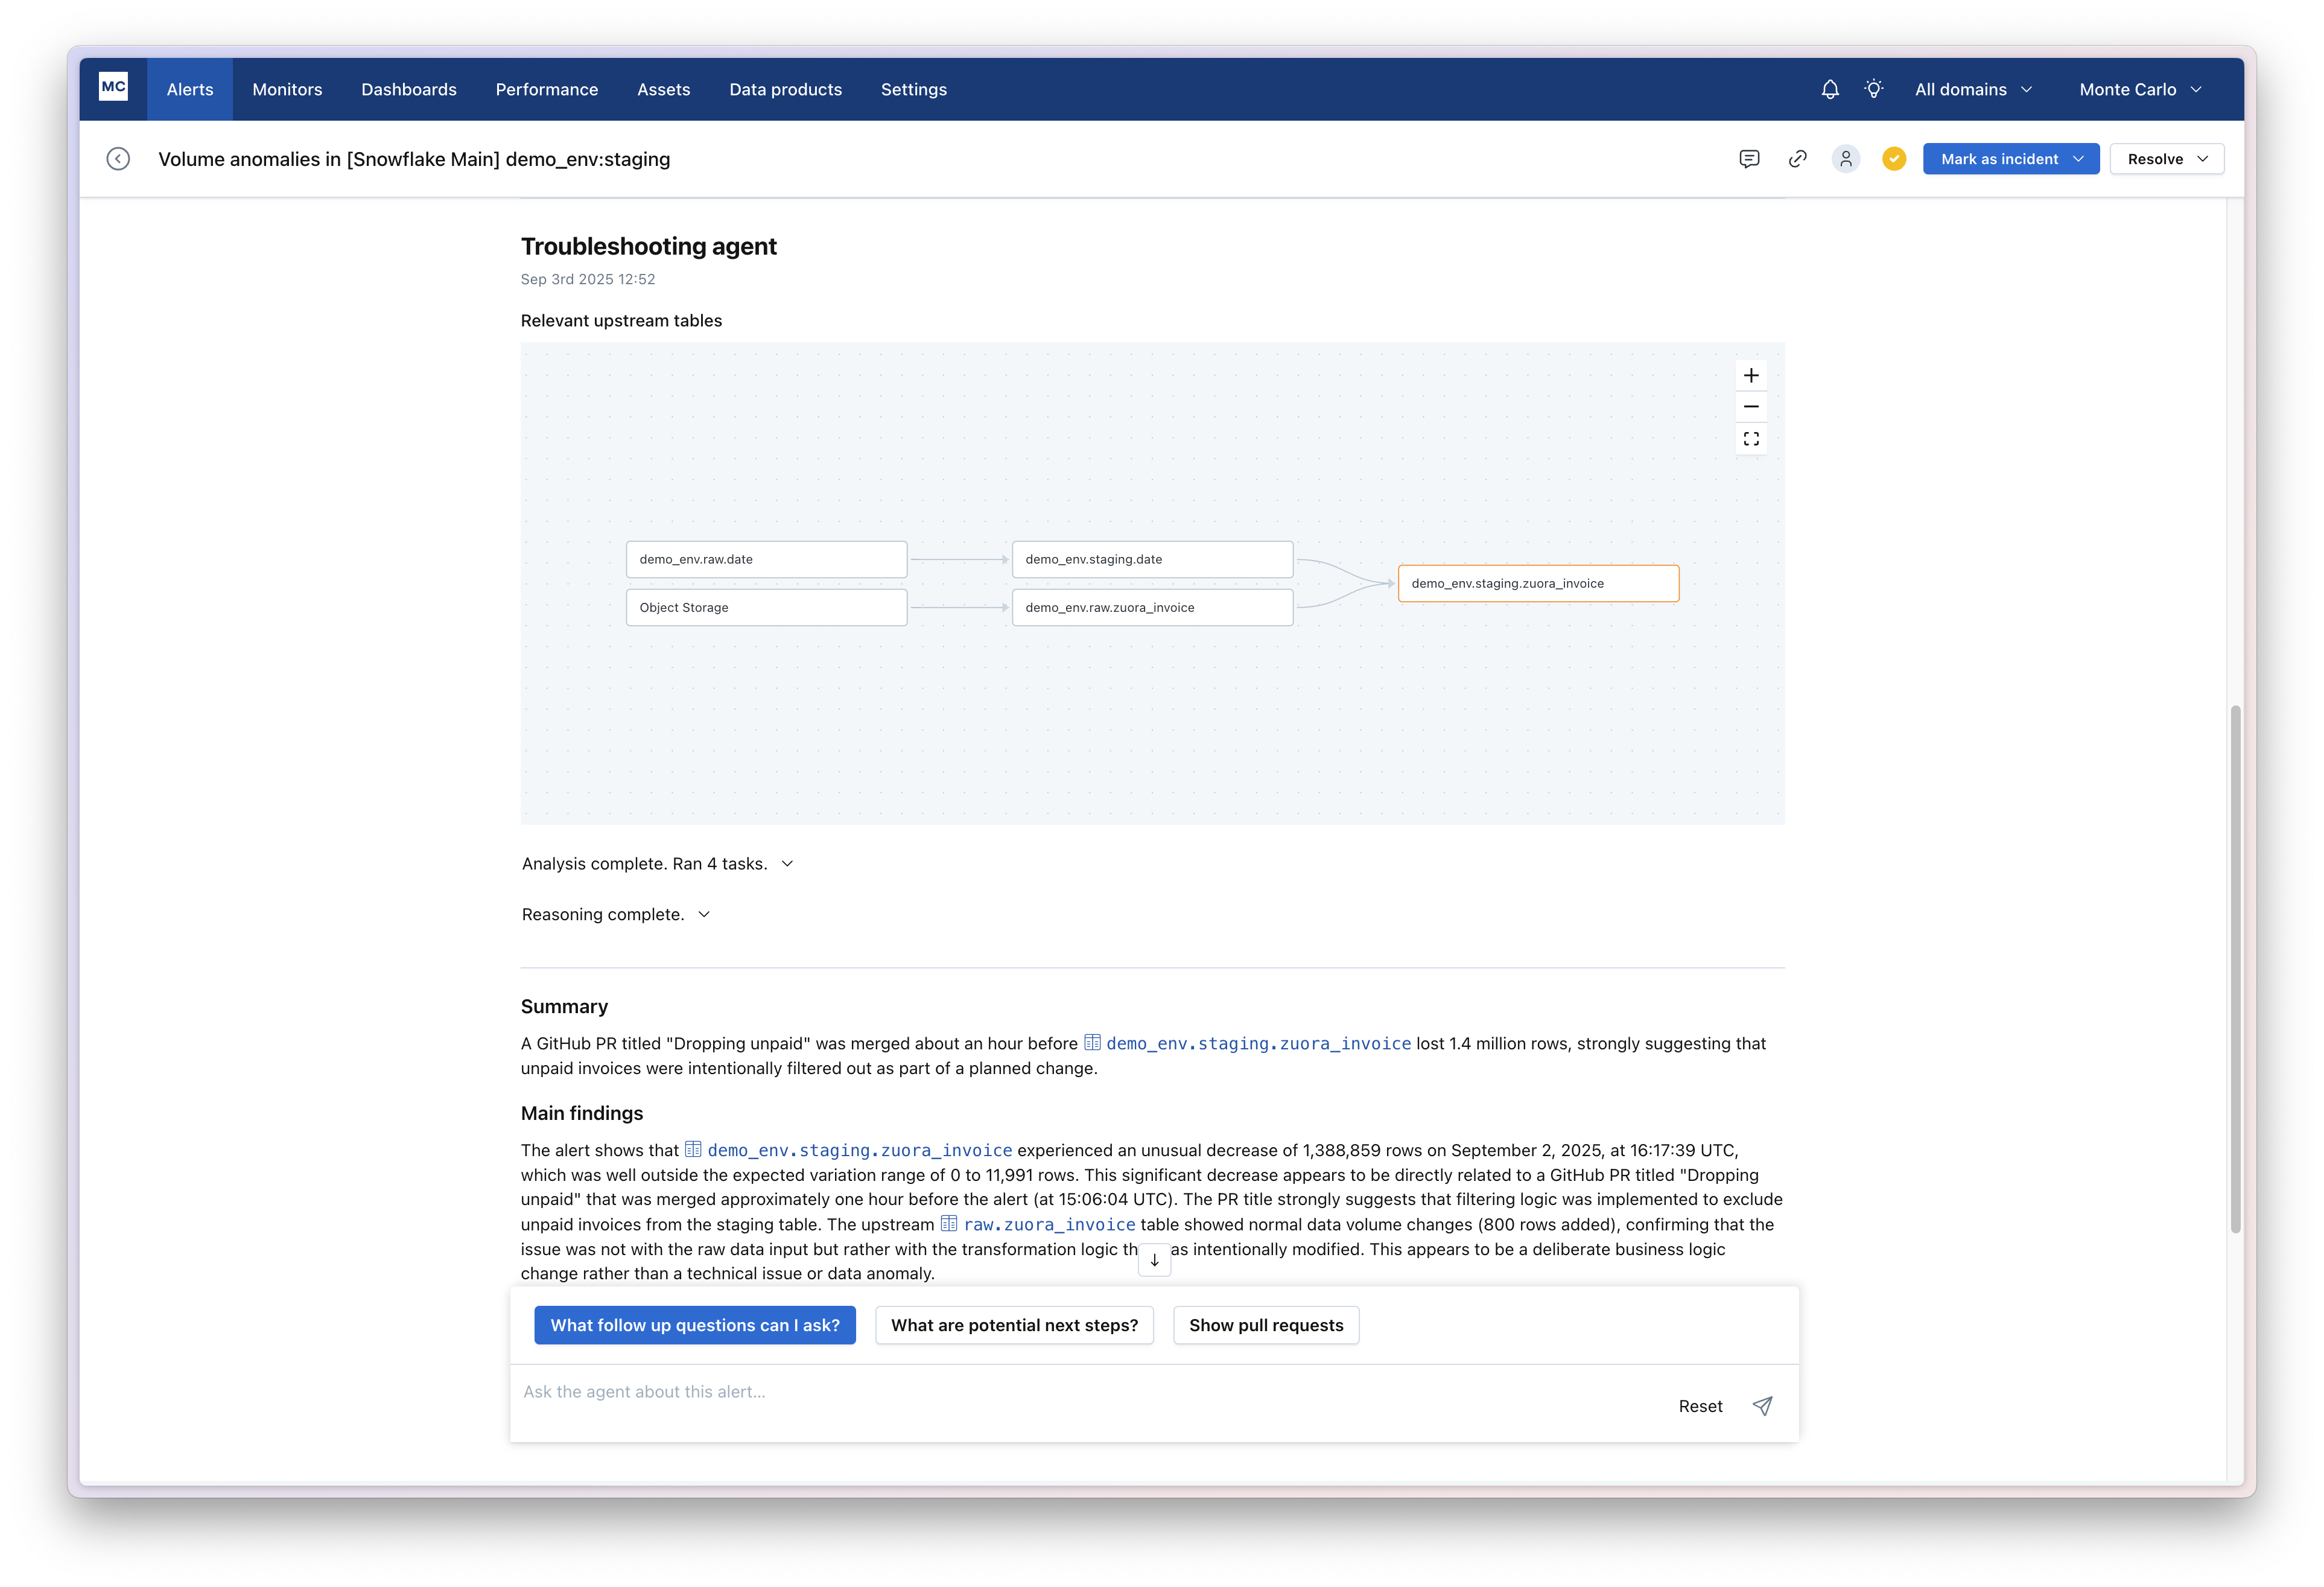
When receiving an alert from Monte Carlo, the troubleshooting agent can automatically work through 100s of hypothesis and highlight the ones that are most likely to have caused the issue. It will consider changes in the data, system issues (e.g. Airflow or dbt failures) apd code changes when analyzing an alert, and will automatically traverse lineage to identify the root cause.
Learn more in the Troubleshooting agent documentation.
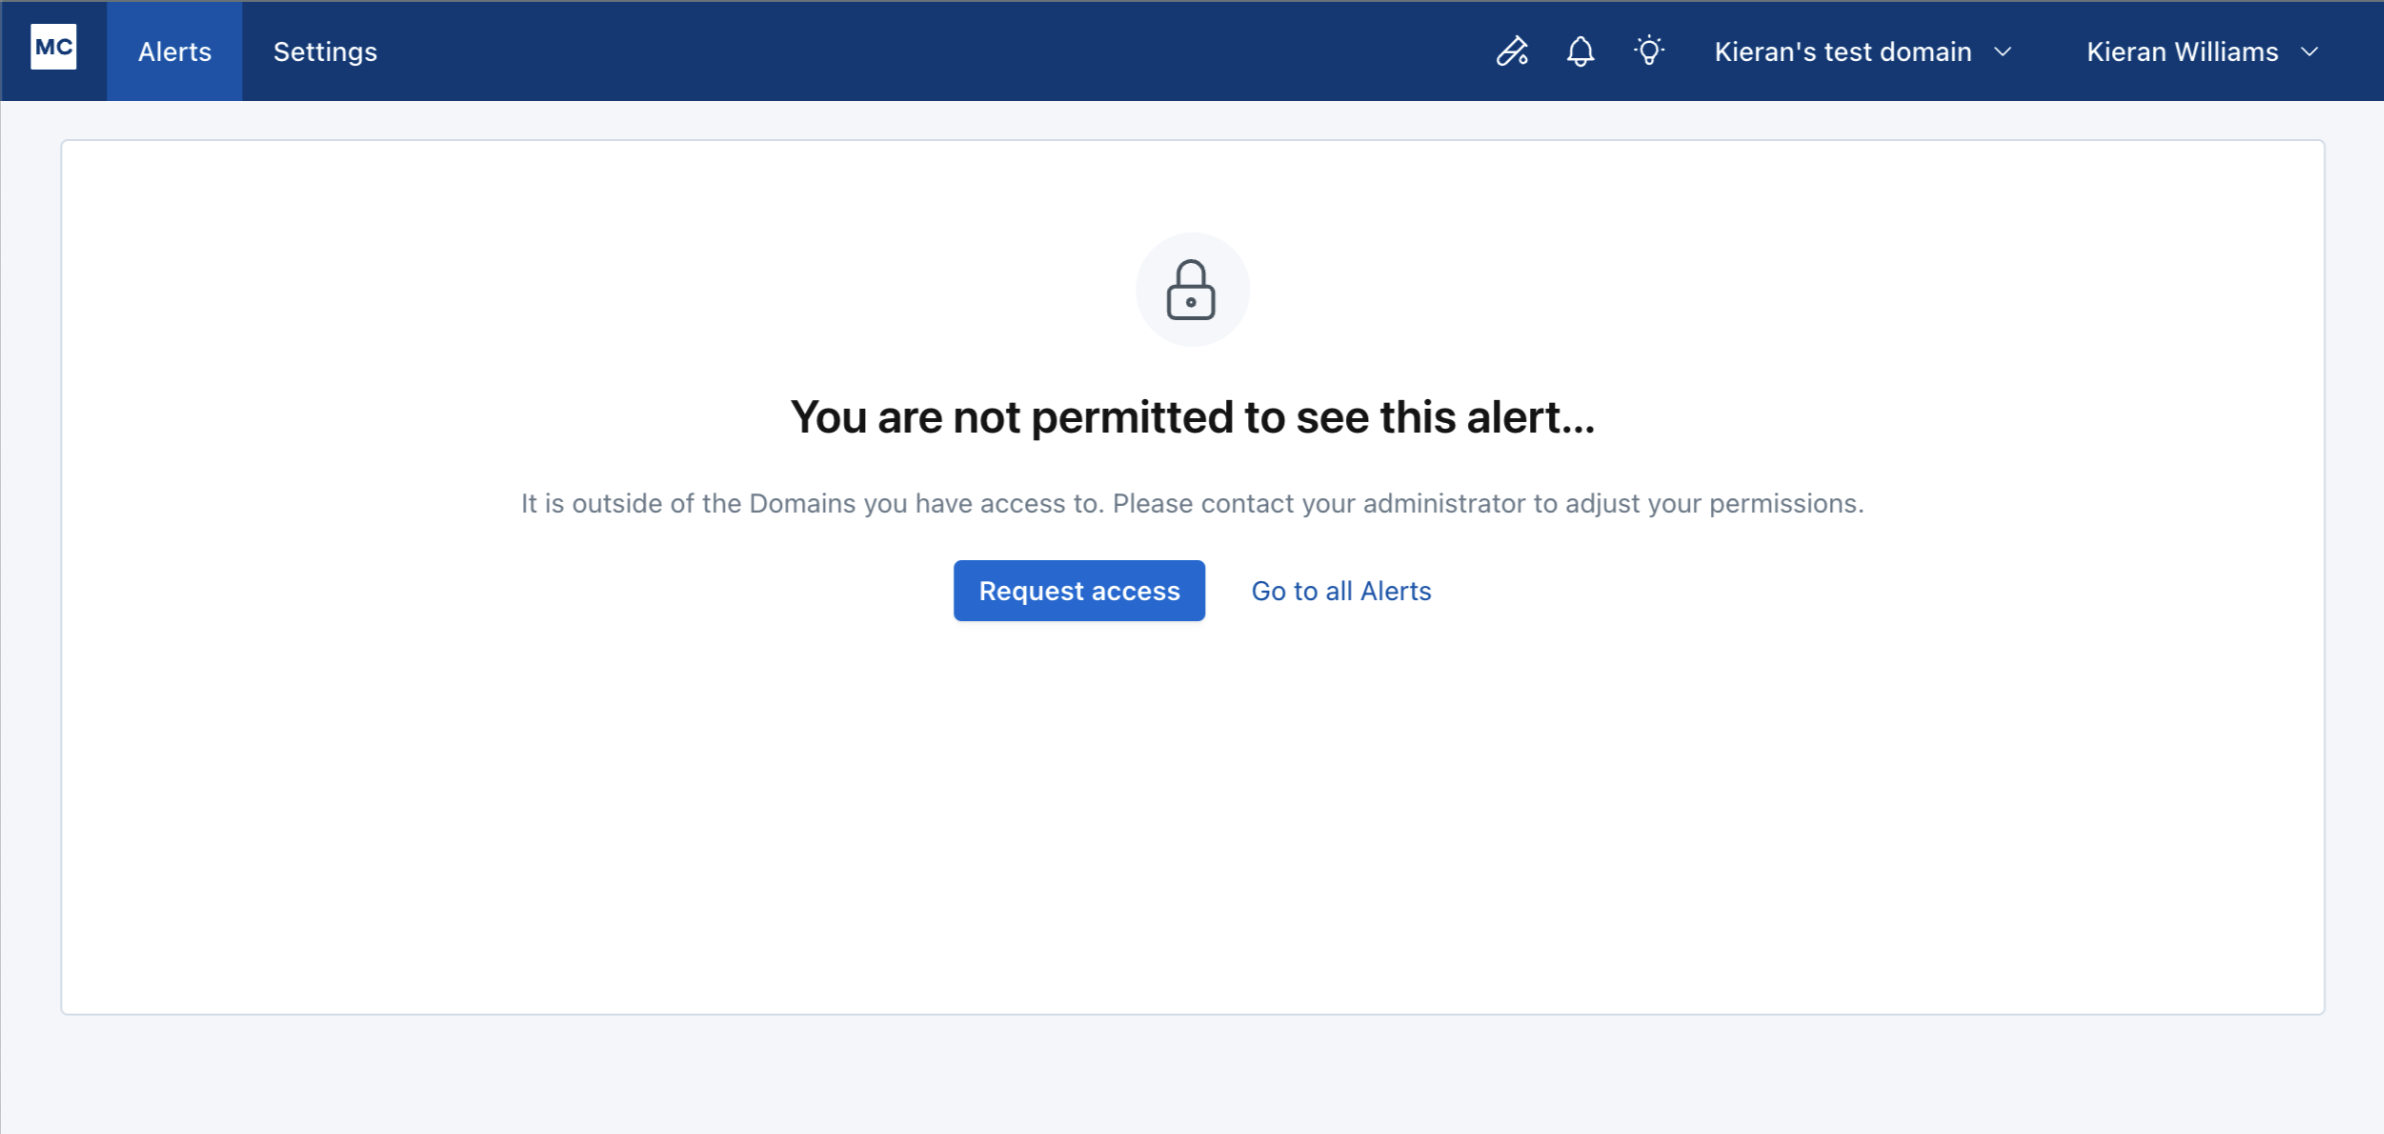
When a user tries to open an alert they don’t have permission to view, Monte Carlo now provides a clear path forward with an Access Request option. Here’s how it works:
We hope to streamline the process of getting unblocked, both by giving users a clear way to request access and by reducing the back-and-forth in organizations where it isn’t obvious who to contact. At the same time, access decisions remain fully in the hands of admins, ensuring the right level of control.
Advanced Monitors now fully support SAP HANA, enabling users to leverage Data Profiler and Monitoring Agent recommendations, as well as deploy metric, validation, and comparison monitors on their SAP HANA assets.
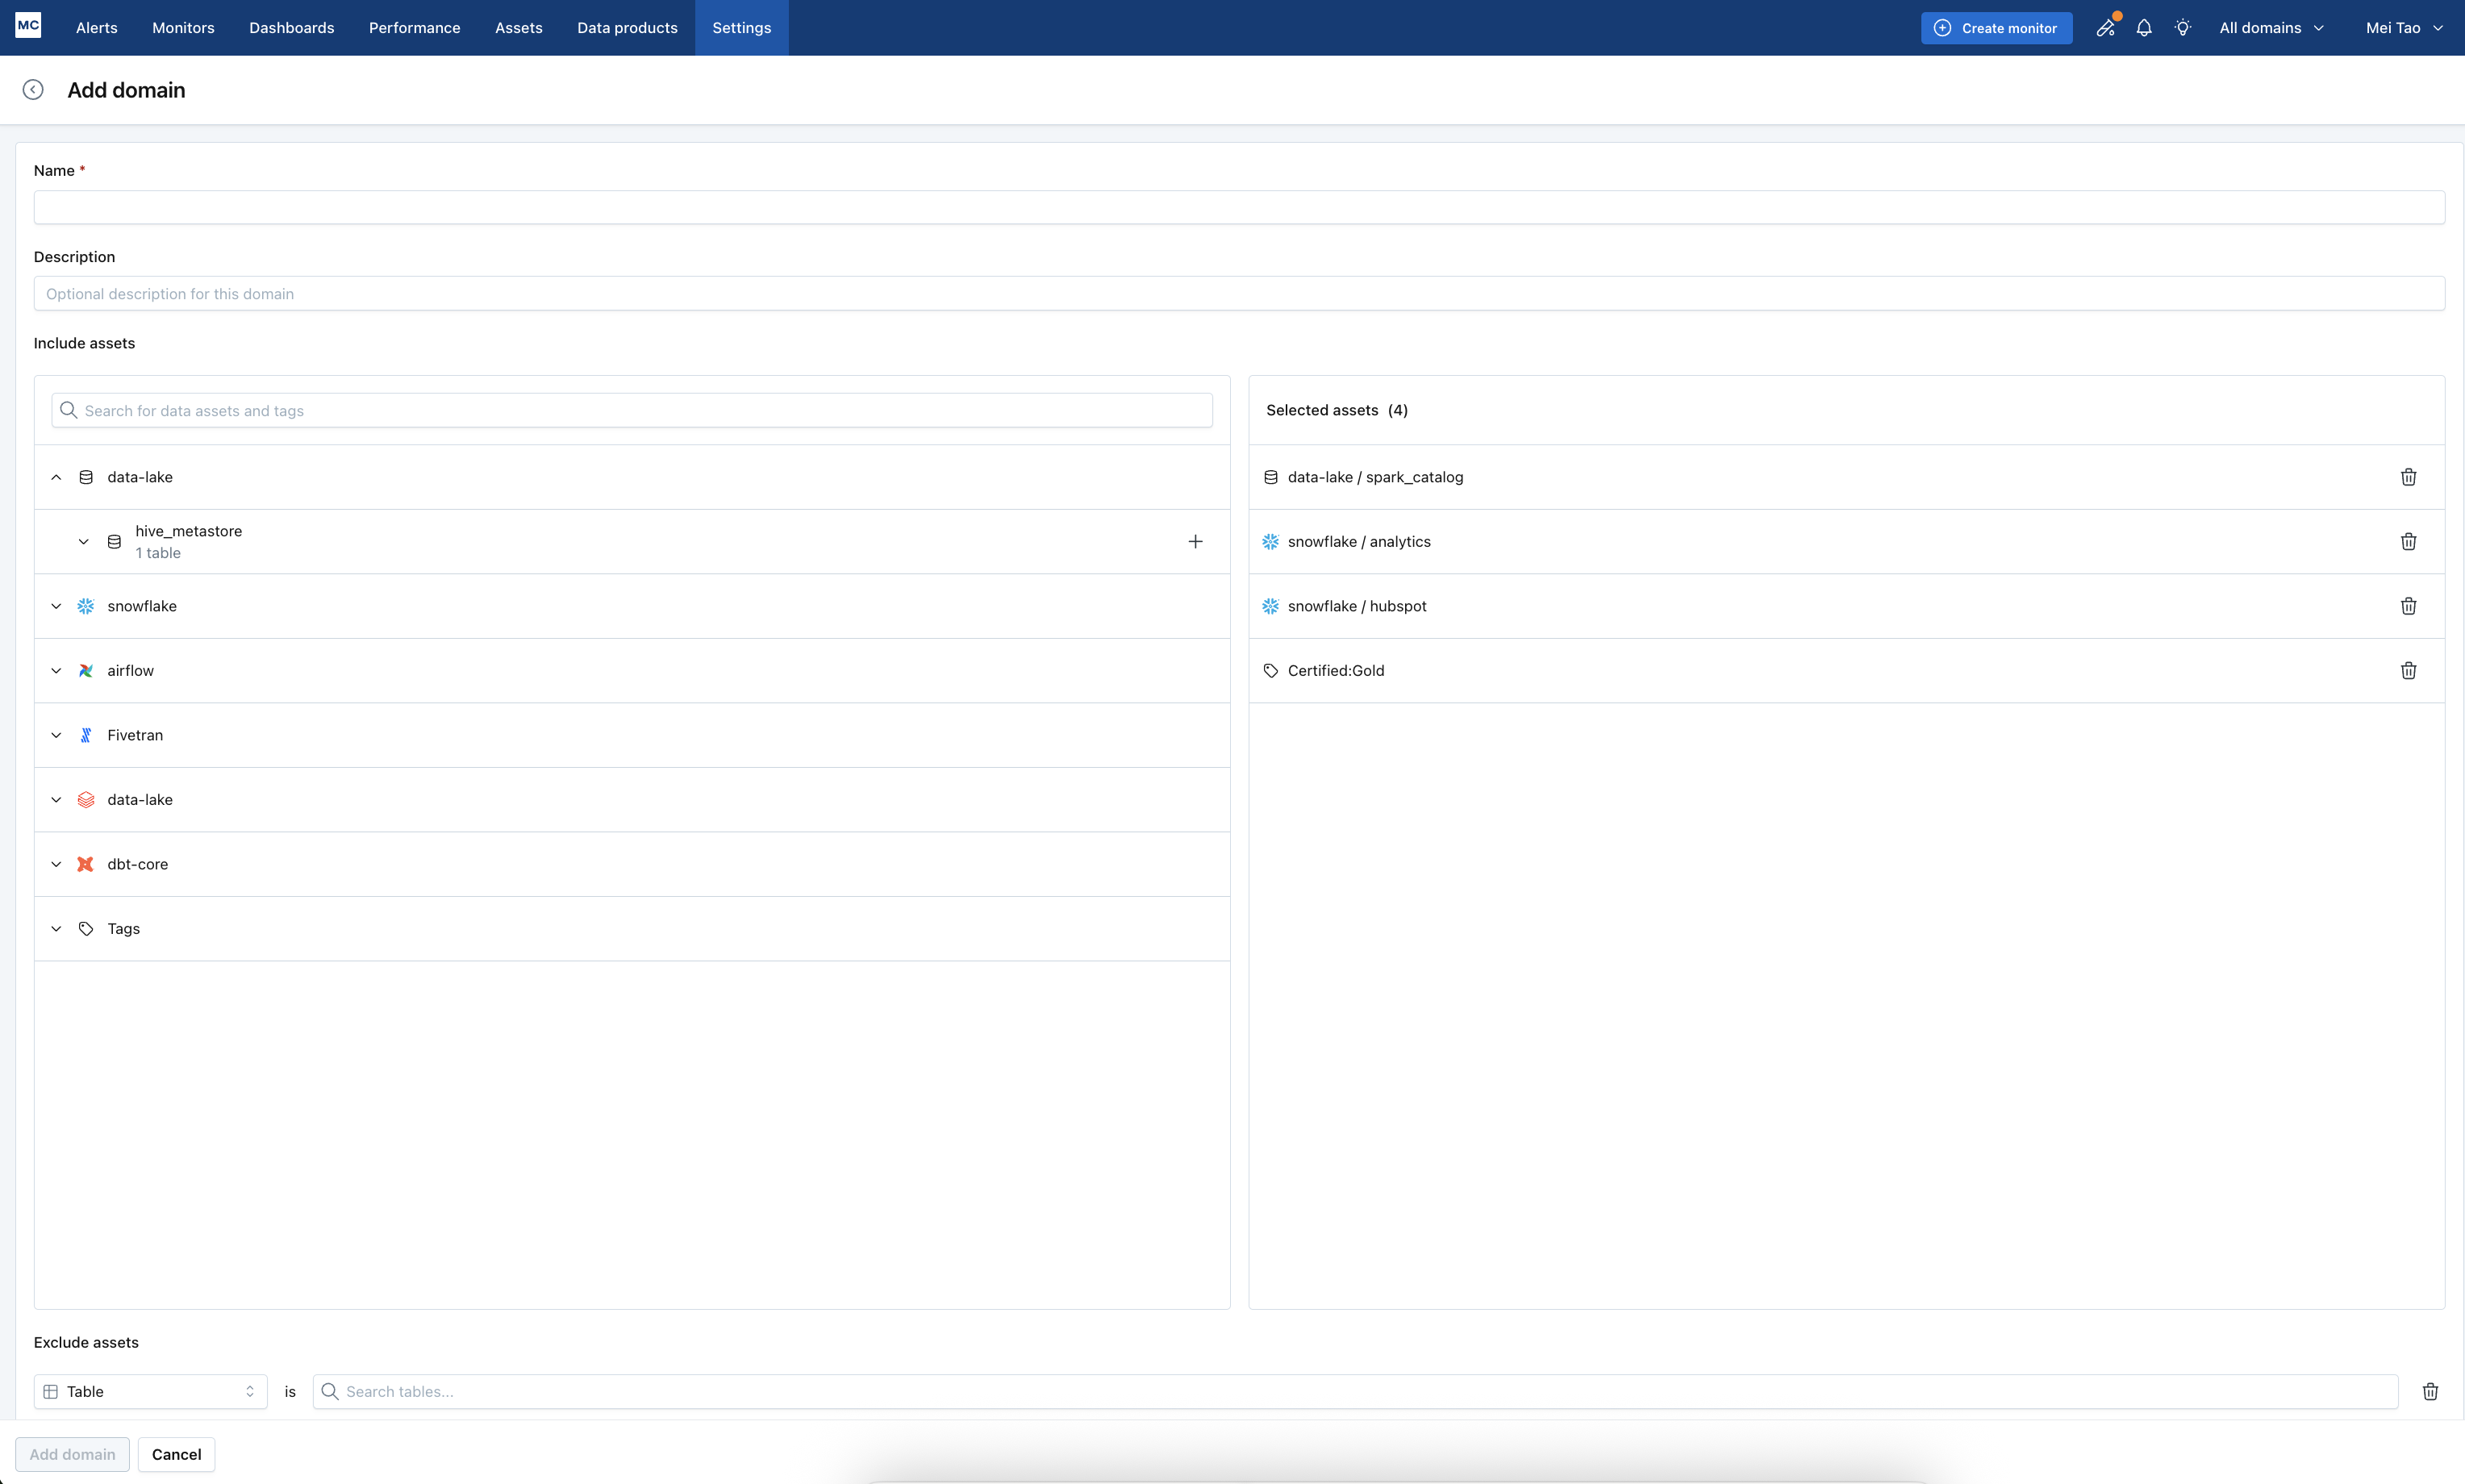
MC shipped a series of improvements to the domains creation experience -
We're launching a brand new concept for our alert pages, across all alert types. This is a complete makeover of the page that improves clarity, usability and overall user experience. Some of the highlights of the new page include:
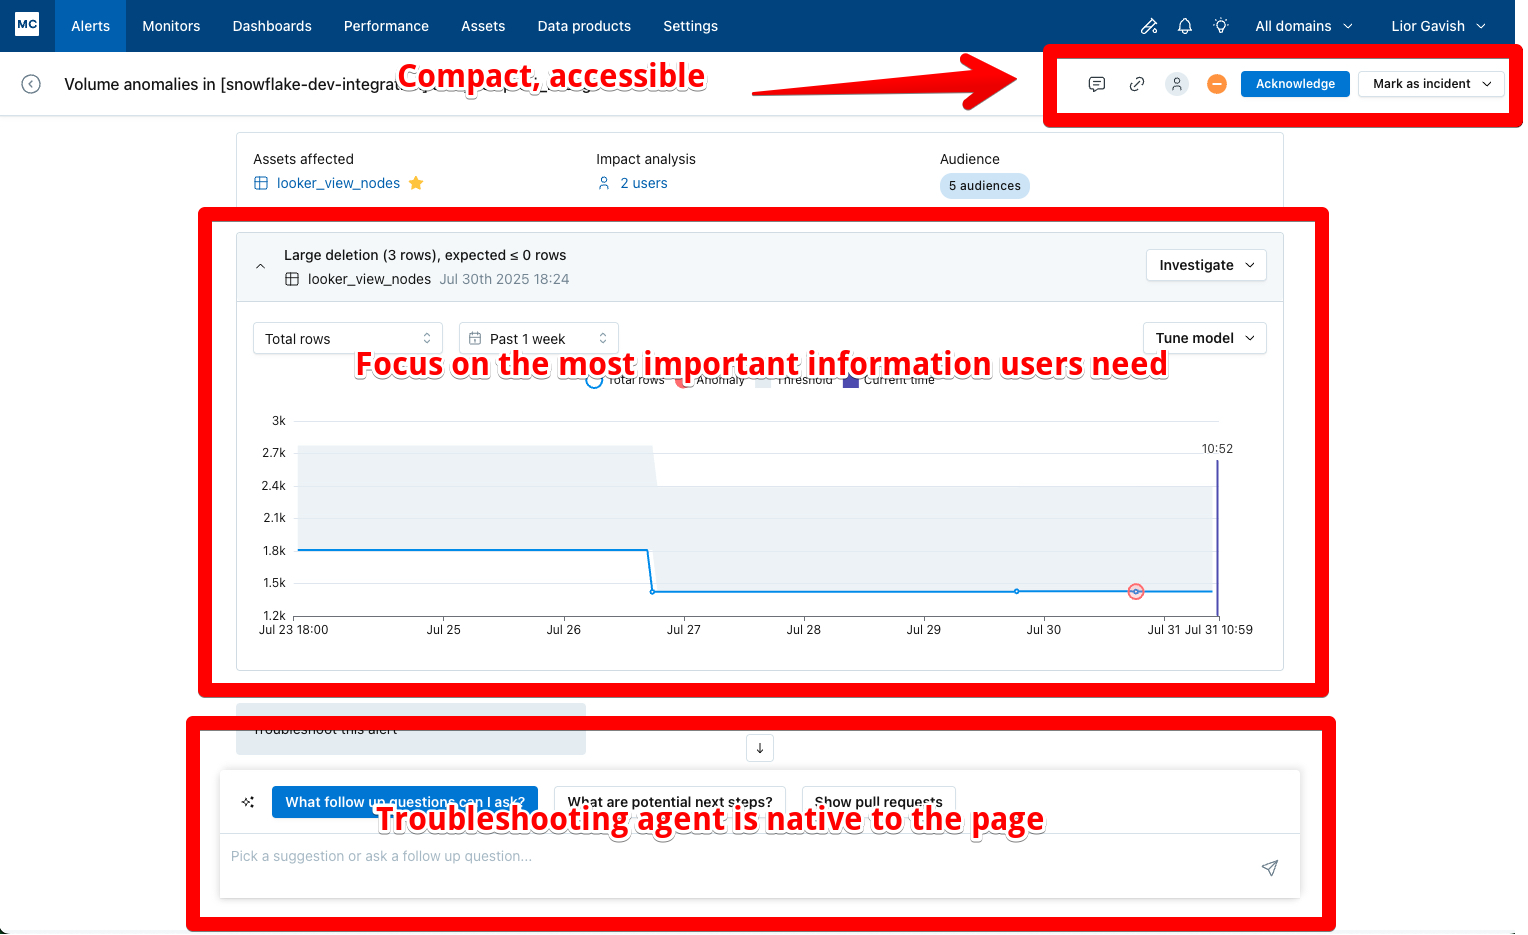
Our new alert page
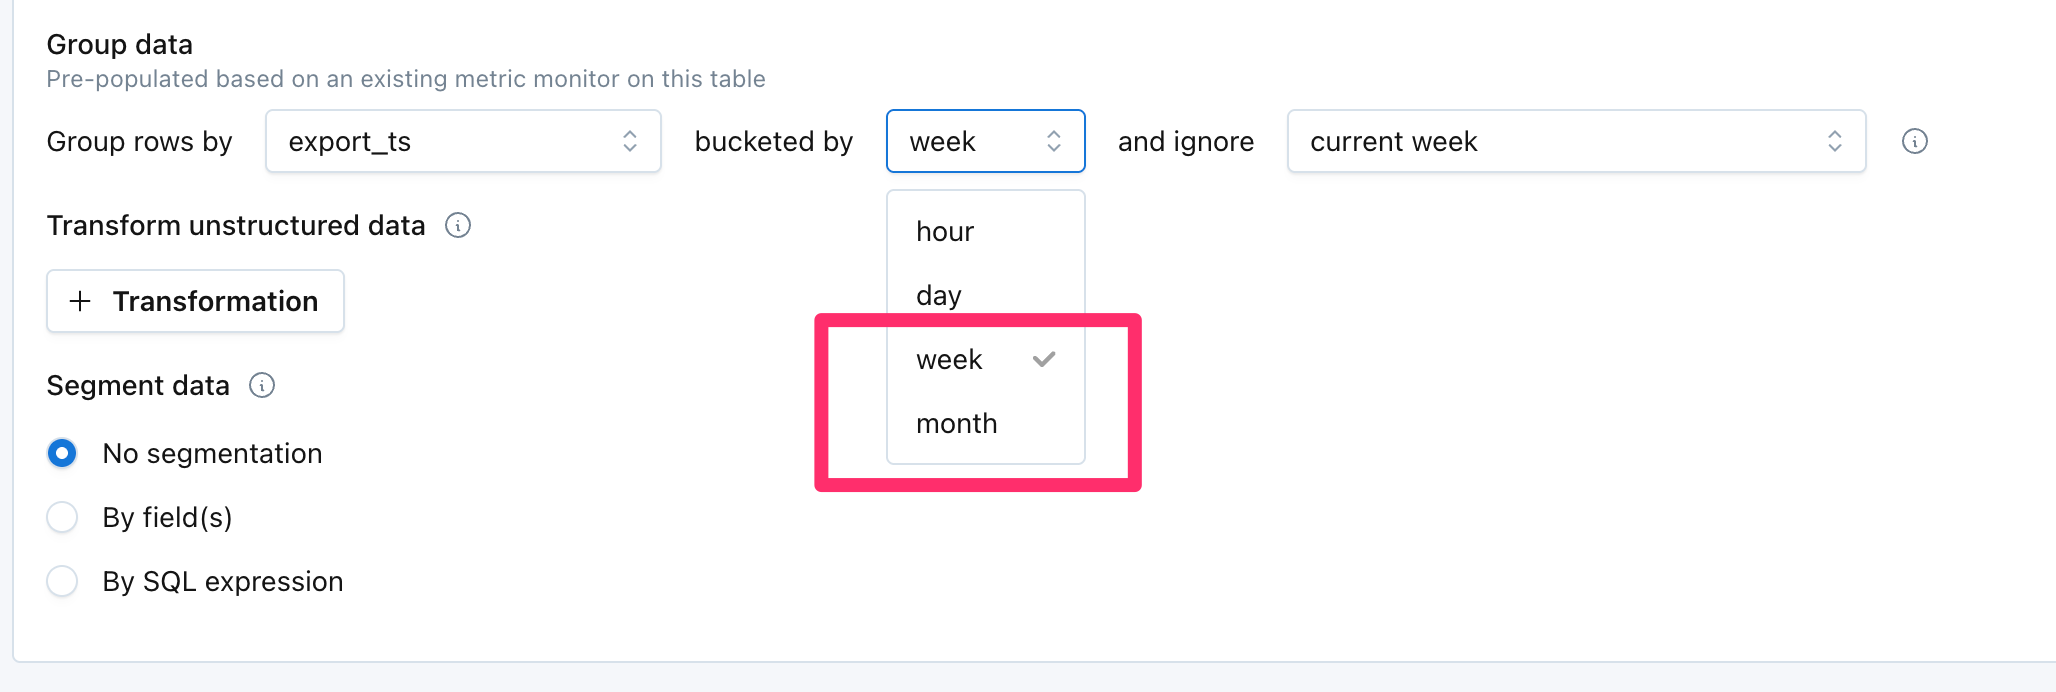
Historically, Metric Monitors supported bucketing data by hour and by day. We now also support bucketing by week and month, making it much easier to monitor sparse or infrequently updated data. For example, if a financial institution wants to do anomaly detection on data they get from an external partner once/month, that is now much easier to do than before.
In addition, when bucketing by week or month, the monitor now backfills much more historical data than before in order to understand seasonal trends. Up to 3 years of history is backfilled when bucketing by week, and up to 10 years when bucketing by month.
For customers with many warehouse integrations, in SQL monitors creation view, MC now automatically filter the warehouse list by domain, so users will only see the warehouses mapped to the assets in the domain selected on top.

Warehouse options for a domain with MySQL & Salesforce assets only
3 new types of monitors are now available for the MC-Salesforce Data Cloud integration: metric monitor, validation monitor, comparison monitor.
See details and how to set up here https://docs.getmontecarlo.com/docs/salesforce-data-cloud#/