undefined

We're thrilled to announce field lineage and an early foray into using machine learning to help you determine root cause faster!

What's new

  • Field level lineage: View exactly how fields are used to create relationships across tables and differentiate between direct SELECT field relationships and indirect non-SELECT relationships when fields are used in WHERE, JOIN, etc. clauses (learn more here

Improvements and fixes

  • WHERE clause custom monitor filter validation: For customers that use WHERE clause filters for Field Health and Dimension tracking monitors, you can now test that the WHERE clause works directly from the UI
  • 1st and last measurements for volume graphs: We now show both the 1st and last volume measurements for cases in which an incident was auto-resolved by a follow-on process or job

What's next

  • Spark lineage: For our Spark customers, we're working on launching lineage which will allow you to map how queries interact to form lineage
  • Circuit Breakers: Trigger Monte Carlo data quality checks and validate incidents with code to stop problematic jobs before they pass data downstream

Another exciting week of ships gearing up for some larger product releases on the horizon!

What's new

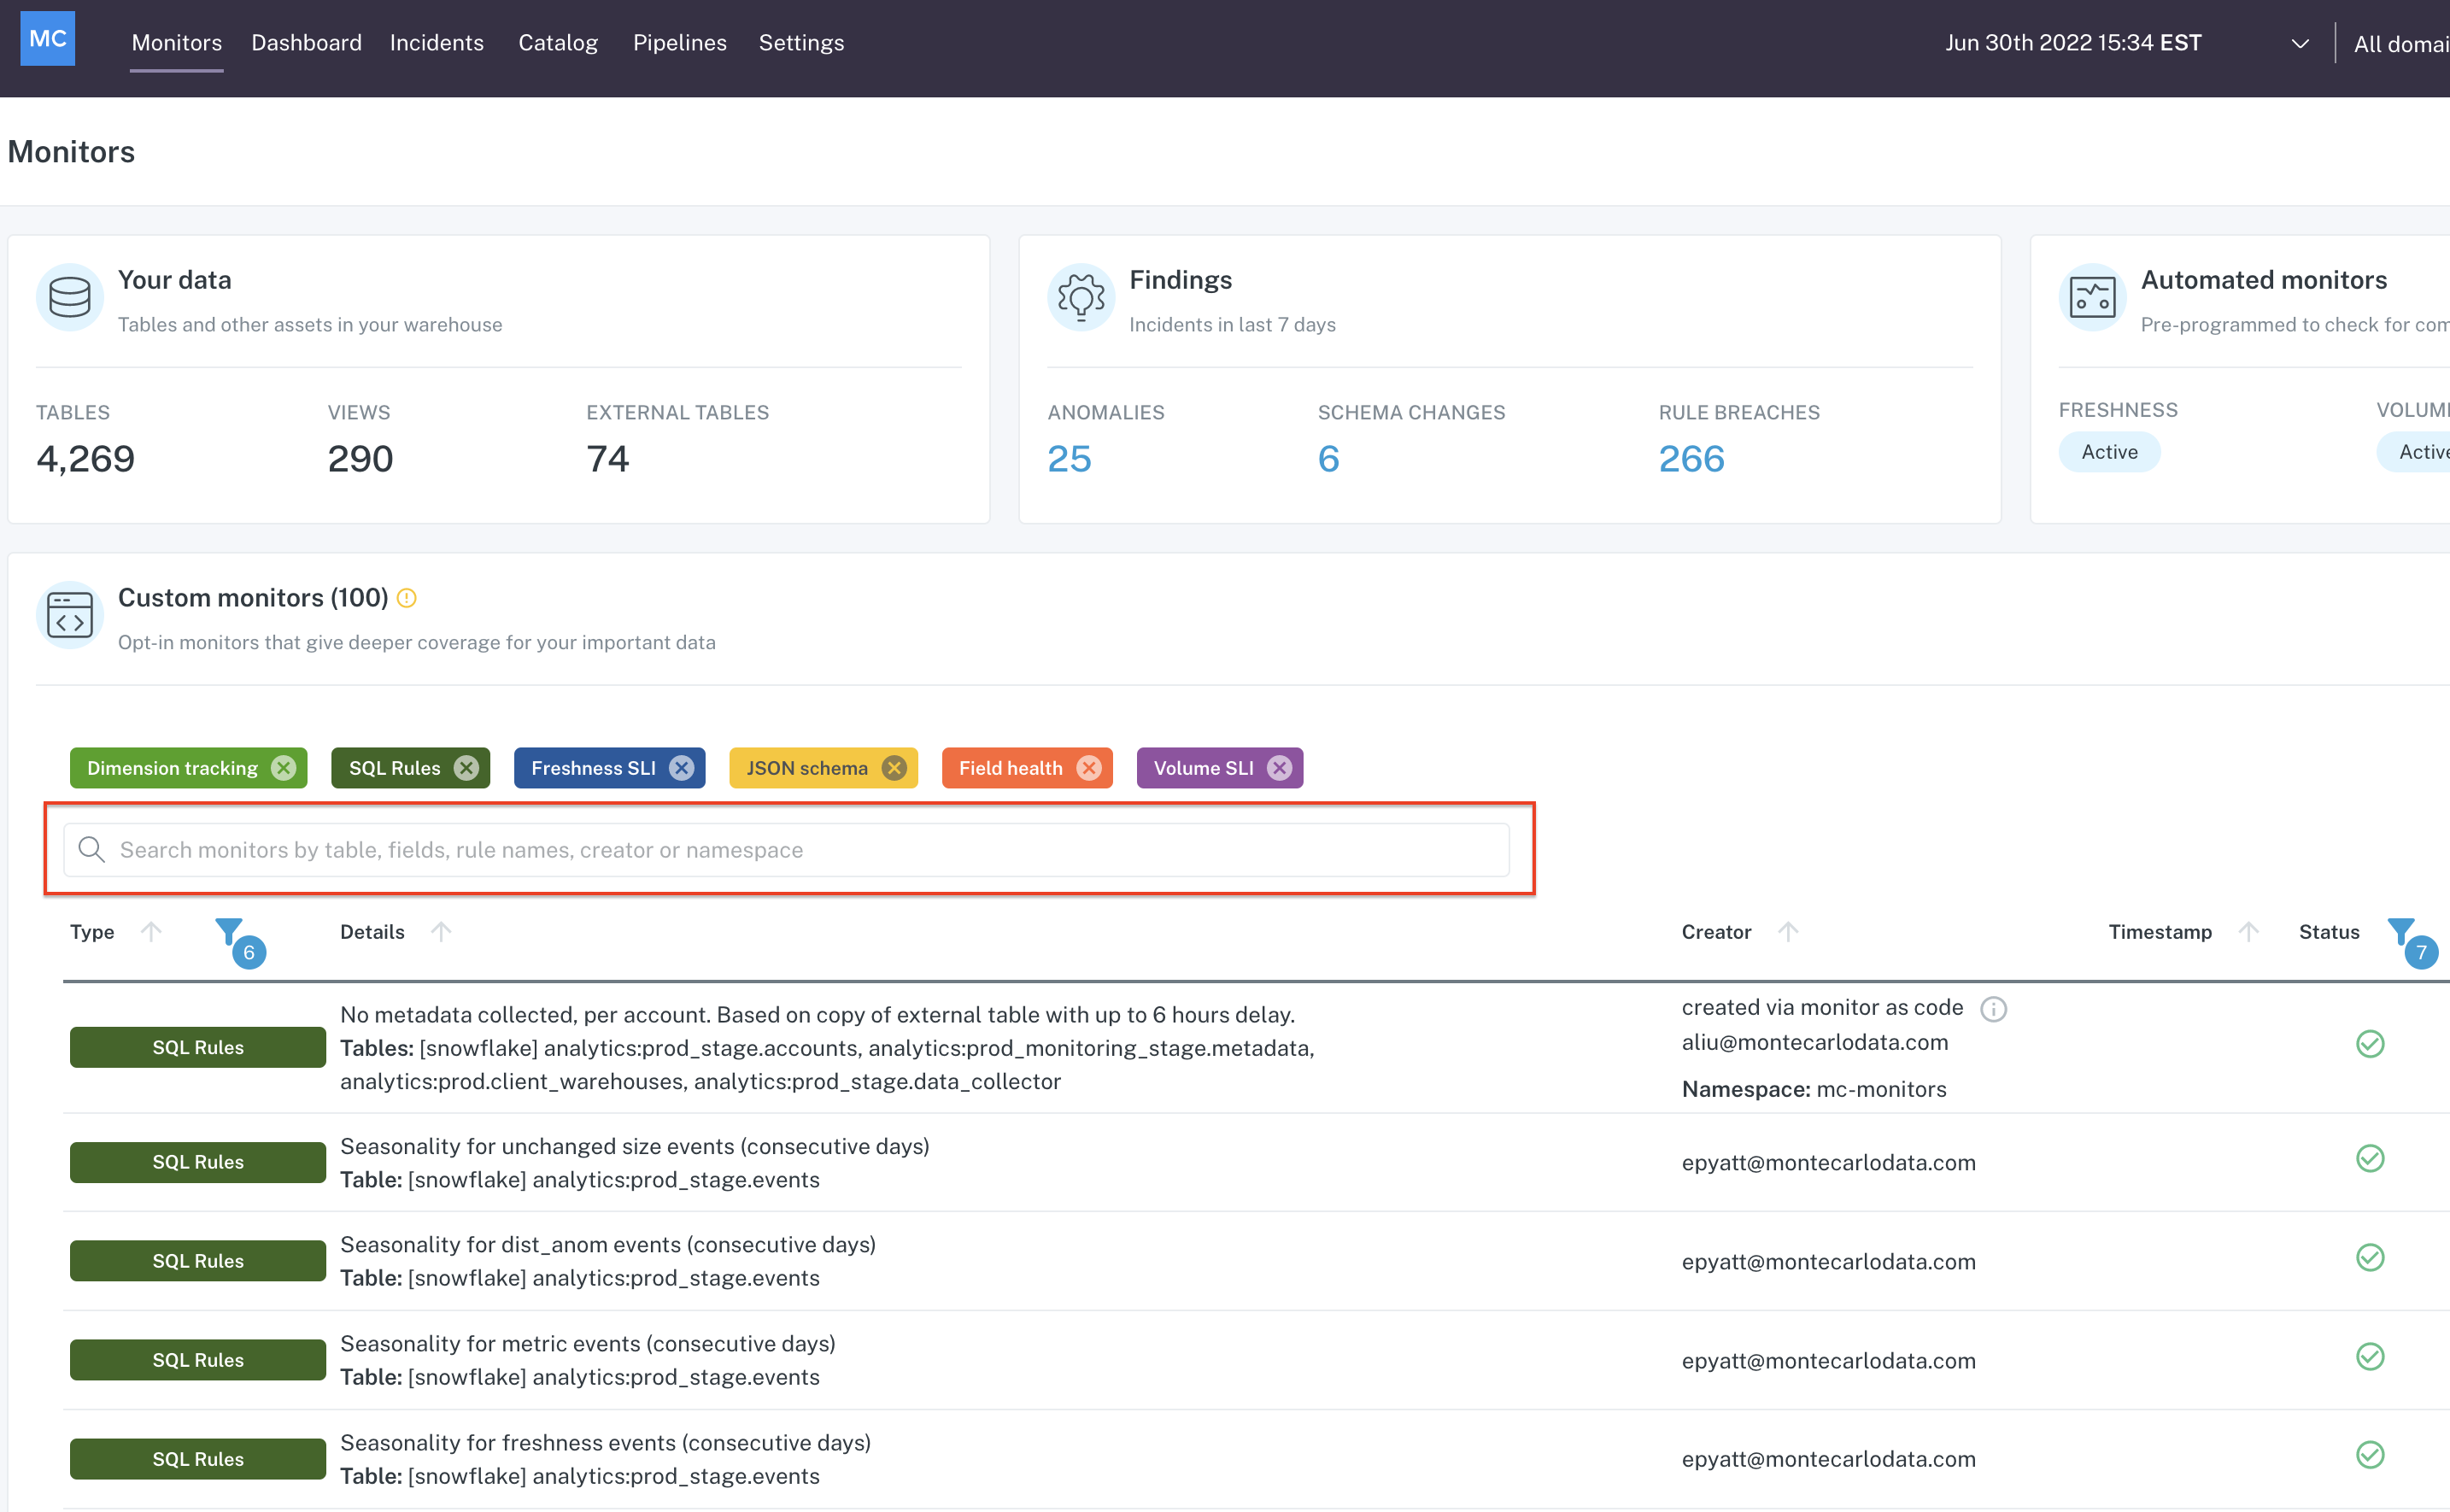
  • Improved monitor pausing usability and status: Introduced follow-on changes to make it easier to see which monitors are paused with a gray color status in the custom monitors table and in the catalog
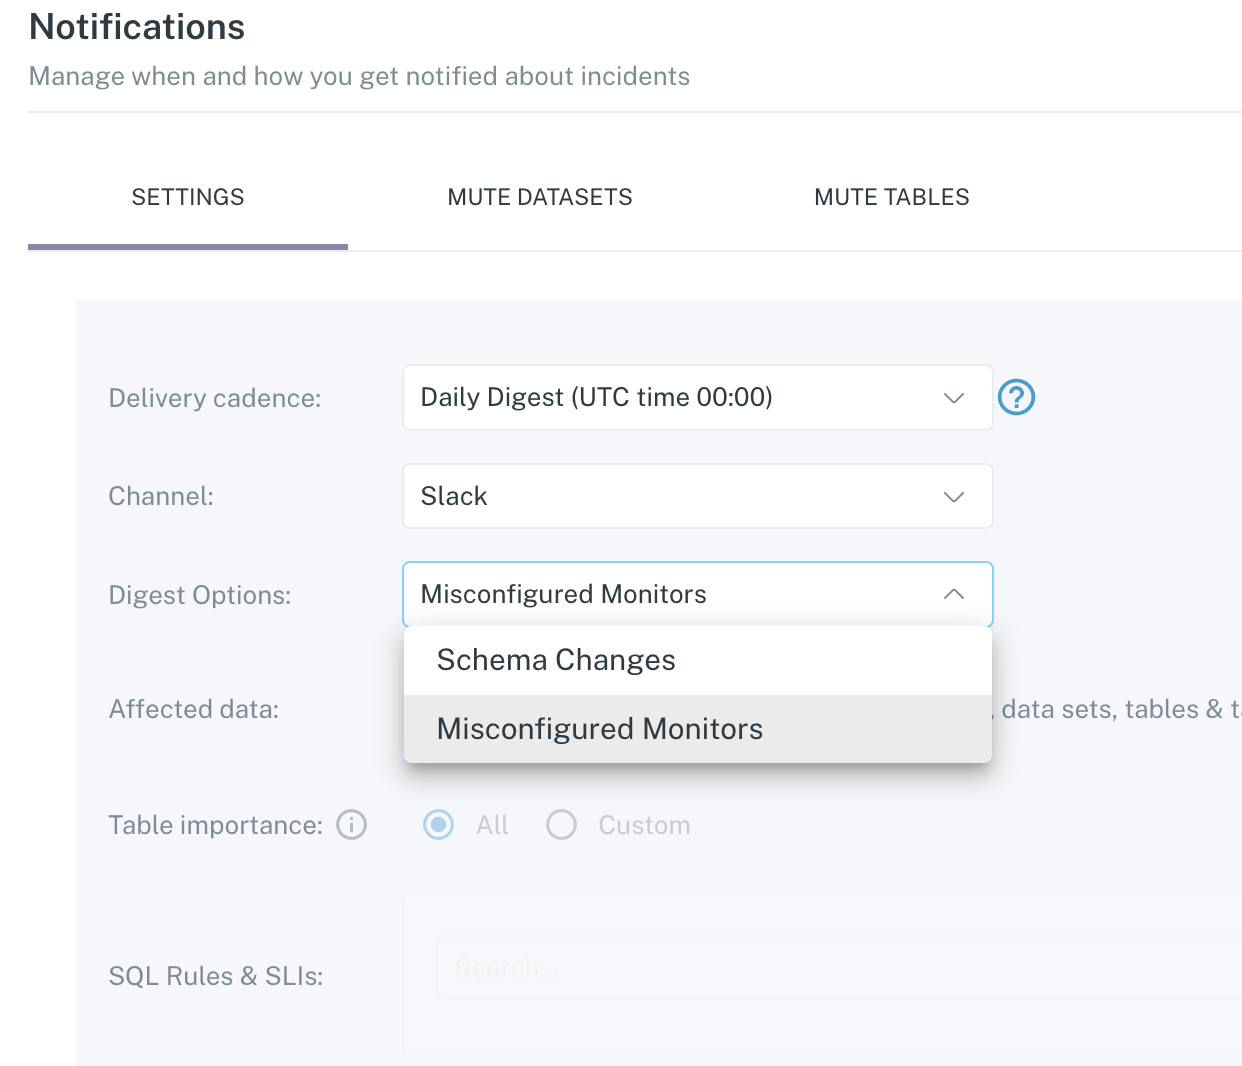
  • Added deleted table notifications: Get notified when tables are deleted in the same way you get notified for schema changes, data anomalies, etc.

Improvements and fixes

  • Fixed Domain filter for Findings module: Fixed a bug where the findings module in the Monitors tab was not properly filtering for the selected Domain
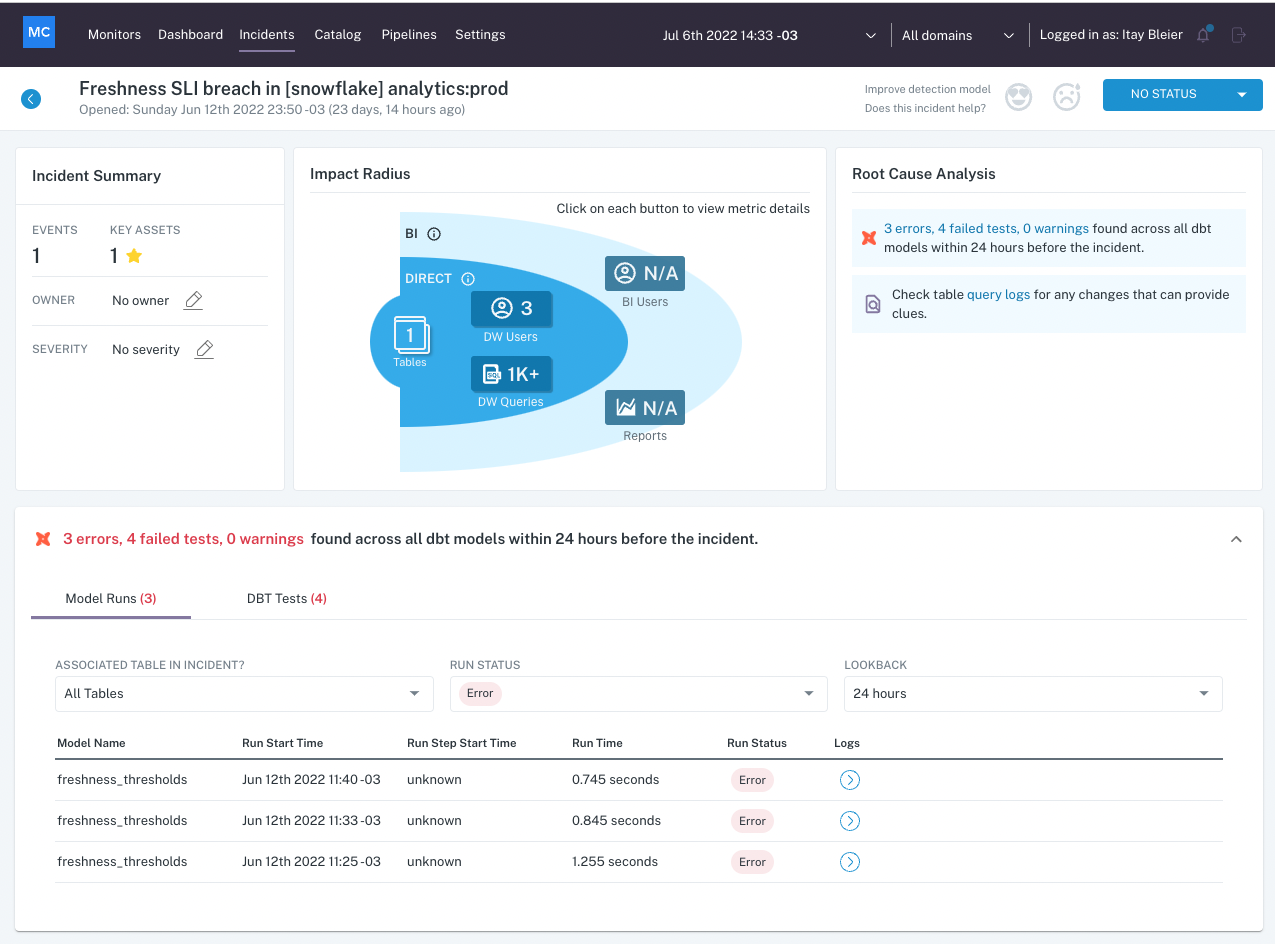
  • Fixed daily aggregation logic for FH: Resolved issues where time diff between data insert, sample data pull, and MC model anomaly detection were resulting in missed anomalies

What's next

  • Spark lineage: For our Spark customers, we're working on launching lineage which will allow you to map how queries interact to form lineage
  • Field level lineage: We expect to launch Field Lineage this week after working through a long tail of complex query patterns to appropriately define field relationships across tables
undefined

We're making progress on

What's new

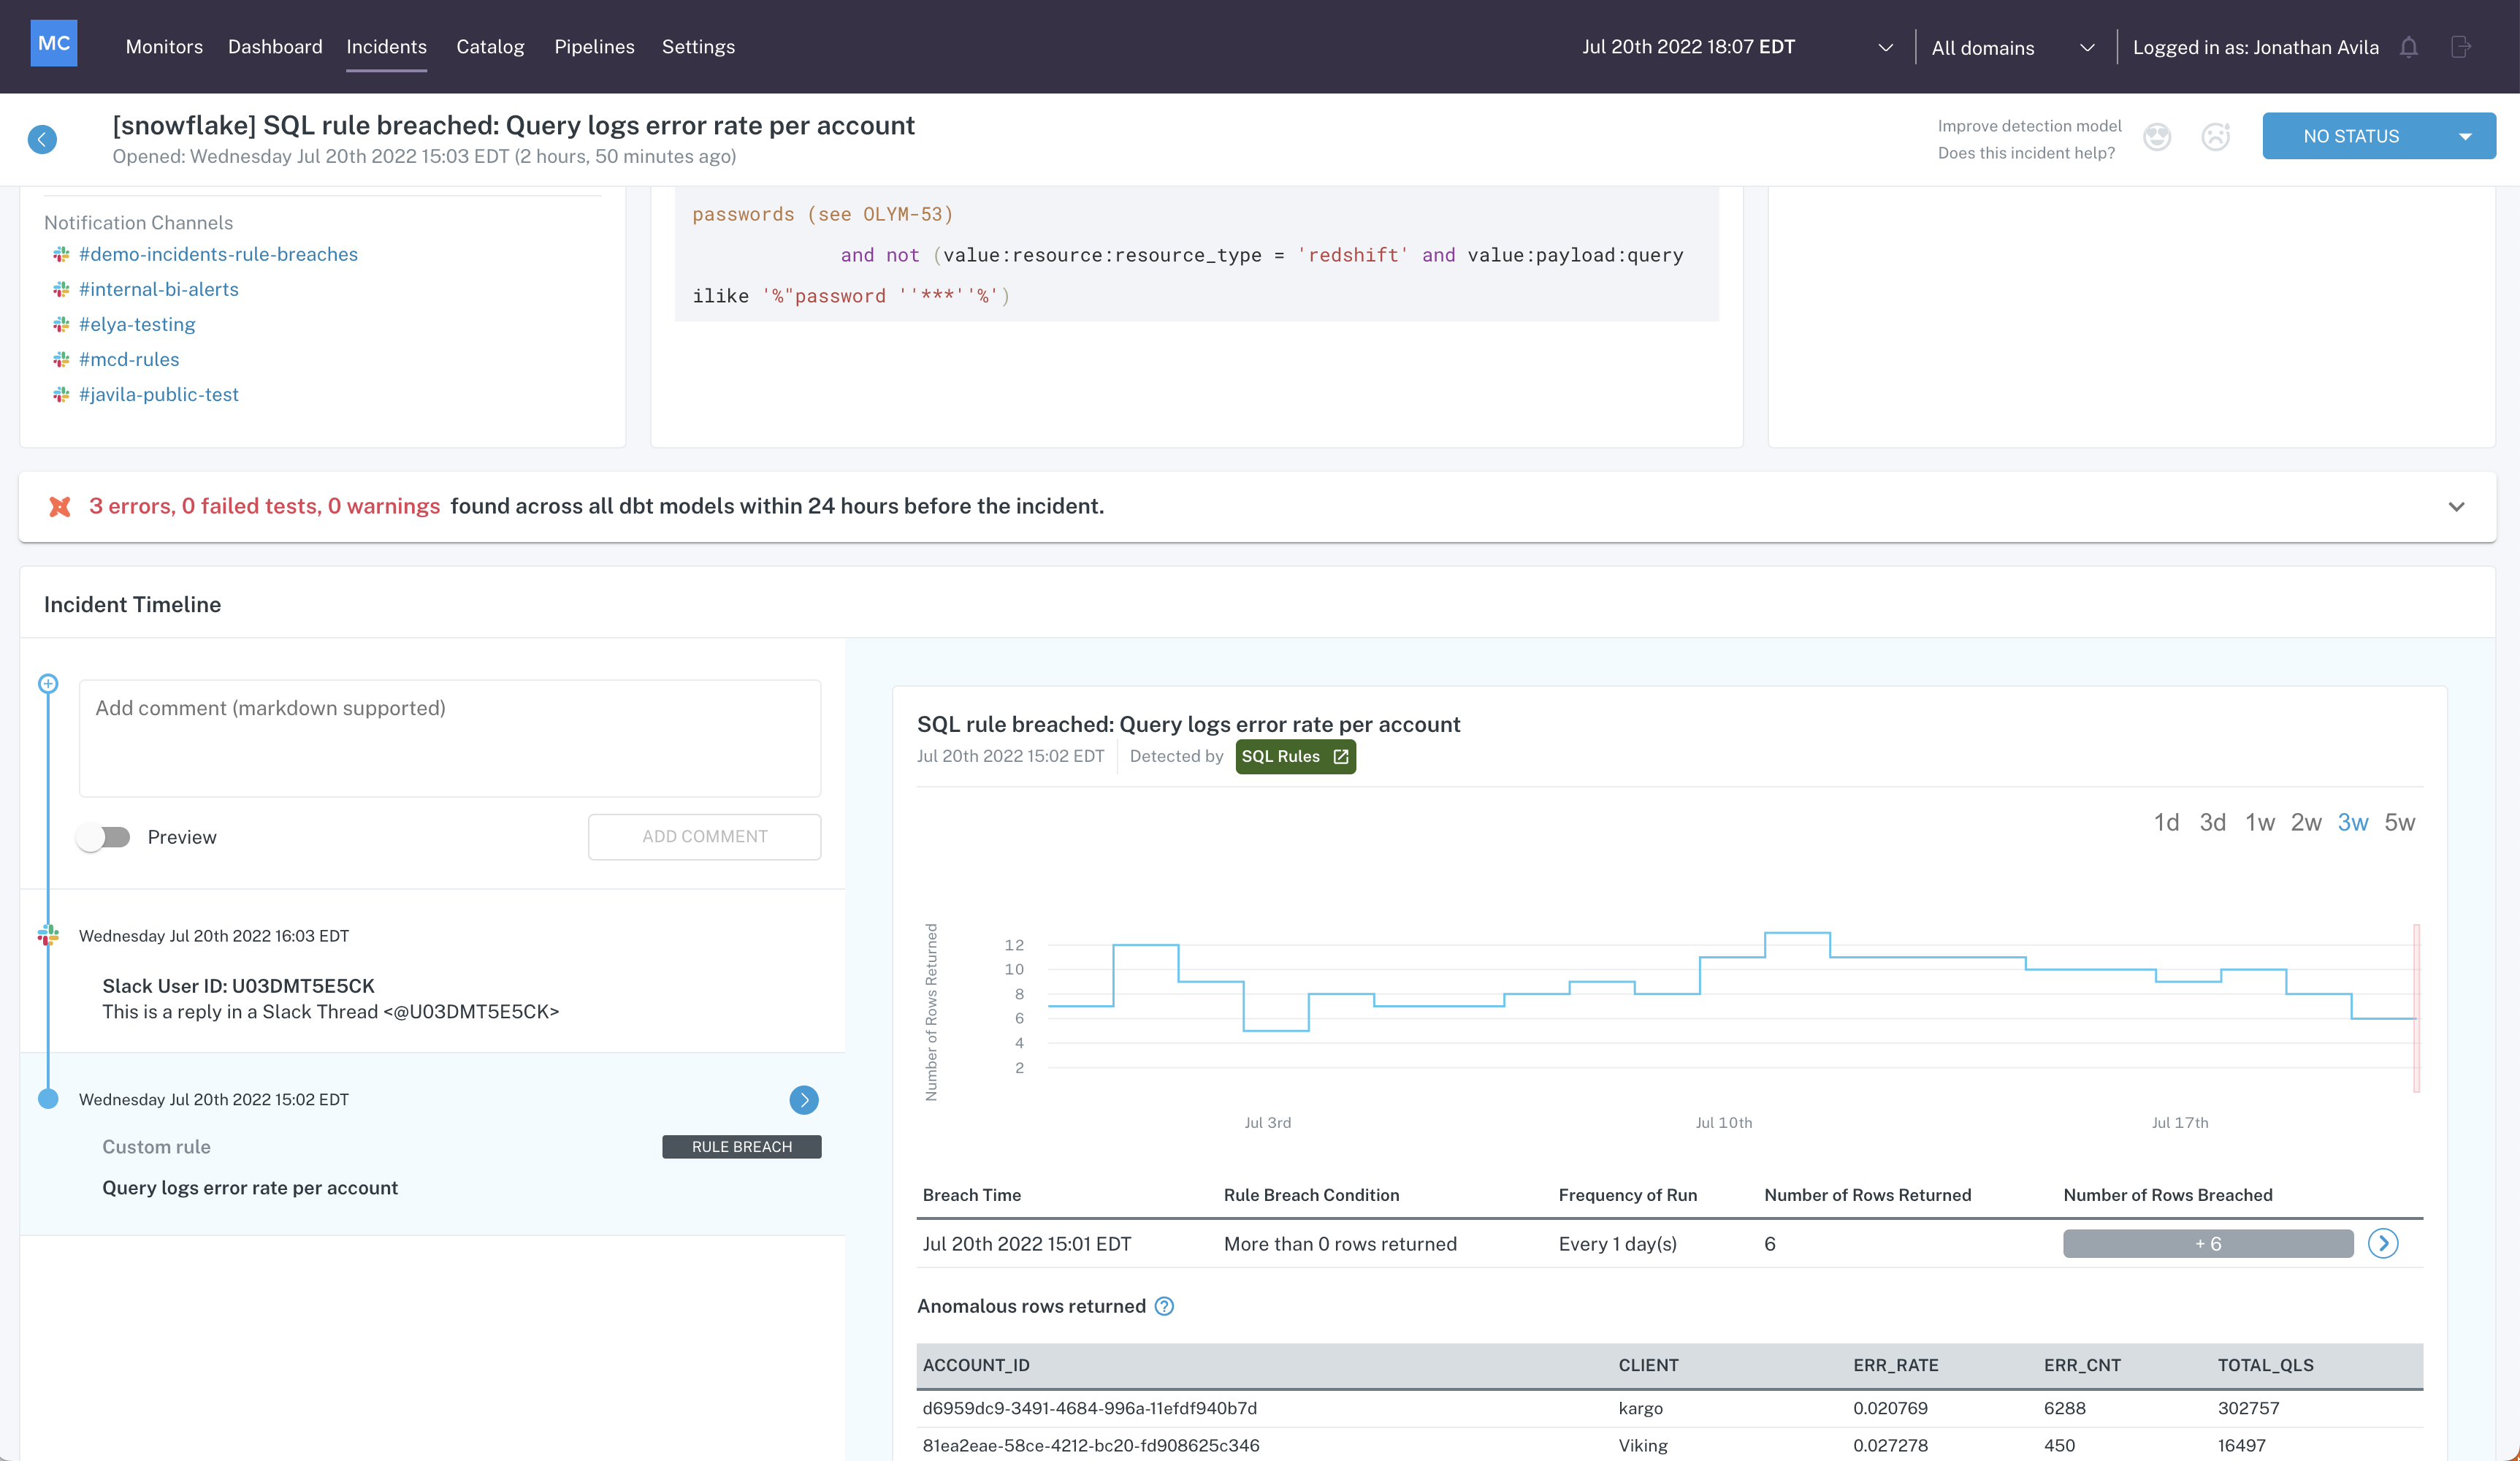
  • SQL Rule Incident card redesign: To make it easier to understand what is driving SQL Rule breach, we added a historical rows returned graph and link to the SQL Rule detail view
  • Query Graph: Released a new view that graphs SQL queries by character length to visually show when queries change and consequently help in an investigation

Improvements and fixes

  • Resolved query parser errors: A small number of query parser errors were fixed to improve reliability of how we generate lineage
  • Support multiple monitors on single table graphs: Now that we moved the Field Health and Dimension Tracking graphs to the monitor detail view, we can support multiple monitors on a single table that have different configurations resulting in different graphs

What's next

  • Spark lineage: For our Spark customers, we're working on launching lineage which will allow you to map how queries interact to form lineage
  • Field level lineage: We're working on a way to expose field level lineage in the UI to help with both field-specific investigations and field deprecation

We're getting close to the finish line with field lineage while continuing to ship UI and CLI improvements.

What's new

  • Monitor pausing: Easily pause Field Health, Dimension tracking, etc. monitors from running directly from the Monitors tab (click the overflow menu of any monitor to pause it)
  • CLI access to Insights reports: In addition to downloading CSV reports in the UI, customers now directly download those CSV reports via the CLI making it easy to download the data and ETL into a data store of your choice (learn more here)

Improvements and fixes

  • Query graph improvements: Improved usability of new query graph module including 1-click query detail view, moving the graph vs table toggle to the top of the module and resolving bugs causing some queries to not render properly
  • Slack Incident status syncing: We now sync Incident status changes made from one Slack channel to all other channels that received the same Incident notification

What's next

  • Spark lineage: For our Spark customers, we're working on launching lineage which will allow you to map how queries interact to form lineage
  • Field level lineage: We're working on a way to expose field level lineage in the UI to help with both field-specific investigations and field deprecation

We have another double feature this week as we skipped last week's update.

What's new

  • Domains: To help larger teams manage complex datasets, we released a mechanism to create database and schema filtered groups that users can select to filter the UI by team, focus area, etc.
  • SQL Rule run history: Access the full run history of SQL rules including how many rows were returned in the Custom Monitor detail view

Improvements and fixes

  • Add Project filter support to notifications: You can now filter notifications by Project in addition to Datasets, Tables and Tags.
  • Edit aggregation window for Field Health and Dimension Tracking Monitors: Added a daily aggregation option to improve support for tables with small volume changes when tracked on an hourly basis
  • Resolved a Looker lineage bug: Fixed an issue that was causing certain Looker assets to not appear in the Pipelines lineage graph
  • Resolved a notification routing bug with SQL Rules: Fixed an issue where SQL Rule notifications were not being sent as expected based on the Notification configuration

What's next

  • Spark lineage: For our Spark customers, we're working on launching lineage which will allow you to map how queries interact to form lineage
  • Field level lineage: We're working on a way to expose field level lineage in the UI to help with both field-specific investigations and field deprecation

Another exciting week of ships across the app focused on usability and expanding integrations.

What's new

  • Custom Monitor run results added to Monitor details view: Easily access custom monitor run details (i.e. field health statistics, field value distributions, etc) by clicking on the arrow next to each custom monitor in the Monitors tab - you can also edit custom monitors, view run status and more from this view
  • Automate the S3 Events setup: For data lake customers, we've made it significantly easier to setup S3 events via our CLI with a fully automated process which is documented here

Improvements and fixes*

  • Resend user invites from Settings: You can now resend user invite emails when the invite gets lost in someone's inbox or never arrives
  • Snooze SQL Rules from Slack: To support the recent launch of SQL Rule snoozing, you can snow snooze rules directly from slack using the dropdown menu included in the Slack message body
  • Resolved missing custom monitor status: Fixed a bug causing a handful of Custom Monitors to not display the recent run status in the Custom Monitors table
  • Add support for us-west-2 in Data Collector: Customers using the us-west-2 AWS region can now deploy the data collector without concern

What's next

  • Domains (previously named workspaces): To help larger teams manage complex datasets, we're building a domain model which will allow users to create database and schema filtered groups that users can configure to filter the UI by team, focus area, etc.
  • Field level lineage: We're working on a way to expose field level lineage in the UI to help with both field-specific investigations and field deprecation

Despite last week being short with the US holiday, the team shipped some great updates across the board.

What's new

  • Manage warehouse and BI connections from settings: You can now add, update or remove warehouse and BI connections all from the Settings > Integrations section in the app - you can also continue make these configuration changes (and more!) via the CLI
  • Add custom messages to notifications: Add custom messages including @ mentions, # tags, etc to notifications sent to Slack, email, Pagerduty, Opsgenie, etc. - these messages allow you to add context when those receiving the notifications may lack context

Improvements and fixes*

  • Improved handling S3 Events metadata collection: Improved metadata collection within S3 Events integrations to improve reliability of the schema within MC
  • Monitors as code UI handling: The recent release of monitors as code introduced potential conflicts with monitors configured in the MC app - with this change, any monitors configured via the YAML config will be clearly identified as so in the app

What's next

  • Domains (previously named workspaces): To help larger teams manage complex datasets, we're building a domain model which will allow users to create database and schema filtered groups that users can configure to filter the UI by team, focus area, etc.
  • Field level lineage: We're working on a way to expose field level lineage in the UI to help with both field-specific investigations and field deprecation

It's a short this week with Memorial Day in the US and Canada.

What's new

  • Monte Carlo CLI overhaul: Dramatically improved usability of the CLI by adding support for deploying MC collectors across regions, enabling you to skip onboarding steps, testing telnet connections, BI tool onboarding and many usability improvements (see docs here)

Improvements and fixes*

  • Append custom text to Incident Notifications: Add context to your MC incident Slack and email notifications by appending custom messages and/or @ mentions
  • Add support for EU Opsgenie instance: Opsgenie customers with hosted instance in the EU can now update their URL
  • Improved performance of sample SQL queries: When investigating field health anomalies, we reduced the time it takes to access sample queries and data

What's next

  • Domains (previously named workspaces): To help larger teams manage complex datasets, we're building a domain model which will allow users to create database and schema filtered groups that users can configure to filter the UI by team, focus area, etc.
  • Field level lineage: We're working on a way to expose field level lineage in the UI to help with both field-specific investigations and field deprecation

Another exciting week of product feature improvements and new releases!

What's new

  • Dataset and table filters apply to SQL Rule Notifications: With this change customers no longer need to select individual SQL Rules and SLIs to filter which incident notifications they receive and instead can now use dataset/table/tag filters to automatically filter for incident notifications
  • Download pipeline graph as CSV or PNG: Easily download a CSV export of the pipelines lineage graph to generate your own version of the lineage graph or download a PNG to easily share pipeline graphs with coworkers

Improvements and Fixes:

  • Custom monitor WHERE clause support: Resolved an issue with Field Health and Dimension Tracking monitors with WHERE clauses and added WHERE clause filter to Field Health and Dimension tracking catalog view
  • Sample query performance improvement: Improved performance of accessing sample queries and sample records for Field Health anomalies - click on the new debug icon when available

What's next

  • Field level lineage: We're working on a way to expose field level lineage in the UI to help with both field-specific investigations and field deprecation
  • Workspaces: To help larger teams manage complex datasets, we're building a workspaces model which will allow users to create database and schema filtered groups that users can configure to filter the UI by team, focus area, etc.

We have a double feature this week due to our hackathon the week before last

What's new

  • SQL Rule snoozing: Easily snooze SQL rule notifications during incident investigations or while developing pipelines to reduce notification fatigue
  • Monitors as code: To help data engineering teams manage Monte Carlo monitors, we released YAML-based config that allows you to deploy and maintain monitors as part of your CI/CD process (Reach out to us if you're interested in testing out the functionality!)

*Improvements and Fixes

  • CLI Athena and Glue Connection Support: Improved connection status feedback when setting up Athena and Glue data lake integrations via the CLI
  • Rule and SLI result Insights report: Added a new report to the Dashboard Insights which shows a 90 day history of custom rules and Freshness/Volume SLIs
  • Infinite scroll and performance improvements on Incidents tab: The Incidents tab now loads significantly faster and infinite scroll means you no longer have to click to load the next set of results

What's next

  • Field level lineage: We're working on a way to expose field level lineage in the UI to help with both field-specific investigations and field deprecation