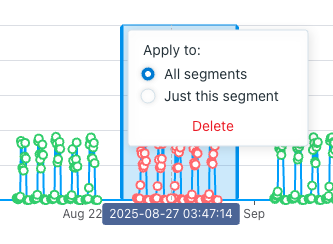
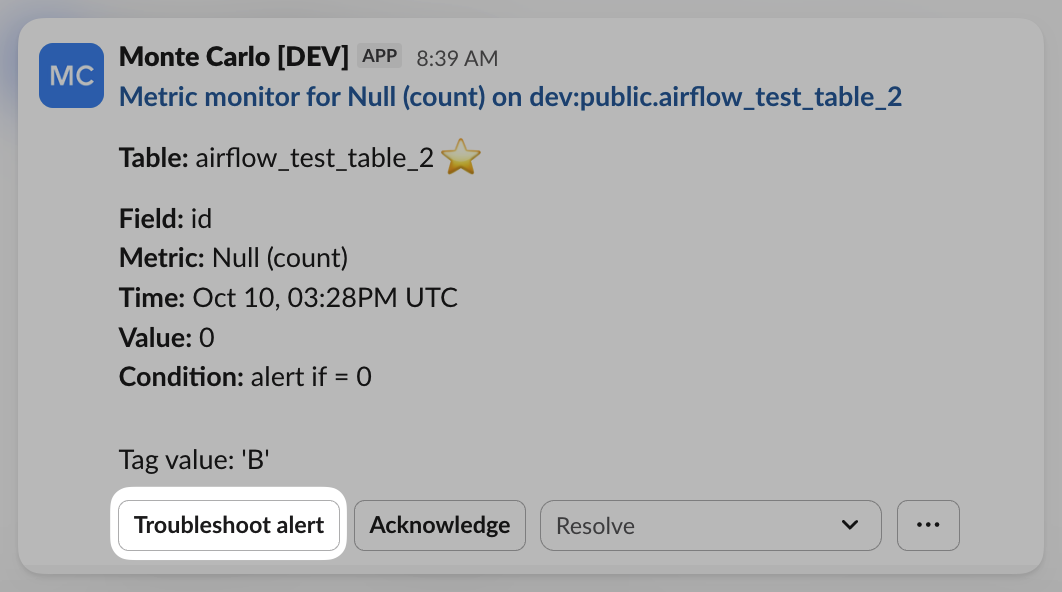
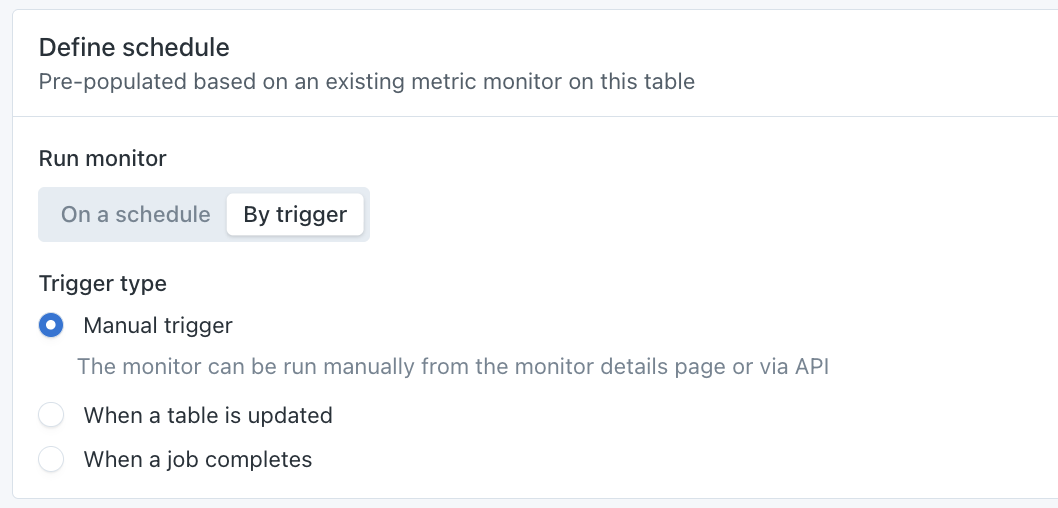
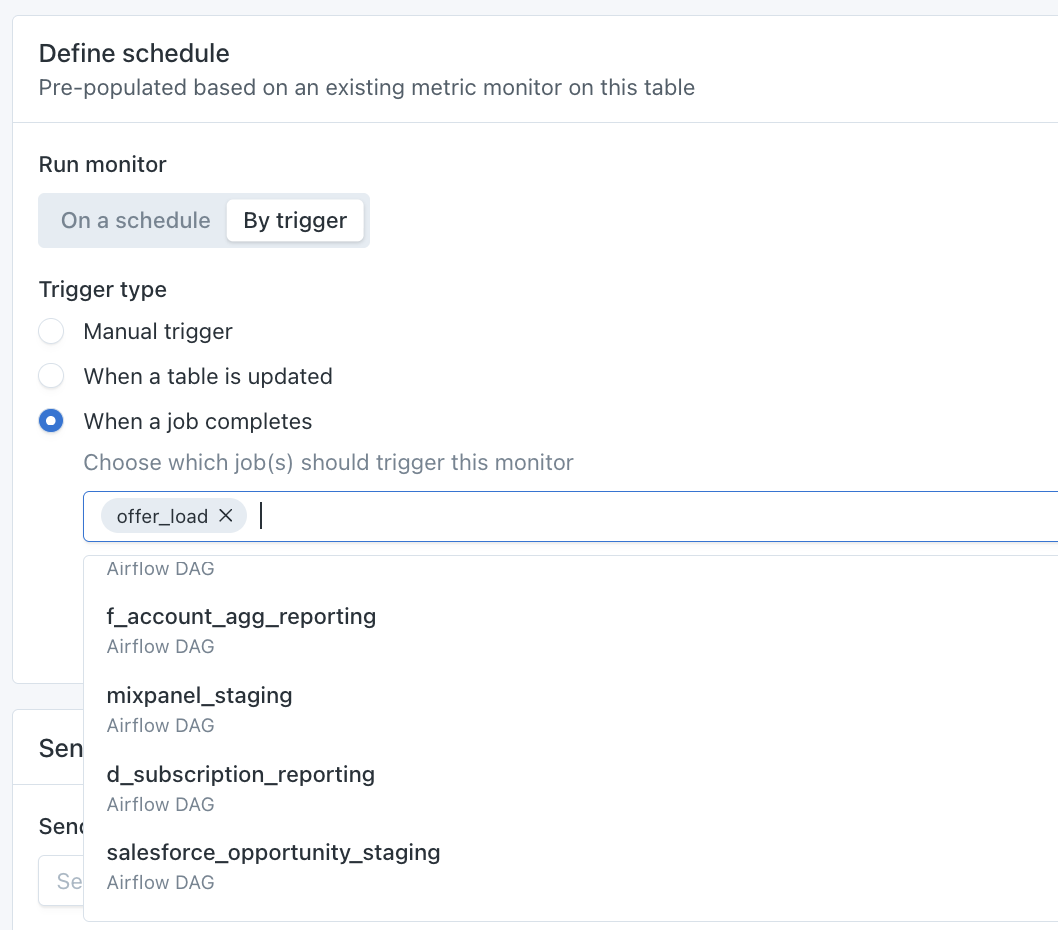
To make it simpler to create Metric monitors, we've shipped the option to "Recommend configuration". When the button is clicked, Monte Carlo will run some queries on the table in order to recommend settings for the Aggregation and Set schedule sections of the monitor. Configuring these sections properly is important in order for the monitor to do effective anomaly detection.

To learn more, see our documentation.

Defining a Data Product now tags all assets and their upstream tables with a tag in Monte Carlo. This tag can be monitored in the Usage UI to ensure monitoring coverage for that Data Product.

This provides a better way to define these "use cases", "workloads", "workflows", etc. that deliver some collection of trusted data. Once a Data Product is defined, all related upstream tables are automatically tagged by Monte Carlo and can be monitored in the Usage UI, ensuring full monitoring coverage for the Data Product. This allows you to focus on monitoring these larger "workloads" that are important to your business, vs having to hunt around for individual tables to include in monitoring one-at-a-time.

How does it work?

  1. Define the Data Product - When defining a Data Product, you should think about including the "interfaces" that make up your Data Products. These are the BI Report or the tables that users, APIs, or other data consumers are reading from.
  2. Monte Carlo tags all upstream tables - Once the assets are included and the Data Product is saved, Monte Carlo will automatically look upstream using lineage to tag all tables that are connected to those assets defined in the Data Product.
  3. Add a rule to monitor the tag - You can then choose to monitor all tables with that tag from the Data Product. This will ensure that all tables that relate to that Data Product are monitored by Monte Carlo.
  4. See coverage overview and same great dashboard - The Data Product provides an overview of its monitoring coverage and a dashboard to see current incidents.

See a full video walkthrough:


We've improved the sampling feature for dimension monitors to be consistent with field metrics monitors. You can now view and copy a sampling query for a dimension anomaly, as well as run the query to retrieve sampled rows directly in the UI.


In addition to the existing dbt test failures and model errors, we are now sending dbt warnings as MC incidents. Unless you have relatively noisy warnings, you should already start receiving dbt warnings the same way and same place you are getting failures for the same tests, without needing to configure anything.

To change the configuration for your warnings in MC, you can control go to Integrations -> Settings -> dbt to toggle the options. You can also opt in to group repetitive warnings into the same incident to prevent multiple alerts.


Our integration with Jira makes it easy to operationalize an incident management process. Users can choose to “push” an incident to Jira through a human-in-the-loop interaction, or they can directly send incidents to Jira through notifications. The status of those issues in Jira can then be automatically synced back to Monte Carlo, to close the loop.

Previously, only Jira Cloud was supported. But now, enterprises using Jira Data Center can integrate as well. Functionality between the Jira Cloud and Jira Data Center integrations is the same.

To learn more about our integration with Jira, and steps to integrate Jira Data Center, see our documentation.


Under the Usage UI, for all Orgs that have migrated to the new monitoring rules, a button to "Download monitored_tables.csv" will be available to download a timestamped csv. The download will include all current monitored tables at that point in time. Changes to the monitoring rules in the Usage UI will be immediately reflected in any subsequent downloads of the csv.

Columns included in the export:

  • Integration
  • Database
  • Schema
  • Table Name
  • Type
  • Importance Score
  • Last Activity

Monte Carlo now delivers a personalized Weekly Data Reliability Summary email. This digest provides a convenient overview of critical data health metrics from the previous week.

Key Summary Sections:

  • View incidents: A quick link into the Incident Feed for incidents raised in the past week.
  • Incidents assigned to you: The 5 most recent Incidents by creation date, raised in the past week that are currently assigned to the digest recipient.
  • Incidents & Response: Summary of key metrics around Incidents raised by Monte Carlo and how they were responded to.
  • Top 5 assets with incidents: The 5 assets with the most incidents raised against it over the past week, sorted by total incidents raised for that period
  • Top 5 monitors with most incidents: The 5 monitors with the most incidents raised over the past week, sorted by total incidents raised for that period.
  • 5 most recent new monitors added: The 5 newly created monitors over the past week, sorted by creation date.

Availability: Account Owners, Domains Managers, Editors, Responders, and Viewers will start receiving this Weekly Digest automatically.

Manage Preferences: Opt in or out of the weekly digest within your User Profile settings.

For more details, refer to our documentation.

Formerly known as Field Metrics, the new experience for Metric Monitors provides more flexibility and functionality to do deep quality checks on a given table, including:

  • Feature parity between metrics monitored using automated vs manual thresholds. Segmentation, scheduling options, and filtering options are now the same regardless of if a monitor is using manual or automated thresholds.
  • Manual and automated thresholds can now be set using a single monitor. For example, I could monitor 3 field for Unique (%) with an automated threshold, and 5 different fields for Null (%) using a manual threshold, all within a single monitor.
  • New UI to create Metric Monitors, emphasizing ease of use.

To learn more, check out our documentation on Metric Monitors.


In the Usage UI, there are now options to set Monitoring Rules at the Warehouse and Database levels. When a rule is set at one of these levels, all lower levels will show a read-only rule with references back to the higher level where it was initially configured. Additional rules can be added in include/exclude at lower levels and are OR'ed with the inherited ones.

Use these rules to specify conditions you want inherited down to the schema level. Some examples:

  1. You want to prevent any table with "_dev" in its name from ever being monitored.
    1. Add a rule at the Warehouse level to Except tables where table name contains _dev
  2. You want to ensure that tables without recent read or write activity on them are not monitored
    1. Add a rule at the Warehouse level to Monitor tables where there was activity in the last 30 days


We've added a rule under the Usage UI to let you select what tables to monitor based on tags. Under a Schema in the Usage UI, you can select Monitor tables where "tag" is one of: and specify a multi-select list of tags. This accompanies the rest of the rules we support, for a full list, see our documentation.