We've shipped a large set of improvements to Metric Monitors, including:

  • New Pipeline Metrics, such as Change in row count and Time since last change in row count. These serve as great measurements for freshness and volume when monitoring data by segment
  • Increased limit of segments to 10,000, for monitors that track a single metric and run daily. Learn more
  • Improved the usability of the creation and alert flows

These improvements allow customers to track 10x more segments per monitor than before, and provides a much more purpose-built experience for doing freshness or volume monitoring with metric monitors.

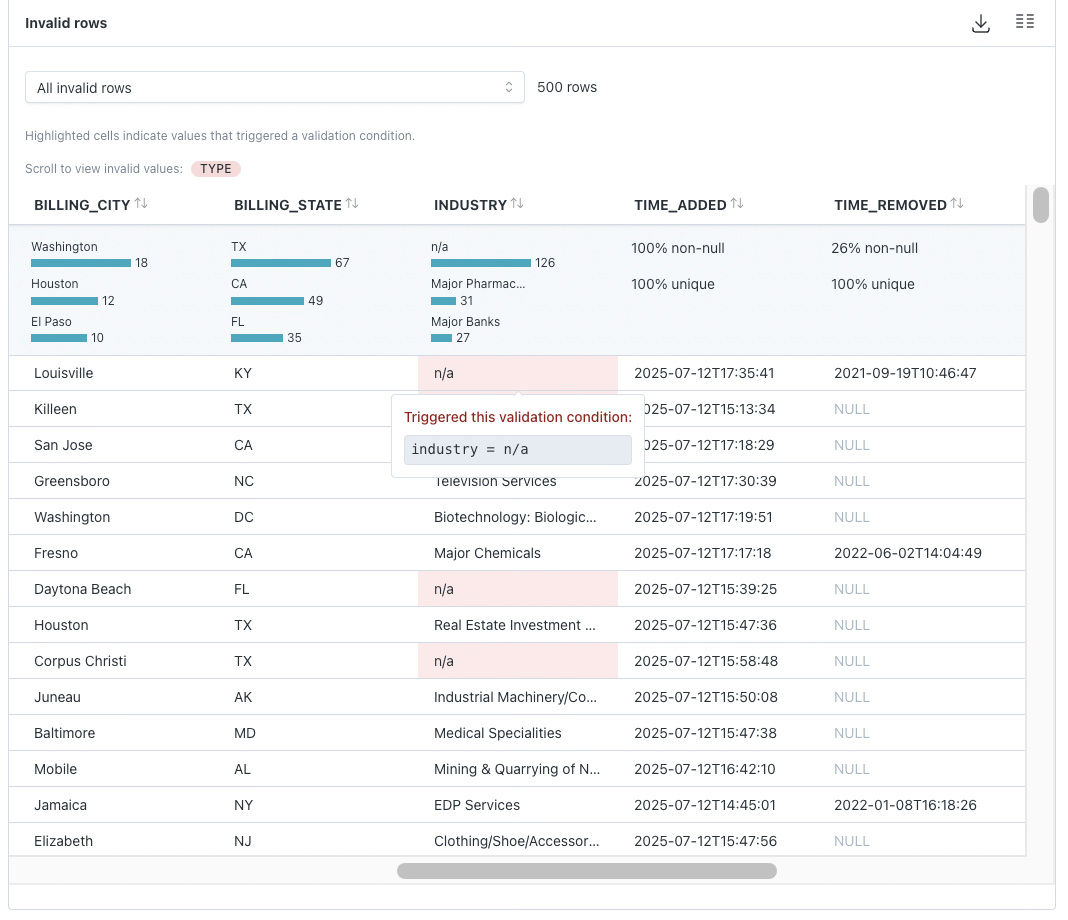
Last week, we released Validation Monitors. These make it easy for data analysts and engineers to create no-code checks for common data quality issues.

Some examples:

  • Alert me if… loan_origination_date is in the future
  • Alert me if... member_id is not 13 characters AND ins_provider = ‘United Healthcare’ OR member_start_date is in future
  • Alert me if... (country equals ‘UK’ AND post_code is not UK Postal Code) OR country is null

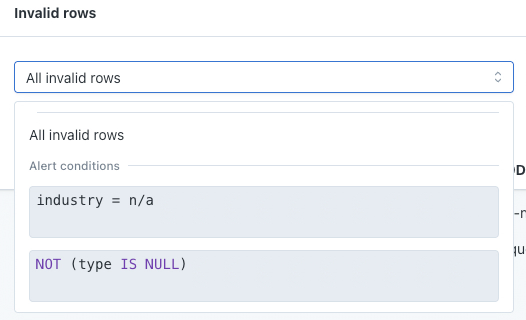
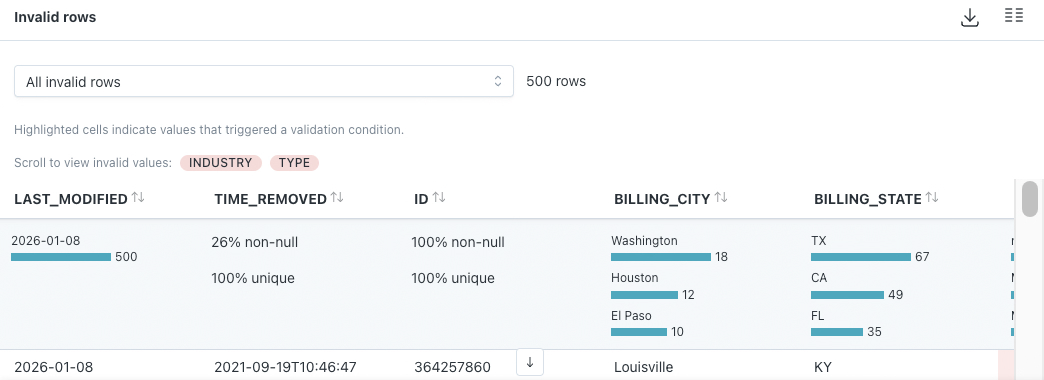
You’re alerted to any rows that fail the validation (“invalid rows”) so you can identify, track, and resolve any bad data. All without writing SQL!

This initial release includes a rich set of operators and a hundred out-of-the-box templates. Try creating one! Go to the Monitor Menu and select Validation. To learn more, see our documentation.


For AWS resources or deployments that are not publicly accessible, or if you prefer to connect privately, you can now more easily use VPC endpoints. This helps ensure that traffic between the Monte Carlo Platform and the service traverses the AWS backbone network.

Supported integrations and deployments include:

  • Databricks on AWS
  • Snowflake on AWS
  • AWS Redshift (Provisioned)
  • AWS Redshift Serverless
  • AWS Agents
  • AWS Data Stores
  • Various instances on AWS (e.g., EC2, RDS, etc.), including examples like Tableau Server and Aurora Postgres.

For setup instructions and additional information, please refer to the documentation here.

To learn more about AWS PrivateLink, please visit this page.

Users can now manage their volume thresholds - whether automatic or manual - all from Assets > Change in row count. To see this drawer, click Edit threshold on the Change in row count widget in Assets. User can then click Edit and choose between:

  • Automatic: ML will determine the threshold, and the user can choose between High/Med/Low sensitivity.
  • Explicit: User will determine the threshold.
  • Disable: Volume monitoring will be turned off for the table.

Volume thresholds set through Assets > Change in row count will follow the notification routing and grouping logic of out-of-the-box volume monitors, regardless of whether “Automatic” or “Explicit” thresholds are selected.

These changes are geared to give users one place to manage the volume thresholds for a table, instead of being fragmented across different experiences for out-of-the-box volume and Volume Rules. Existing Volume Rules will continue to function, and users can continue to create them through Monitors as Code.

To learn more, see our documentation for Volume monitoring.

Metrics monitor is now available for Teradata. Metrics including nulls, duplicates, unique, and custom metrics are included for the monitor for Teradata.

Users can now filter for specific Airflow DAGs to include in an audience so only alerts on selected DAGs will be sent to the notification channels for the audience to minimize potential alert noise. Previously, an audience got either all or no airflow dags’ alerts.
Users can also select specific Airflow DAGs to include in a domain, and then leverage the defined domain to define an audience. This ensures users are only seeing the DAGs relevant to them across the UI.
Docs here https://docs.getmontecarlo.com/docs/airflow#monte-carlo-notifications-of-airflow-failure-alerts

For Azure resources or deployments that are not publicly accessible, or if you prefer to connect privately, you can now utilize private endpoints! This ensures that traffic between the Monte Carlo Platform and the service traverses the Microsoft backbone network.

Supported integrations and deployments include:

  • Databricks on Azure
  • Snowflake on Azure
  • Azure SQL Database
  • Azure Agents
  • Azure Data Stores

For setup instructions, check out the documentation here.

To learn more about Azure Private Link, visit this page.

We updated to a first-class PagerDuty by adding bi-directional status sync and customizing Urgency per Audience. If you are using PagerDuty already today, this will be a major enhancement to the data operations experience. If you are not using the integration, these enhancements may be unblocking!

Learn more in the video below and in our PagerDuty docs.


Marking and tracking incidents is best practice for data teams looking to improve data quality and trust across the business. Incidents should be communicated out to stakeholders when appropriate and reviewed on a monthly cadence to determine where gaps in data quality may lie. Furthermore, severity levels of incidents are useful for understanding impact quickly and setting priorities for data teams.

This change is gradually rolling out to Monte Carlo workspaces over the next week. Learn more about marking incidents and severity here in the docs!

Didn't everything used to be called an incident in Monte Carlo? Yes! See more about that recent change under Introducing: Alerts.