Our new Create data product wizard provides a cleaner, more initiative process to help you create Data products in Monte Carlo. Start by going to "Create data product" under the Data product tab in the top menu.

  1. Add a Name and Description that will make this Data Product easily identifiable by other users viewing this across your workspace.

  2. Search for assets that you would like to add to this Data Product. Table and Reports can be added. Click "+" under "Add" column to add them to the Data Product.

  3. As you add Tables and Reports, you will see them appear on the right side.

    1. The number behind "Included assets", e.g. "8" in screenshot below, represents the total number of unique tables necessary to build the data product. It includes all tables used directly by the product, as well as their upstream dependencies.

    2. For tables and reports where upstream lineage is available, you will see a column for the number of upstream tables connected to that asset that will be included in the Data Product, e.g. "4 upstream tables".

  4. Click "Next: Review"

  5. In the Review step, you will be able to see all Tables and Reports to be included in your Data Product. The tables and reports you included in the previous step and all their upstream tables have been included in the Data Product. Refer to Why Include All Upstream Tables in Data Products.

    1. Use the "Lineage" and "List" view to see the Data Product in different visual layouts

    2. Use the Filters at the top to filter both of these views by the monitoring status of each of the tables included in the Data Product.

      1. Monitored - tables that are currently already monitored through other monitoring inclusion rules in the Usage UI
      2. Not monitored - tables that are not monitored or explicitly excluded from monitoring.
      3. Not supported - tables that exist in the lineage but monitoring through Monte Carlo is not supported
    3. Click "Create and Monitor" to create the Data Product and monitor all "Not monitored" tables. Note: the

Once a Data Product is created, all tables in the Data Product will be automatically tagged with a Table tag.

See more details on Data products in our documentation: https://docs.getmontecarlo.com/docs/using-data-product-dashboards

Similar to the daylight savings support that already exists on custom monitors, we've now added daylight savings support to explicit thresholds for Freshness and Volume.

Some customers run their data pipelines in their local timezone. This setting makes sure the schedule (or CRON) of their explicit thresholds also adheres to that local timezone.

Custom monitors have a toggle to turn failure notifications on or off. When on, the monitor will send an alert to if the monitor fails to complete. This is different than the monitor triggering an anomaly alert. Instead, the job of a failure notification is to indicate that monitor was not able to check the quality of the data. When creating a new monitor, the default setting is ‘on’.

We'll now alert to cases where the “run” of the monitor never even starts. For example:

  • Table not monitored: the table is not included for “monitoring” in Settings
  • No connection found: the connection to the data source no longer exists
  • Sampling is disabled for a value-based rule: data sampling has been turned off in your environment. This type of rule is disallowed when sampling is off.

Previously, we alerted just to cases where it started but then failed for some reason. To limit noise from repeatedly failing monitors, we’ll send no more than 1 failure notification per monitor per week.

For accounts where this will significantly increase the number of failure notifications being sent, a proactive message was delivered to Account Owners on September 25.

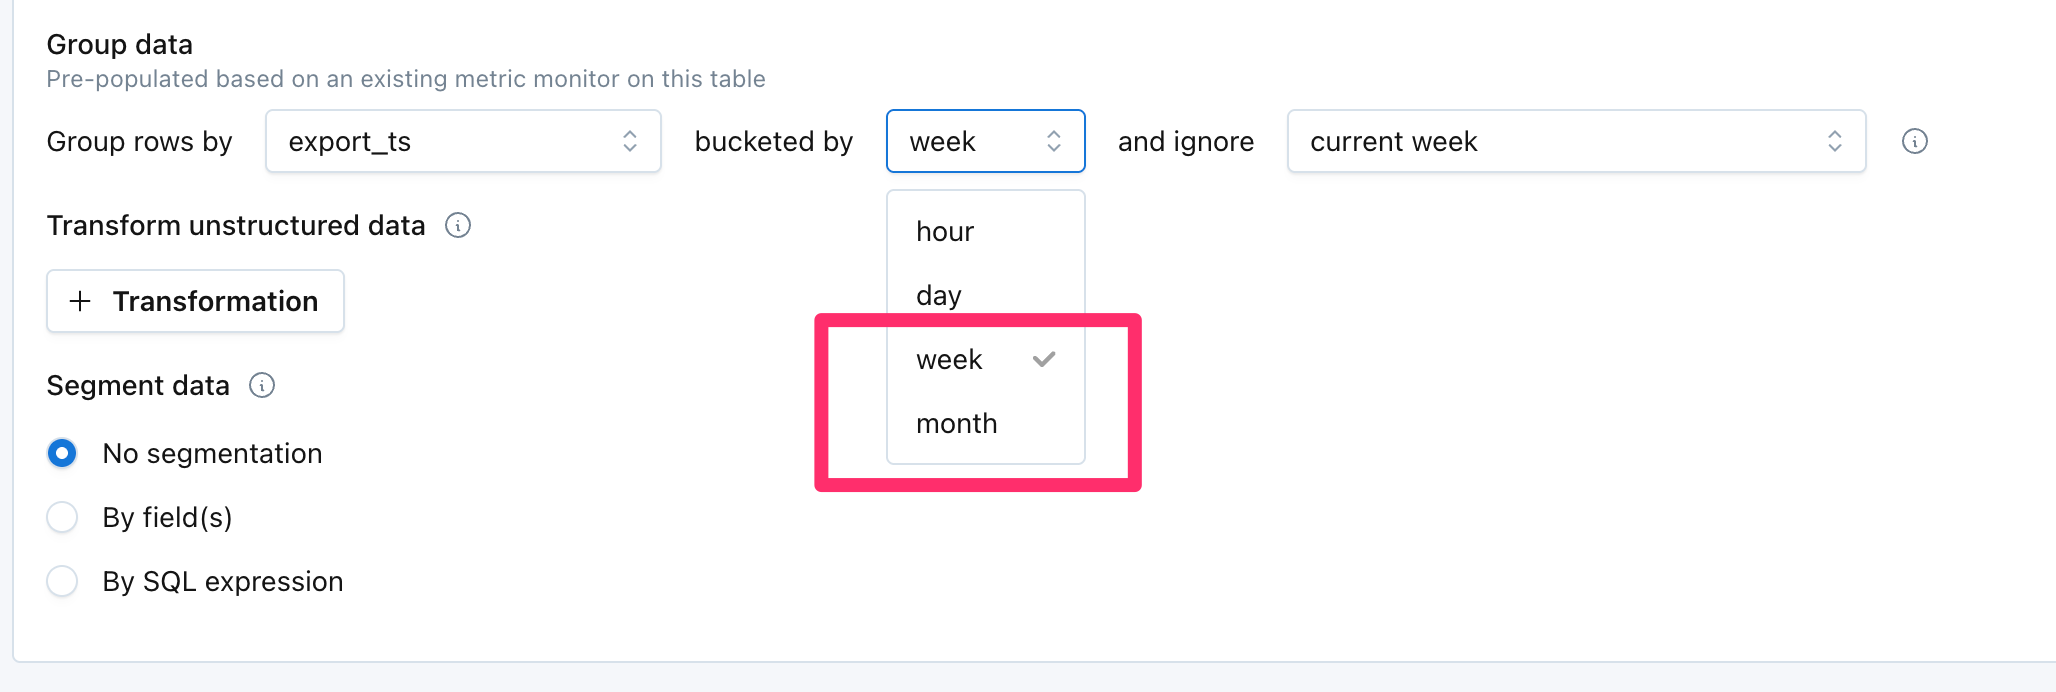
In metric monitors, users can now define segments with a SQL Expression. Previously, segmentation could only be configured by picking 1 or 2 fields.

This helps support a long tail of segmentation use cases. For example, when segmenting, users can now concatenate many different fields (e.g. if you wanted to segment by 4 or 5 different fields), or shorten really long field values that impair usability.

Learn more about segmentation.

Up until this week, Cardinality Rules and Referential Integrity Rules were options on the Monitor Menu in Monte Carlo. These were purpose-built monitor creation experiences that produced a SQL Rule. These were for use cases like:

  • Alert me if any of the values in [field] are not included in set [value1, value2, value3, etc]
  • Alert me if any of the values in [field] are not present in [table > field]

Existing Cardinality Rules and Referential Integrity Rules will continue to run normally. But the workflows to create these have now been removed from the monitor menu.

Referential Integrity Rules and Cardinality Rules were made redundant by new ways to define a set in Validation Monitors. In Validation Monitors, the recommended way to address these use cases in now with the Is in set and Is not in set operators, which allow a user to define a set:

  • From a list: manually enter the values
  • From a field: select a table and field, and the set with be populated with the distinct values in that field. The selected field will be referenced each time the monitor is run, so the set values may change.
  • From a query: write SQL to define the values in the set. The query will run each time the monitor is run, so the set values may change.

Read more about this change here.

The is in set and is not in set operators now allow users to define a set using 3 possible methods:

  • From a list: manually enter the values
  • From a field: select a table and field, and the set with be populated with the distinct values in that field. The selected field will be referenced each time the monitor is run, so the set values may change.
  • From a query: write SQL to define the values in the set. The query will run each time the monitor is run, so the set values may change.

Previously, "From a list" was the only way to define a set. These new options make it easy generate large sets and keep them automatically updated as your data evolves. They are ideal for referential integrity checks and scenarios where you have large numbers of allowed values.

dbt and Airflow alerts will now be raised on ALL tables in Monte Carlo – whether the table is muted/monitored or not.

The alerts can be configured on a Job-level basis for each integration.

dbt

To configure which dbt Jobs will raise alerts, go to Settings -> Integrations -> dbt integration -> Edit and find the below configuration.

Learn more at dbt Failures As Monte Carlo Alerts

Airflow

To configure which Airlow Jobs will raise alerts there are two options:

  1. Go to Settings -> Integrations -> Airflow integration -> Configure Jobs and find the below configuration:

  2. Under Assets, search and navigate to the Airflow Job that you want to configure alerts for. On the top right, toggle "Generates alerts".

Learn more at Airflow Alerts and Task Observability

dbt snapshot and seed errors are now available in MC as alerts, alongside model and test alerts. Users can go to settings -> dbt integrations -> edit, to configure the option to send those alerts. Make sure to add the new alert types in the relevant audiences to receive notifications. (docs)

snapshot errors in alert feed

snapshot errors in alert feed


Configure alerts options in Settings

Configure alerts options in Settings

With the availability of SQL query history, a series of features for Databricks integration are added:

  • Performance dashboard and monitors: the dashboard helps identify the slowest SQL queries and enables investigation on performance issues. Users can also use performance monitors to detect slow running SQL queries.
  • Importance scores: estimates the importance (0 to 1) of assets based on various query history data (see details here).
  • Usage stats: usage information like reads/day, writes/day, users etc are now available on the "assets" page, "general information" tab.
  • Query logs: SQL query logs are now shown on the assets page
  • Query Change RCA insights: associated SQL query changes are presented for a volume / freshness / field alert to help uncover query related root causes.

Limitations: note these features are available for assets on Unity Catalog and are constrained to SQL queries. If you are using customer-managed keys in Databricks, these features also will not be supported.

Setup required: In order to enable these features, read permission needs to be granted to the service principal for system table system.query.history. This is also described in docs here.

GRANT SELECT ON system.query.history TO <monte_carlo_service_principal>;
Usage stats

Usage stats

Performance Dashboard for Databricks SQL queries

Performance Dashboard for Databricks SQL queries

Databricks Query Logs

Databricks Query Logs

Query Change Insights in Incident

Query Change Insights in Incident