Table
Monte Carlo makes it easy to instantly deploy broad monitoring of your data pipelines, without manually configuring any thresholds. It learns the normal patterns of updates, size changes, and size growth, and alerts when those patterns are violated. This is ideal for detecting breakages and stoppages in the flow of data.
For regularly updated tables, Monte Carlo can typically generate thresholds after 7 days of observing a table, and thresholds will be mature by 14 days. At most, monitors will incorporate a 6-week rolling window of training data to determine thresholds, including handling of weekly seasonality.
The sensitivity of thresholds can be adjusted between High, Medium, and Low. Users may also choose a manual threshold, instead of relying on thresholds generated by machine learning. Learn more about sensitivity settings.
To configure table monitors as code, see the Table Monitor MaC reference.
In most cases, Table Monitors use metadata instead of directly querying the table. Coverage includes:
- Freshness: alerts to unusually long periods of time between updates or changes in size (row count or bytes)
- Volume: alerts to unusual changes in size
- Schema change: alerts to changes in the schema of the table (no machine learning involved here)
Use AI agents to get the best coverage on your most critical data assets and configure monitors with a single click. Find Operations agent in our UI and just ask! You could also do this in Claude, Cursor and other AI agents by installing our Agent Toolkit and using our MCP tooling.
Creating Table Monitors
Table monitors can be created from the Create Monitor page or Assets page. Configuration steps include:
Choose tables
Table monitors are designed to be applied to pipelines, schemas, or data products, in order to alert to broad outages and breakages. Start by selecting which assets to monitor by first choosing a warehouse. Users can select the entire warehouse, or specific databases or schemas within.
User can then refine their selections by adding filters or exclusions based on:
- Table name. Operators include: starts with, ends with, contains, matches pattern.
- Table tags. Operators include: is one of, has all.
- Useful to filter for specific Data Products or Domains. Assets are automatically tagged with the Data Products and Domains they are a part of.
- Table type. For example, if you would like to exclude Views.
- Read activity. For example, if you would like to filter just for assets with read queries in the past 14 days.
- Write activity. For example, if you would like to filter just for assets with write queries in the past 14 days.
- Read or write activity. For example, if you would like to filter just for assets with read or write queries in the past 14 days
- Row count change. For example, if you would like to filter just for assets with changes in row count in the past 31 days.
In addition to these criteria, the Table Monitor will also be filtered by the Domain that the user currently has selected in the top navigational bar.
A preview of the assets that match your criteria is available at the bottom of this section. The list of tables that match your criteria will be refreshed with each run of the monitor.
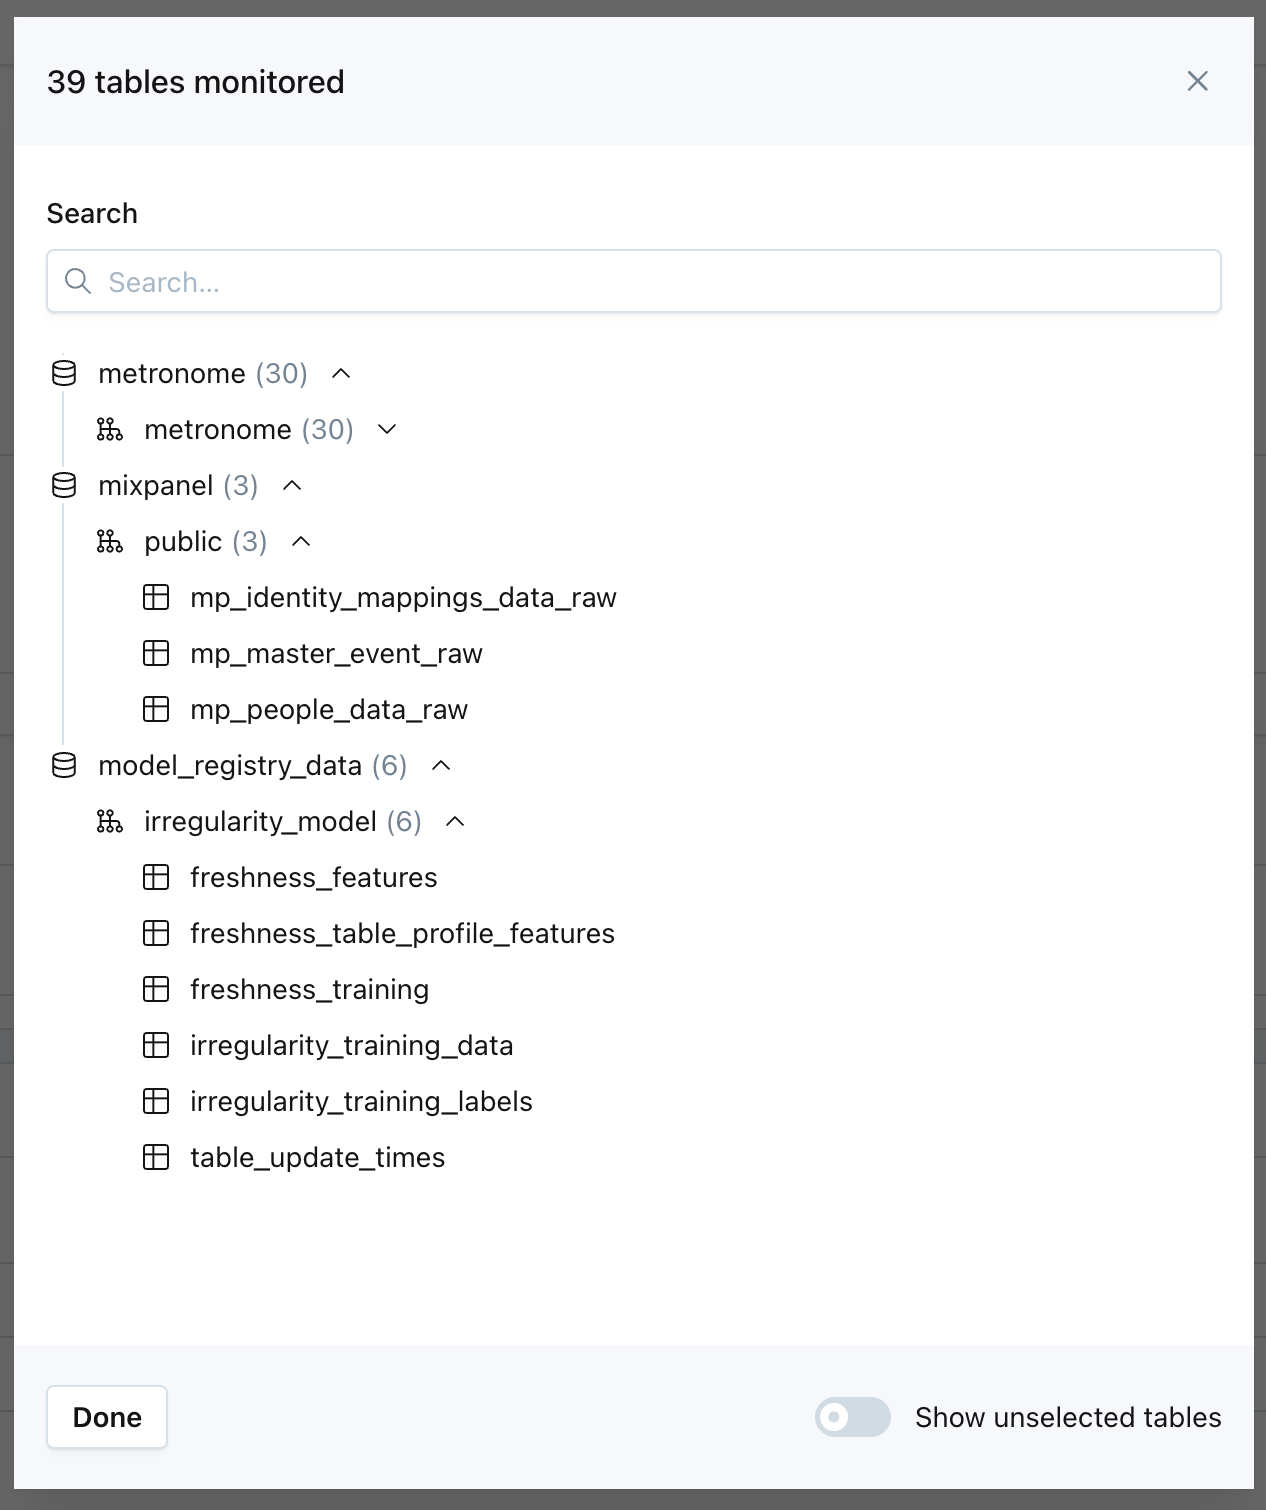
Users can easily preview the list of assets that will be monitored, based on the criteria they set.
Once created, the Table Monitor continuously evaluates ingested assets against the selected criteria, automatically adding assets that meet the criteria and removing assets that no longer do.
Alert conditions
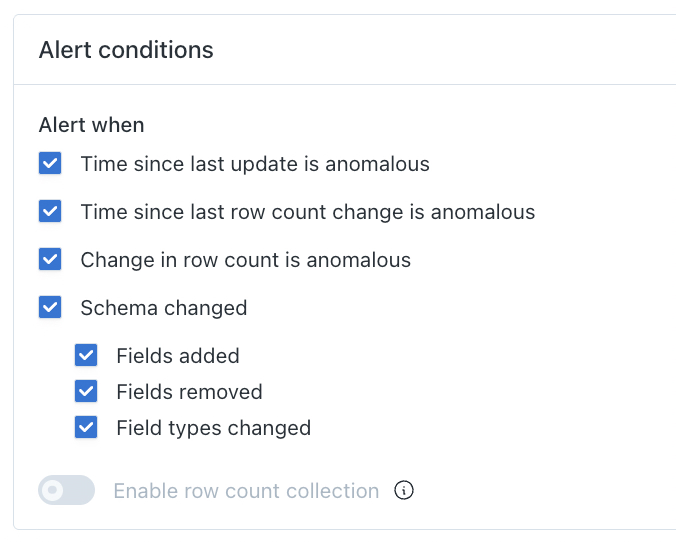
When creating a Table Monitor, users can choose to be alerted when:
- Time since last update is anomalous
- Change in row count is anomalous
- Time since last row count change is anomalous
- Schema is changed
- Fields added
- Fields removed
- Field types changed
By default, table monitors use automated thresholds based on machine learning that do not need to be defined by a user. To change sensitivity across the Table Monitor, see Automatic threshold sensitivity below. To set a manual threshold, disable alerting, or change sensitivity for a specific metric on a specific asset, go to the Asset page, click the more options (⋮) menu on the chart for that metric, then select Edit monitor.
Row count collection
Whenever possible, Table Monitors use metadata to minimize the workload on your warehouse. However, some asset types (such as Views) and certain integrations don't expose row count metadata. For these assets, you can enable row count collection, which runs a COUNT(*) query to collect row counts directly and enable Volume and Freshness (Time since last row count change) monitoring. Some platforms provide volume tracking through byte count metadata — on these platforms, row count collection is an optional addition to add row-level granularity.
Each qualifying asset is queried via a
COUNT(*)query each hour. For large tables or monitors with many qualifying assets, this can increase warehouse compute costs and affect performance.
Enabling row count monitoring
To enable row count monitoring, row count collection must be enabled. This can be enabled in one of two ways:
- At the Table Monitor level, which applies to all qualifying assets in the monitor's scope — including any that match in the future. Set this in the UI or, for via Monitors as Code
- At the asset level, where you can also apply a
WHEREclause filter to theCOUNT(*)query — useful for large tables where filtering to recent partitions or active segments can significantly reduce query cost and improve performance. Set this on the asset’s summary page viaEnable row count monitoring, or via the toggleSizeCollection API.
Asset-level settings always take precedence over the Table Monitor setting. If row count collection is explicitly disabled on an asset, the Table Monitor will not override it. If an asset is covered by multiple Table Monitors, row count collection is enabled if any of them has it turned on.
Automatic threshold sensitivity
Sensitivity is a threshold tuning option that controls how readily monitors alert on anomalies. Users can optionally change sensitivity at the Table Monitor level to:
- Low
- Medium (this is the default option)
- High
The selected sensitivity applies to any of the alert conditions enabled in the Table Monitor (Volume, Freshness, and/or Time since last row count change) across every in-scope asset, including assets that come into scope later.
For granular control, sensitivity can be changed at the asset-level, which overrides the Table Monitor setting. If an asset is covered by multiple Table Monitors with conflicting settings, the lowest sensitivity wins. All sensitivity changes are captured in the monitor change log, including the source (user or Table Monitor) and from/to values.
Learn more about sensitivity settings.
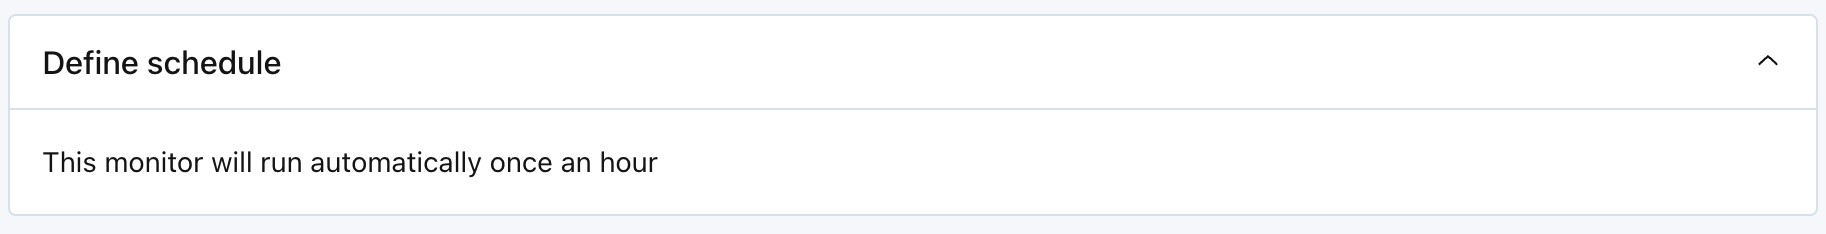
Define schedule
By default, table monitors run hourly. This default cannot be changed when using automated thresholds. However, the schedule can be customized when using manual thresholds. This can be done on the Asset page by clicking Tune Model, then Edit Monitor on the chart for that metric, then switching to Explicit threshold.
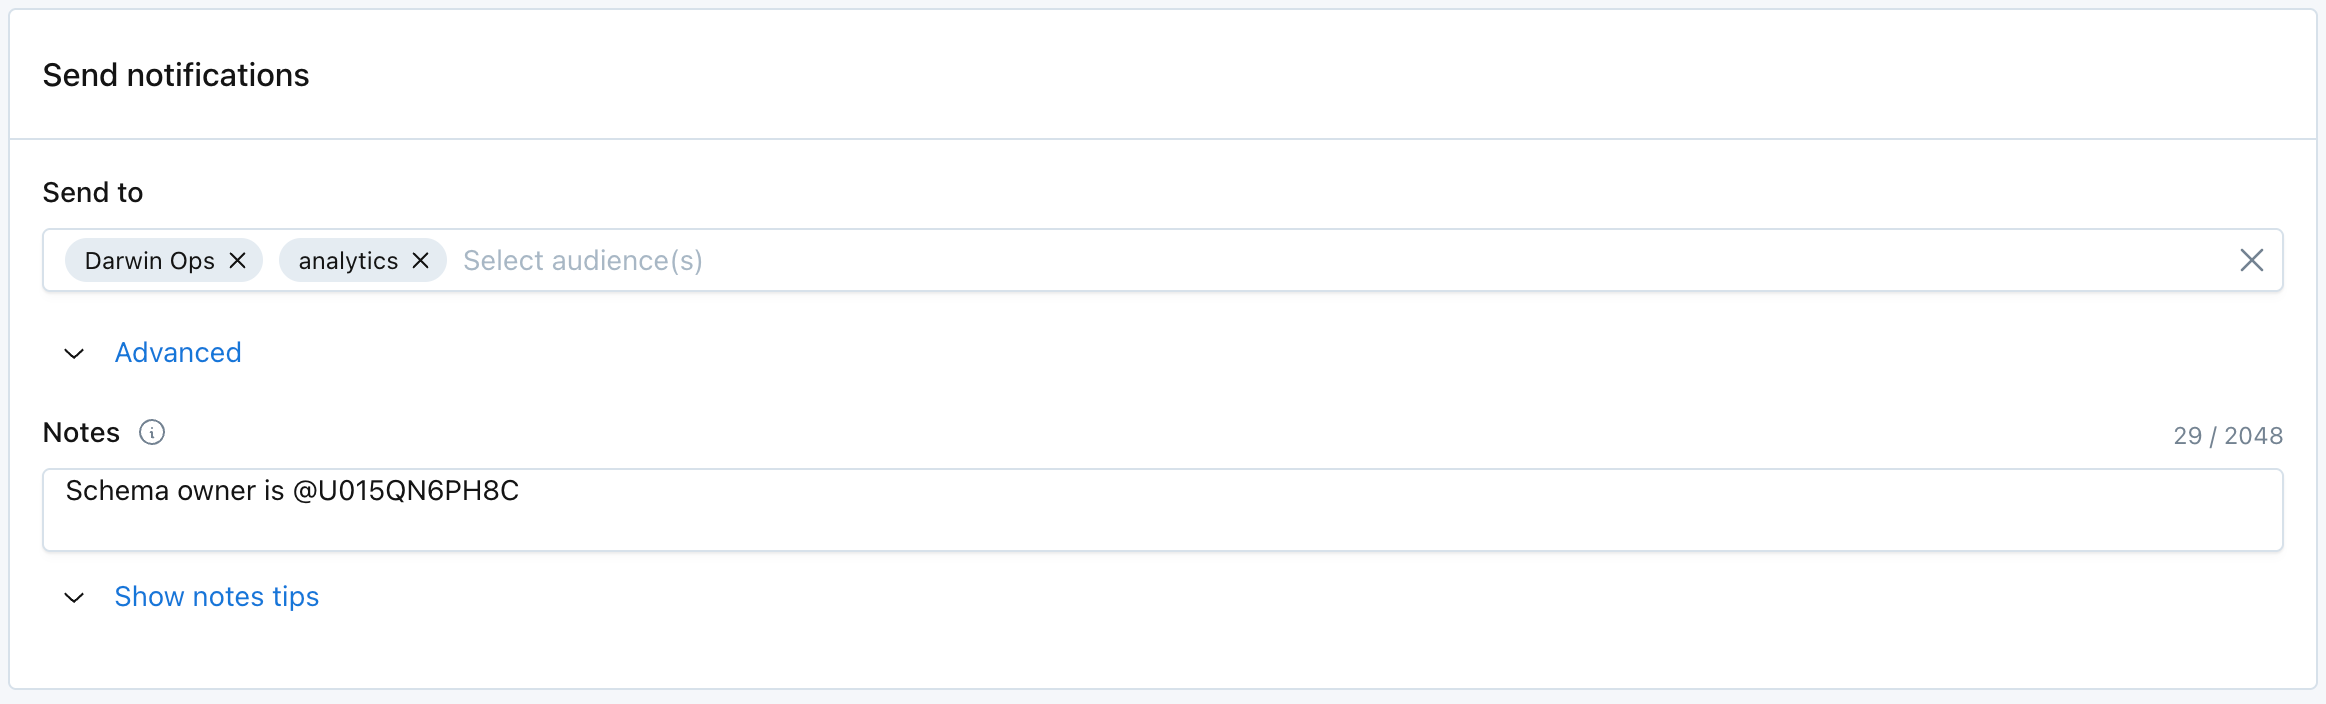
Send notifications
Select which audiences should receive notifications when anomalies are detected.
Text in the Notes section will be included directly in Alert notifications. The "Show notes tips" dropdown includes details on how to @mention an individual or team if you are sending notifications to Slack.
Notes support rich-text formatting, including bold, italic, underline, strike-through, lists, links, and code blocks. Rich-text channels display these styles, while text-only channels show a plain-text equivalent.
Monitor properties can be dynamically inserted into Notes through variables. Supported variables include Created by, Last updated at, Last updated by, Priority, and Tags.
Advanced settings exist for managing failure notifications.
Add details
Assign the monitor a:
- Title (required). This will be inherited as the name of alerts generated by the monitor.
- Priority (optional). This will be inherited as the priority of alerts generated by the monitor.
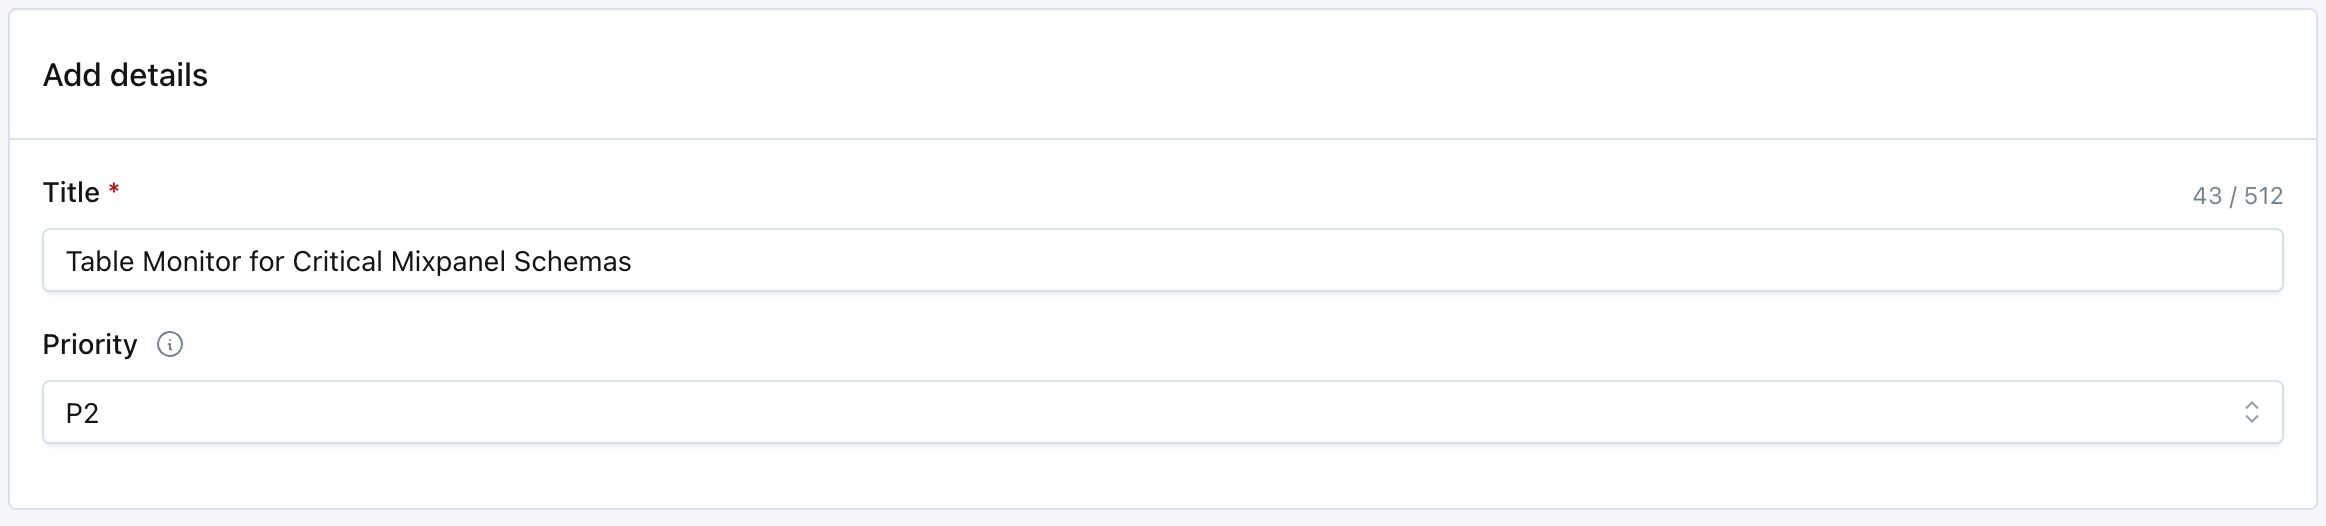
Table Monitors can also be created or updated programmatically via the createOrUpdateTableMonitor API operation.
Domains
Table monitors are subject to domain access controls. This ensures that visibility, edit rights, and alert routing respect the same domain boundaries applied across your organization.
-
Visibility Rules
-
A Table Monitor is only visible to:
- Users with access to the domain(s) explicitly associated with the monitor, or
- Users without domain restrictions.
-
Users restricted to a specific domain will not see Table Monitors created under “All Domains” (i.e., monitors without a domain association), even if the monitored tables belong to their domain.
-
-
Domain Assignment
- When creating a Table Monitor within the UI, the monitor automatically inherits the currently selected domain context.
- Monitors created at the global (“All Domains”) level are accessible only to unrestricted users.
- Updating a monitor’s domain association requires recreating the monitor under the desired domain.
Multi-domain monitoring
-
Unrestricted users
- Users without domain restrictions may create Table Monitors that span multiple domains.
- Such monitors will be visible only to other unrestricted users.
-
Domain-restricted users
- Users limited to a single domain can only create or view monitors within that domain.
- Even if a monitor’s filter criteria (e.g., schema, tag, or regex) reference tables from multiple domains, the user will only see and manage monitors explicitly tied to their own domain.
Overlapping coverage
When a table is covered by multiple Table Monitors that share the same alert condition, each monitor will generate a separate alert for the same anomaly. The sections below cover best practices for scoping monitors to minimize overlap.
Monitoring with Domains and Data Products
It’s important to understand how Table Monitors relate to Domains and Data Products. This will help you set up alerting in a way that aligns with team ownership while minimizing maintenance overhead.
Principles
- Domains represent teams. They own and manage their own monitoring and alerting.
- Data Products represent tables that are critical to stakeholders.
- Each team should manage its own monitors. If another team depends on a Data Product, they should request the owning team to monitor it.
Best Practices for Monitoring Data Products
-
Use one Table Monitor per domain per warehouse.
- This keeps monitoring centralized and avoids alert duplication.
- The Table Monitor is automatically scoped to the team’s domain during creation.
-
Add new Data Products to the existing Table Monitor.
- When a new Data Product is created, the owning team can add it to their Table Monitor.
- This ensures consistent coverage without proliferating monitors.
-
Choose the right construct for monitoring.
- Data Products are powerful for modeling business use cases (e.g., financial reporting).
- For upstream or ingestion teams schemas may be a better fit for scoping Table Monitors.
- The key is to align monitoring with team ownership and what matters most.
Example
- A Finance domain creates a Table Monitor scoped to its warehouse and adds all Data Products tied to reporting.
- An Ingestion domain instead creates Table Monitors at the schema level, since their ownership is tied to source data pipelines rather than specific Data Products.
Updated 25 days ago