Usage
The Usage UI lets you manage what data assets are ingested and monitored by Monte Carlo.
- Ingested tables are all unique tables (tables, views, external tables) with metadata and lineage in Monte Carlo. Ingested tables will show up under Assets and will be available in lineage
- Monitored tables are all unique tables (tables, views, external tables) monitored for downtime by Monte Carlo.
Ingested vs Monitored tablesTables that are enabled for monitoring can have Monitors set up for them and will raise alerts and send notifications if data quality issues occur.
If a table is ingested but not monitored, you will NOT be able to view monitoring data, see alerts, nor receive alerts for that table.
Benefits of the Usage UI
- Consolidated controls give you one place to manage what is ingested and monitored
- By default, no tables will be monitored
- Specify rules for what groups of tables you want to monitor.
- Specify rules for what schemas you do not want to ingest.
How this was managed previouslyPreviously, ingested tables were managed by going to Edit for the Data Lake and Warehouse under Integrations and selecting the "Filtering" tab to choose what Databases and Schemas to ingest. Additionally, Monte Carlo previously monitored all tables by default and you managed what was not monitored by Muting Schemas and Tables. These features are deprecated.
Access
The Usage UI is accessible to users with Account Owner, Domain Manager or Editor roles. Learn more about these roles under Managed Roles and Groups.
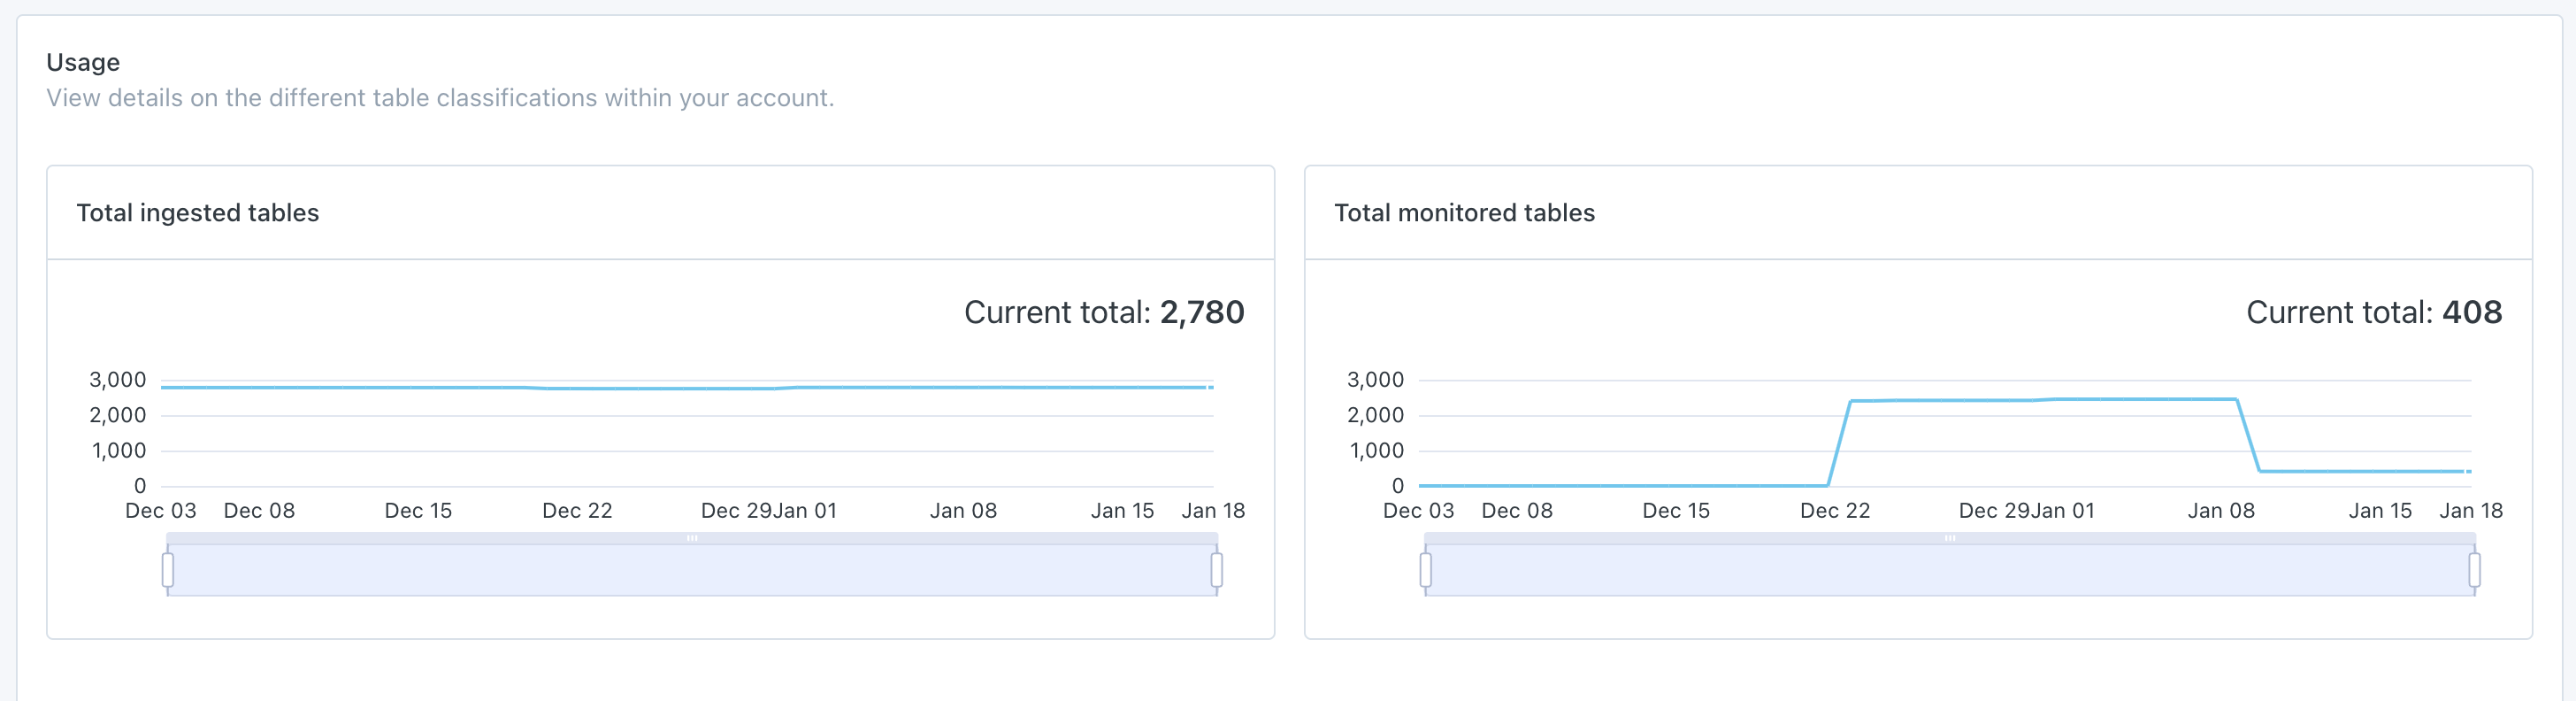
Total Table Counts
Two charts are available in the Usage UI, Total ingested tables and Total monitored tables. Both charts show daily totals for up to 90 days.
Timing of UpdatesUsually, monitoring takes effect immediately, based on new or updated usage rules. If a new table appears, it can take up to 8 hours for the monitoring rules to apply to it from the time when Monte Carlo first ingests it.
Using the Usage UI
Configure ingestion
- On the Usage page the Data Lakes and Warehouses will show all Integrations that can be configured. Select an integration to configure by clicking on its name.
- Under the Integration, you will see a list of Databases that Monte Carlo can see. Each Database can be toggled on/off for ingestion. Select the Database name you want to configure or select "Set up" under the Monitored tables column.
- Within each Database, you will see a list of visible schemas. You can control which schemas to ingest by specifying rules. By default, all schemas are ingested into Monte Carlo and exclude rules can be applied. Select "Add exception rule" to add a new rule. Multiple rules can be added. You may schemas by name with the following conditions:
- Exact match
- Starts with
- Ends with
- Contains
- Matches Regex
- After selecting "Save", the "Ingested" and "Excluded from Ingestion" tabs at the bottom will be updated to reflect what schemas in that database are being included/exclude from ingestion. The numbers in the header will also be updated to reflect the total counts on ingested and monitored tables
Tables must be ingested to be eligible for monitoringA table must first be ingested before monitoring can be enabled for it. Ensure that you are not excluding a schema from ingestion that you want to enable monitoring for.
Best practices when using regex pattern for ingestionPlease adhere to the following guidelines to ensure clarity, compatibility, and efficiency for your ingestion. Misconfigured or burdensome regexes can hamper the critical ingestion pipeline:
- Simplicity in Patterns: Utilize straightforward regex patterns. Complicated constructs like negative lookaheads and word boundaries are not fully supported.
- Automatic Anchors: Our system automatically prepends
^and appends$to your regex patterns. Please do not include these characters in your patterns. If you need to use them, please reach out to our support team to learn more.- Ingestion rules are sensitive to the specific integration they are used for. For clarity, all regex patterns must adhere to POSIX standards. We strongly recommend selecting regex patterns that are compatible with the following technologies:
- PostgreSQL
- Python 3+ : re library
- The applicable database: the same regex pattern needs to work when querying the specific database, as the rule is evaluated there.
Configure monitoring
- Under the appropriate Database on the Usage page, select the Schema that contains tables you want to enable monitoring for.
- By default, no tables are monitored in a Schema. Select "All tables" or "Select tables" at the top under Monitor rules to enable monitoring. For "Select tables" there are several rules types you can use to both include or exclude tables from being monitored:
Rule type | Description | Supported operators |
|---|---|---|
Table name | Match off of a table name | Starts with |
Table type | Match off of the type of table | is |
Table tag | Match off of tags that exist on a table | is one of |
Read for write activity | Defined as read or write activity to the table within the specified range. | 7-31 days |
Write activity | Write activity on the table within the specified range | 7-31 days |
Read activity | Read activity on the table within the specified range | 7-31 days |
All tables | Matches all tables | -- |
- After selecting "Save", the Monitored and Not Monitored tables at the bottom will update to reflect what tables are monitored and not monitored based off the rules you have applied. The numbers in the header will also reflect the updated total counts.
Rules are case-sensitiveBe aware that schema and table names are case-sensitive when specifying patterns for exclusion from ingestion or inclusion in monitoring.
Using the "Table Name: Matches pattern" ruleUse "*" to match one or more characters.
For example, specifying the pattern "prod_*_table" would match a table by the name "prod_1_18_snapshot_table"
Tip: Exclude just a few tablesSpecify "All tables" in your monitor rules then add a few "Except table name" rules if you want to monitor most of a schema but exclude a few tables.
Steps to migrate to the new Usage UI
Since we are switching from an exclude model (where you muted what not to monitor) to an include model (where you choose what you DO want to monitor) we will need your help setting up what you do want to monitor. Here are the steps we would ask you to take:
-
Navigate to the Usage page.
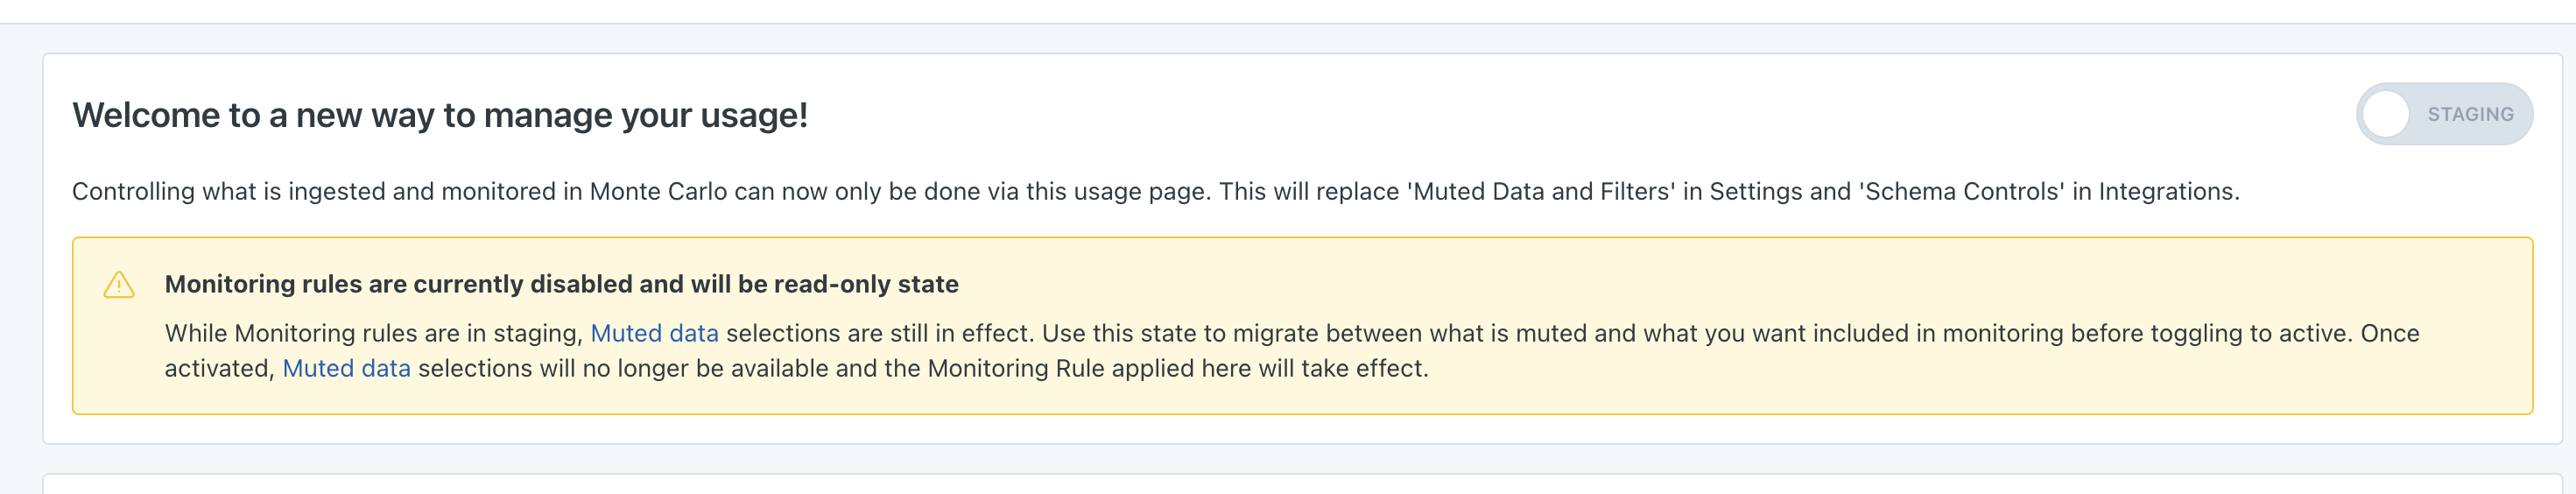
-
You will see a banner at the top that indicates this is currently in "Staging". This means that changes here to what tables are monitored will not take effect until you toggle this to "Active".
-
-
Under Data Lakes and Warehouses, you will see the integrations you currently have set up. They will show Monitored tables: 0 for each currently.
-
Click into each integration and into each Database that you want to enable monitoring on.
-
Beside each Schema you will see an "Enable" button under the Monitored Tables column. Selecting this will start monitoring All tables in that schema.
- If you want to be more selective on exactly what tables to monitor in that schema, you can select the Schema name and choose "Select tables" under Monitor rules. Make sure to click "Save"!
-
As you specify what tables you want to monitor for each schema, you will see the numbers at the top of the page reflect the total rollup count at each level.
-
Once you have specified the necessary rules on what tables to monitor, toggle the switch in the top banner to "Activate" these new rules.
Make sure your tables are being monitored!Once you "Activate" these new rules, ensure that the Total Monitored Tables number shows the number of tables you expect to be monitored. If it shows "0" nothing is being monitored and you won't receive alerts on data quality issues! Check back through each Database and Schema to make sure you have applied and Saved your rules.
See a video walkthrough
Export list of monitored tables
A CSV export can be downloaded from the Total Monitored Tables card in the Usage UI. The download will include all current monitored tables at that point in time. Changes to the monitoring rules in the Usage UI will be immediately reflected in any subsequent downloads of the csv.
Columns included in the export: Integration, Database, Schema, Table Name, Type, Importance Score, Last Activity
CLI
Management of the collection block list is supported on CLI v0.40.0+. View CLI docs here: https://clidocs.getmontecarlo.com/
You can see which schemas and entities you already have specified to be blocked from collection using the get-collection-block-list command.
% montecarlo management get-collection-block-list --help
Usage: montecarlo management get-collection-block-list [OPTIONS]

  List entities blocked from collection on this account.

Options:
  --resource-name TEXT  Name of a specific resource to filter by. Shows all
                        resources by default.
  --help                Show this message and exit.
You can make changes to the collection block list using the update-collection-block-list command.
% montecarlo management update-collection-block-list --help
Usage: montecarlo management update-collection-block-list [OPTIONS]

  Update entities for which collection is blocked on this account.

Options:
  --add / --remove                Whether the entities being specified should
                                  be added or removed from the block list.
                                  [required]
  --resource-name TEXT            Name of a specific resource to apply
                                  collection block to. This option cannot be
                                  used with 'filename'. This option requires
                                  setting 'project'.
  --project TEXT                  Top-level object hierarchy e.g. database,
                                  catalog, etc. This option cannot be used
                                  with 'filename'. This option requires
                                  setting 'resource-name'.
  --dataset TEXT                  Intermediate object hierarchy e.g. schema,
                                  database, etc. This option cannot be used
                                  with 'filename'. This option requires
                                  setting 'resource-name', and 'project'.
  --collection-block-list-filename TEXT
                                  Filename that contains collection block
                                  definitions. This file is expected to be in
                                  a CSV format with the headers resource_name,
                                  project, and dataset. This option cannot be
                                  used with 'resource-name', 'dataset', and
                                  'project'.
--help Show this message and exit.- Resources are Monte Carlo integrations
- Projects would be a metastore in Databricks (like
hive_metastore) or database in Redshift - Datasets would be a schema in Databricks or Redshift

GraphQL API
- Manage which databases or schemas are excluded from ingestion.
- Get list of rules: GetCollectionBlockList
- Add a rule: addToCollectionBlockList
- Remove a rule: removeFromCollectionBlockList
- Update the list of rules: ModifyCollectionBlockList
- ⚠️Caution⚠️ The complete list of rules to apply must be specified in the update. Take care to not wipe out all your rules!
- Manage which tables are included for monitoring.
- Get list of rules: getMonitoredTableRuleList
- Update the list of rules: updateMonitoredTableRuleListAsync. This also be used to remove/add new rules.
- ⚠️Caution⚠️ The complete list of rules to apply must be specified in the update. Take care to not wipe out all your rules!
Limitations
- The following Integrations are not currently supported for configuration under the Usage UI
- Glue
- Pinecone
- Kafka; Confluent
- There is currently a limit of 100 table monitor/except rules within a given schema.
- The criteria for a rule may only contain up to 255 characters.
Common questions
Q: I make a change in my rules that significantly increased the tables I wanted to monitor, will I be charged for these?
- A: Our pricing model is designed to reflect your overall daily usage and we generally charge for all distinct tables, views and externals observed during the day. That said, our billing system is currently based on periodic snapshots of your monitored tables, and so short lived changes in what is monitored will typically not be reflected in your total charge for that day.
Troubleshooting
The Current Total for Total monitored tables chart and the Monitored Tables column doesn't match
This is due to the Usage UI still being in "Staging" mode. While Monitoring rules are in staging, Muted data selections are still in effect and the Current total number for the Total monitored tables chart will be respecting the muting data toggles you have in place and will be showing the total of non-muted tables.
Once the toggle is moved to "Active" the Current total number for the Total monitored tables chart will match the sum of the Monitored tables column in the Data lakes and Warehouses section at the bottom of the page.
Use this "Staging" state to migrate between what is muted and what you want included in monitoring before toggling to active. Once activated, Muted data selections will no longer be available and the Monitoring Rule applied here will take effect. For more details, refer to Steps to migrate to the new Usage UI
Updated about 2 months ago