
Data exports
Overview
Monte Carlo's data exports make it easy to access and analyze critical metadata about your Data + AI Observability platform. It replaces our legacy "Insights" reports with a more aligned, flexible, and transparent approach to exporting Monte Carlo data.
With data exports, you can retrieve structured information on Monitors, Alerts, Events (the underlying events in an alert), and Assets—directly from the UI, via API/CLI, or through Snowflake data shares. These exports are refreshed daily and mirror what you see in Monte Carlo, allowing for easy integration into internal workflows, self-service reporting, and deep analysis.
For users seeking logs of each individual executions of a monitor, we recommend Monitor logs. This allow users to send detailed monitor execution logs to external systems via webhooks. Though it is a separate feature from data exports, the data is designed to be easily joined with data from Exports. Monitor logs are sent close to real-time and are useful for organizations that want to centralize auditing and compliance in their own tools or platforms.
A fifth data export, Consumption, is also available for customers on consumption pricing plans. It is available through the UI from the Settings > Billing page, via API/CLI, or through Snowflake data shares.
Monitor Runs, currently in private preview, exports the observed value and the threshold band it was evaluated against for each monitor execution. It is available via API/CLI or through Snowflake data shares, and joins to the other exports on the monitor ID.
Data exports are available to workspaces on the Scale and Enterprise plans.
Key Benefits
- Rich, structured data for Monitors, Alerts, Events, and Assets
- Reliable, daily-refreshed exports that match what you see in Monte Carlo
- Download directly from relevant Monte Carlo product pages for one-off analysis
- Snowflake private listing data share, configurable self-serve via the UI
Access methods
| Method | Description |
|---|---|
| UI | Navigate to Monitors, Alerts, or Assets pages and download CSVs. |
| API / CLI | For programmatic access. |
| Snowflake | Access shared tables via a Snowflake private listing. Configure in Settings → Data sharing. |
| BigQuery | Example script to export from the CLI coming soon. |
| Databricks | Example notebook to export from the CLI coming soon. |
Note: The Alerts export includes both Alerts and their related Events.
CLI
Follow the CLI guide to get set up and see the export CLI docs for more information. Direct download and direct upload to S3 are both options.
API
Data exports are also available programmatically through the GraphQL API at https://api.getmontecarlo.com/graphql. See API Authentication to create a key and authenticate your requests.
Use the getDataExportUrl query to get a short-lived, presigned URL for the latest version of an export, then download the CSV from that URL — see DataExportURL in the API reference for the query and response shape. dataExportName accepts MONITORS, ALERTS, EVENTS, ASSETS, ALERTS_AND_EVENTS, MONITOR_LOGS, and CONSUMPTION.
Snowflake data share
For Snowflake users, we offer the ability to use data exports via Snowflake's Data Sharing capabilities. This is an opt-in feature.
Configuring via the UI
Account owners can enable and manage the Snowflake data share directly in Settings → Data sharing without contacting support.
To enable:
- Click Enable data sharing.
- Provide your Snowflake account details (shown in any Snowflake worksheet):
- Organization —
SELECT CURRENT_ORGANIZATION_NAME();(e.g.ACMECORP) - Account name —
SELECT CURRENT_ACCOUNT_NAME();(e.g.ACME_PROD— the account name, not the account locator)
- Organization —
- Click Enable data sharing to confirm.
Monte Carlo will add your account to the private listing — this can take a few hours to take effect.
To accept the listing in Snowflake:
- In Snowsight, open Data sharing → External sharing.
- Select the Shared with you tab.
- Find the Monte Carlo Data Share listing and click Get to mount the database.
Once mounted, the shared database appears in your Snowflake account and is ready to query.
To update: click Reconfigure on the settings page.
To disable: click Disable on the private-listing share card. You can re-enable at any time.
Migrating from a legacy direct share
If your account uses a legacy direct share (locator-based), it appears as a separate card in Settings → Data sharing. You can migrate to the private listing at your own pace — both share types can run simultaneously, so consumers are never disrupted during the transition.
Option 1 — Run both in parallel (recommended)
- Enable the private listing share as described above.
- Have your consumers accept the new listing in Snowflake and switch their queries to the new database.
- Once all consumers have migrated, disable the legacy share from its card.
Both shares expose the same tables and refresh on the same schedule — consumers can switch at their own pace.
Option 2 — Replace immediately
- Enable the private listing share as described above.
- Confirm your consumers are ready to switch, then disable the legacy share from its card.
- Consumers accept the new private listing in Snowflake. When mounting the database, they can use the same name as the legacy share database — all existing queries and workflows will continue to work without any changes.
Note: Disabling a legacy share is irreversible and cannot be undone via the UI.
FAQs
Are exports filtered by domain or audience?
No. Exports include all relevant records. Users restricted to specific domains do not have access to data exports.
Where can I find the export option in the UI?
Look for export/download buttons within the Monitors, Alerts, and Assets pages. There is no centralized "Exports" tab at this time.
How often are exports refreshed?
Daily. Report generation generally finishes around 11:00 UTC, though there may be some day-to-day variation.
Data export schemas
Each export contains a clean, well-documented schema. Fields are consistently named, and join keys are aligned across exports.
Note: All columns are delivered as
TEXTin the data share regardless of the semantic type shown below. Cast to the appropriate type on read (e.g.TO_TIMESTAMP_NTZ(created_at)).
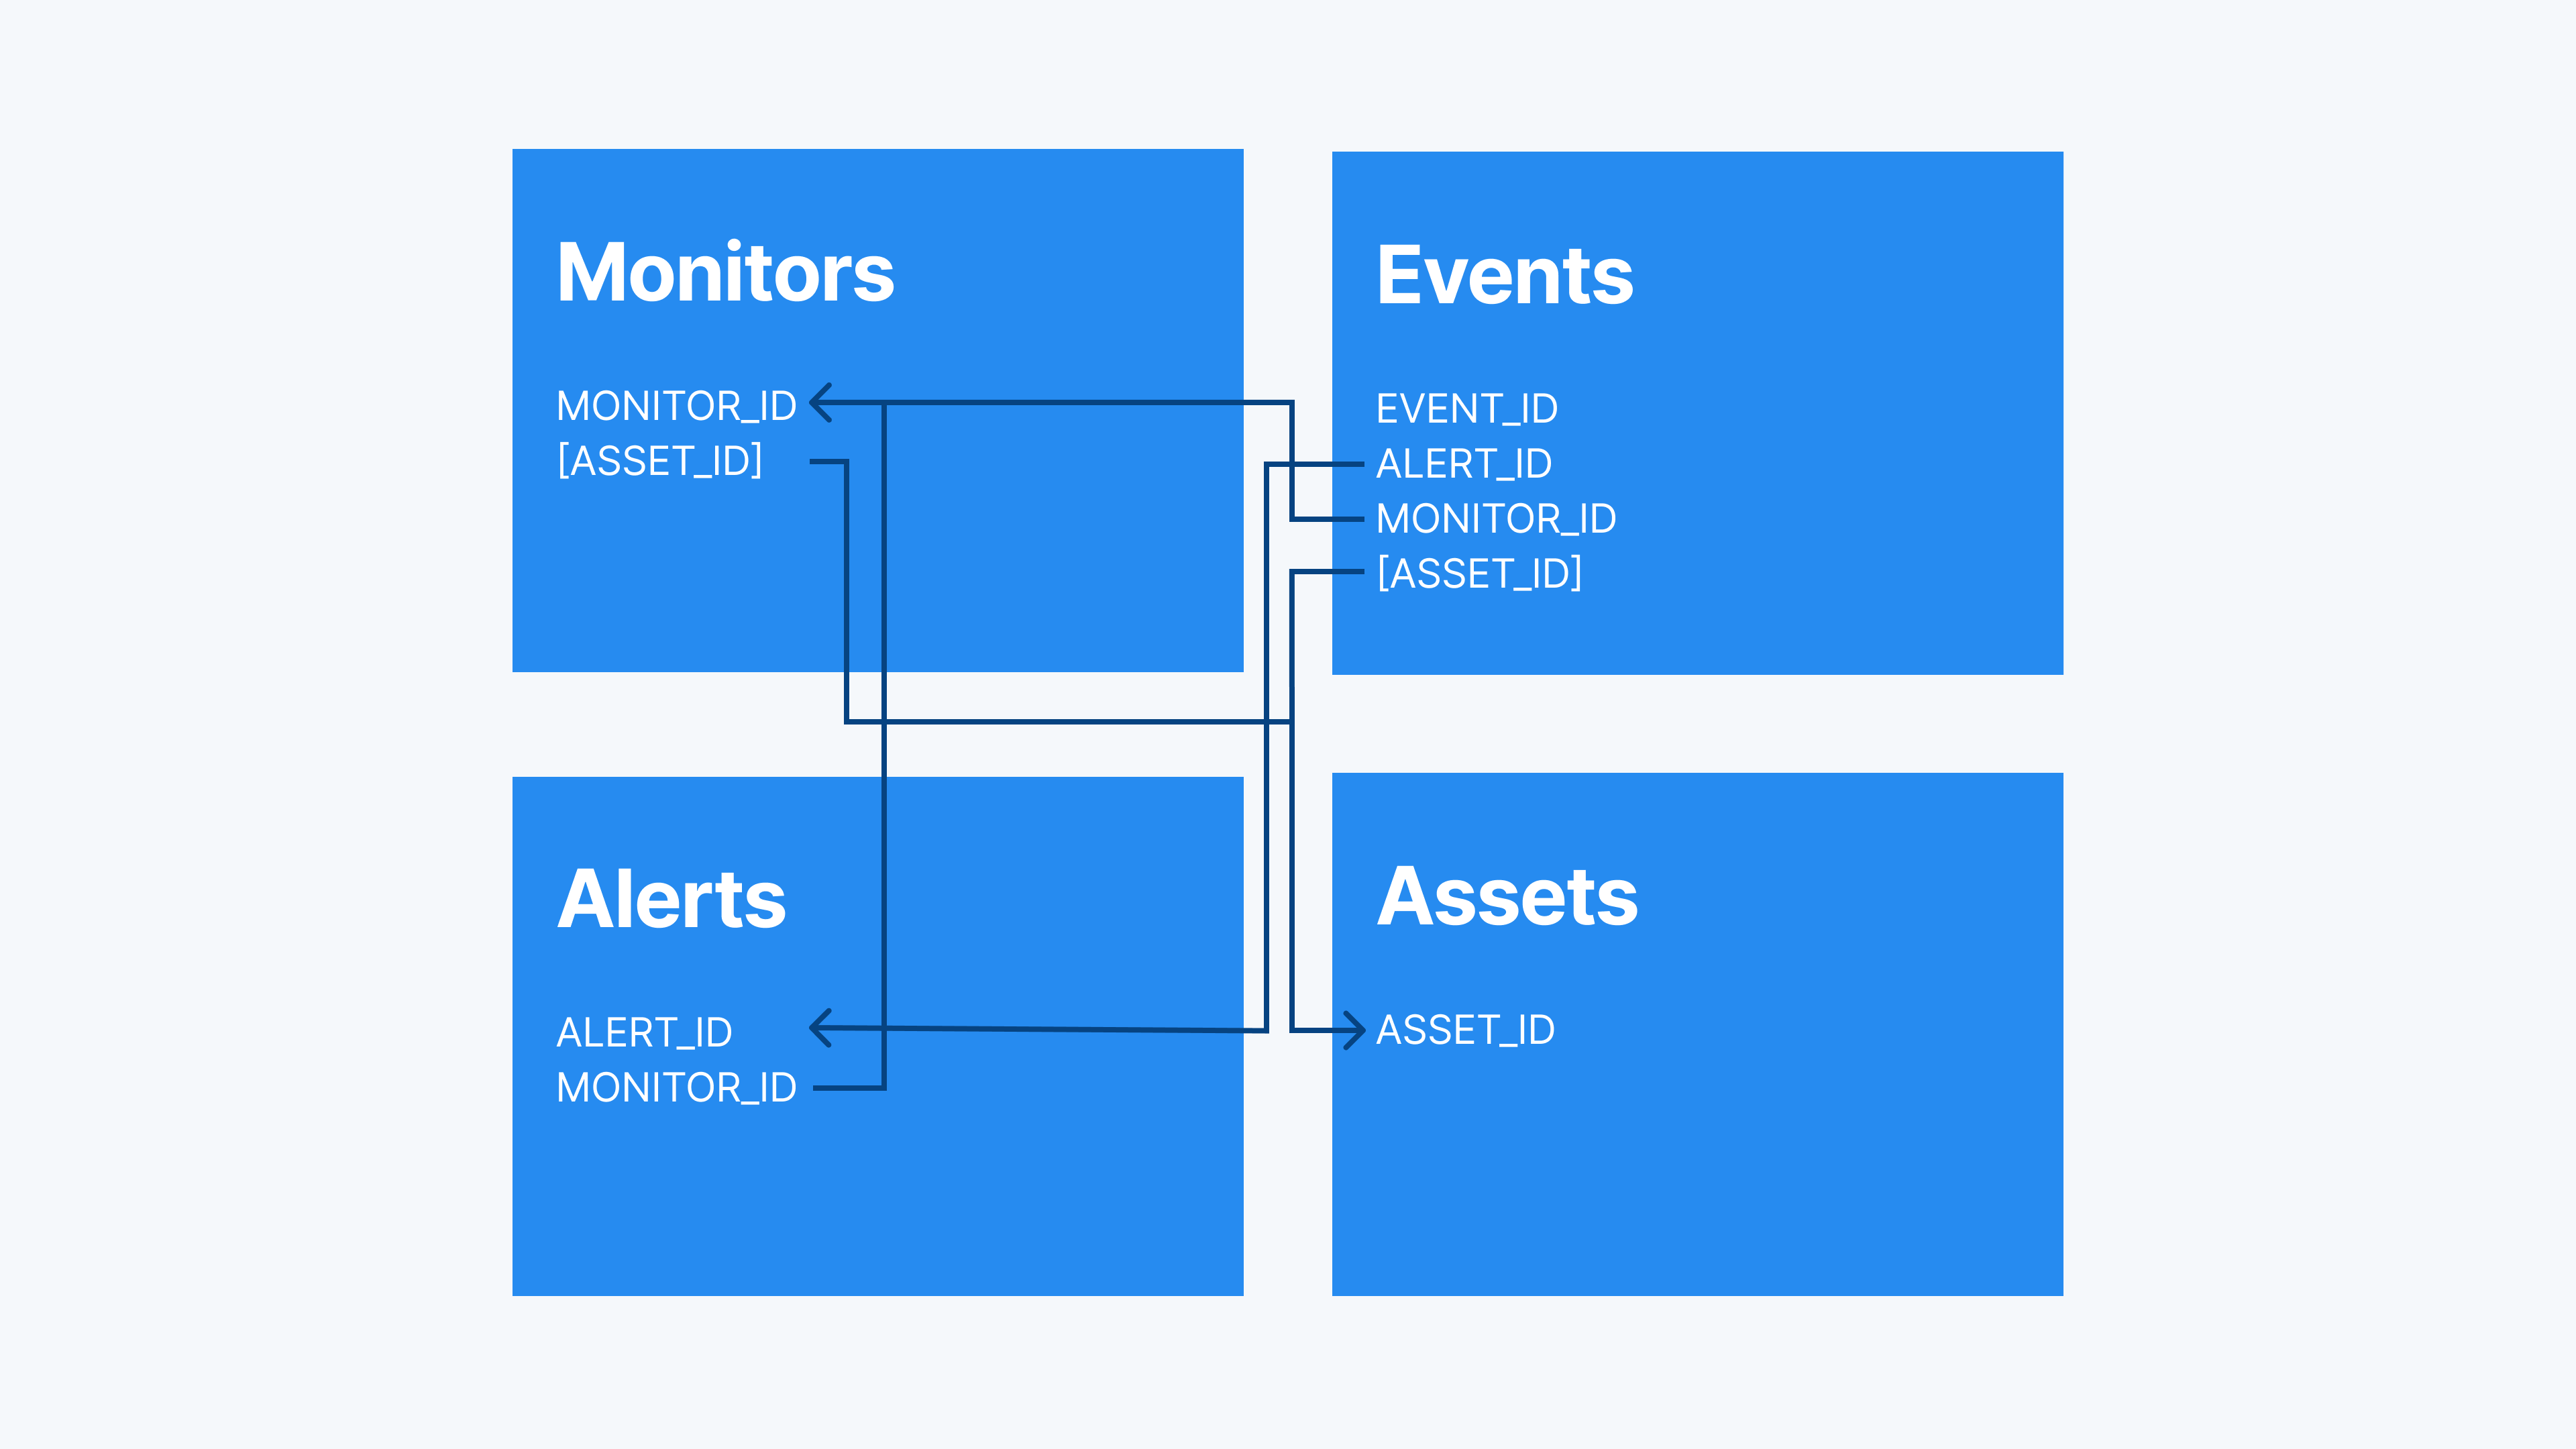
Monitors
| Field | Description | Data Type | Example |
|---|---|---|---|
MONITOR_ID | UUID of the monitor | STRING | 39280e8e-689a-49a8-9ccd-e70b7a7e1bcf |
MONITOR_TYPE | Type of monitor (e.g., validation, custom_sql) | STRING | Validation |
TITLE | Monitor name or description | STRING | SFDC → Account → Account info |
PRIORITY | Priority level | STRING | P3 |
STATUS | Monitor status | STRING | Enabled |
SCHEDULE | Human-readable schedule | STRING | every 1 week(s) starting at Nov 18th 2024 12:30 UTC |
CONNECTION_NAME | Name of the connection used to run this monitor. | STRING | Snowflake Prod |
CREATED_AT | Creation timestamp | TIMESTAMP | 2025-01-02T06:25:13.842Z |
CREATED_BY | Creator email | STRING | [email protected] |
LAST_MODIFIED_AT | Last modified timestamp | TIMESTAMP | 2025-01-06T06:25:13.842Z |
LAST_MODIFIED_BY | Last modifier email | STRING | [email protected] |
IS_DELETED | If monitor is deleted. Deleted monitors are retained for 30 days | Boolean | FALSE |
AUDIENCES | Audience names | LIST | ["data engineering"] |
MONITOR_TAGS | Custom tags | LIST | ["ADDP", "MC-Pilot"] |
DATA_QUALITY_DIMENSION | Dimension category | STRING | Completeness |
ASSETS | Associated assets | LIST | ["raw.monolith_export.warehouse_tables"] |
ASSET_IDS | UUIDs of assets | LIST | ["asset-123"] |
ASSET_COUNT | Number of assets | INTEGER | 42 |
DOMAINS | Associated domains | LIST | ["Prod Analytics", "Gold Datamart"] |
MONITOR_URL | Link to monitor in UI | STRING | https://getmontecarlo.com/monitors/... |
For Table Monitors, the ASSETS and ASSET_IDS fields include up to 1,000 assets per monitor; larger monitors are truncated to the first 1,000. Tip: when syncing exports to Snowflake via Data share, use parse_json(assets) (Snowflake) to query individual assets.
CONNECTION_NAME is not included for table monitors, query performance monitors
Alerts
| Field | Description | Data Type | Example |
|---|---|---|---|
ALERT_ID | UUID of the alert | STRING | 646bb94d-28ec-4ab3-8b2e-283a7bd9e509 |
MONITOR_ID | Associated monitor ID | STRING | 6798620c-a44f-432a-b1cd-e68d585852ba |
DESCRIPTION | Alert message | STRING | Freshness anomalies in [snowflake] analytics:prod |
CREATED_AT | Alert creation time | TIMESTAMP | 2024-09-26T12:04:50.264Z |
STATUS | Current status (e.g., ACKNOWLEDGED) | STRING | Fixed |
FIRST_RESPONSE_TIMESTAMP | Time of first response | TIMESTAMP | 2024-09-27T12:04:50.264Z |
HOURS_TO_FIRST_RESPONSE | Time to respond (hours) | NUMBER | 24 |
RESOLVED_TIMESTAMP | Resolution time | TIMESTAMP | 2024-09-28T12:04:50.264Z |
HOURS_TO_RESOLVED | Time to resolve (hours) | NUMBER | 48 |
OWNER | Owner of the alert | STRING | [email protected] |
PRIORITY | Priority level | STRING | P3 |
IS_INCIDENT | Flag for incident status | BOOLEAN | TRUE |
SEVERITY | Severity level | STRING | SEV-2 |
AUDIENCES | Target audiences | LIST | ["platform_services", "data-engineering"] |
RECIPIENT_CHANNELS | Notification channels | LIST | ["wills-slack-channel", "[email protected]"] |
EXTERNAL_LINKS | Linked issues (Jira, etc.) | LIST | ["https://name.atlassian.net/browse/ST-686"] |
DOMAINS | Associated domains | LIST | ["analytics"] |
ALERT_URL | Link to alert in UI | STRING | https://getmontecarlo.com/alerts/... |
TROUBLESHOOTING_AGENT_RUN | TRUE if troubleshooting agent was used on this alert | BOOLEAN | TRUE |
TROUBLESHOOTING_AGENT_RUN_DATE | Date the agent was run | DATE | 2025-09-07 |
TROUBLESHOOTING_AGENT_RUN_BY | Email of user who ran the agent | STRING | [email protected] |
Events
| Field | Description | Data Type | Example |
|---|---|---|---|
EVENT_ID | UUID of the event | STRING | e1800f7b-0cc4-4345-93aa-4b64c022a9fe |
ALERT_ID | Linked alert ID | STRING | e1800f7b-0cc4-4345-93aa-4b64c022a9fe |
MONITOR_ID | Linked monitor ID | STRING | 0277dba3-226c-473d-b738-51959a7d097e |
JOB_ID | UUID of the monitor execution that generated the event; only for Custom SQL and Validations | STRING | cc66e00b-8275-4d95-9e7b-23f9f8a3dbf4 |
ASSET_ID | Associated asset UUID | STRING | asset-123 |
DATABASE_NAME | Source DB | STRING | raw |
SCHEMA_NAME | Source schema | STRING | monolith_export |
ASSET_NAME | Table or view name | STRING | warehouse_tables |
FULL_ASSET_NAME | Full asset path | STRING | raw.monolith_export.warehouse_tables |
EVENT_TYPE | Type of anomaly | STRING | null_rate |
FIELD | Affected field | STRING | event_app_url |
SEGMENTED_BY | Segment dimension or SQL | STRING | product_type |
SEGMENT | Segment value | STRING | loans |
CREATED_AT | Event timestamp | TIMESTAMP | 2025-01-07T06:25:13.842Z |
ANOMALY_TIMESTAMP | Timestamp of anomaly bucket | TIMESTAMP | 2025-01-06T03:00:00.000Z |
LOWER_THRESHOLD_VALUE | Lower bound | STRING | 0 |
UPPER_THRESHOLD_VALUE | Upper bound | STRING | .0167 |
ACTUAL_VALUE | Observed value | STRING | .35 |
SCHEMA_CHANGES | Changes to schema | LIST | ["fields_added: ['audiences']"] |
DOMAINS | Associated domains | LIST | ["equity_domain", "low_carbon_transition"] |
EVENT_URL | Link to event (if available) | STRING | TBD |
Monitor Runs
Note: This feature is in private preview — reach out to your account representative to request access.
For each monitor execution, the observed value and the threshold band it was evaluated against — one row per time series per run. Only time series with a modeled threshold (an active rule) are included; context-only metrics with no threshold are omitted.
Access: Available via the Snowflake data share, the montecarlo export CLI, and the GraphQL API. It is not available as a UI download.
History: Via Snowflake Data Share, history accrues from when the export is enabled, up to a rolling 90 days. Via API/CLI, the last 2 days of runs are included.
Both static (manual GT/LT/EQ/…) and dynamic (AUTO) thresholds are represented.
| Field | Description | Data Type | Example |
|---|---|---|---|
MONITOR_ID | UUID of the monitor this run belongs to. Joins to MONITOR_ID in the Monitors, Alerts, and Events exports. | STRING | 0277dba3-226c-473d-b738-51959a7d097e |
TIME_SERIES_ID | UUID of the specific time series this run measured | STRING | cc66e00b-8275-4d95-9e7b-23f9f8a3dbf4 |
METRIC | The metric measured on this run | STRING | row_count |
FIELD | The field the metric was computed on; blank when the metric is not field-scoped | STRING | amount |
MEASUREMENT_TIMESTAMP | When the value was measured | TIMESTAMP | 2025-01-06T03:00:00.000Z |
VALUE | The observed value for this run | NUMBER | 4.0 |
THRESHOLD_LOWER | Lower bound of the threshold band for this run. Blank = unbounded on this side | NUMBER | 0 |
THRESHOLD_UPPER | Upper bound of the threshold band for this run. Blank = unbounded on this side | NUMBER | 3 |
IS_BREACH | Whether VALUE fell outside the threshold band. TRUE/FALSE; blank when the run had no threshold. A containment check on the band — not the product's alert decision. | BOOLEAN | TRUE |
SEGMENTED_VALUES | For segmented monitors, the segment values defining this time series, as a JSON array of strings; empty array when not segmented | LIST | ["loans"] |
MONITOR_URL | Link to the monitor in the UI | STRING | https://getmontecarlo.com/monitors/... |
Assets
| Field | Description | Data Type | Example |
|---|---|---|---|
ASSET_ID | UUID of the asset | STRING | asset-123 |
SOURCE_NAME | Integration name | STRING | snowflake-staging |
DATABASE_NAME | Source DB | STRING | raw |
SCHEMA_NAME | Source schema | STRING | monolith_export |
ASSET_NAME | Table or view name | STRING | warehouse_tables |
FULL_ASSET_NAME | Full asset path | STRING | raw.monolith_export.warehouse_tables |
ASSET_TYPE | Object type | STRING | View |
IMPORTANCE_SCORE | Asset importance | NUMBER | .99 |
READS | Count of queries reading the asset from the last 30 days | NUMBER | 512 |
WRITES | Count of queries updating the asset from the last 30 days | NUMBER | 31 |
LAST_READ | Timestamp of most recent query reading the table | TIMESTAMP | 2025-08-04 09:34:27.326000+00:00 |
LAST_WRITE | Timestamp of most recent query updating the table | TIMESTAMP | 2025-08-04 09:34:27.326000+00:00 |
READ_USERS | Count of distinct users executing the queries in READS | NUMBER | 6 |
WRITE_USERS | Count of distinct users executing the queries in WRITES | NUMBER | 4 |
ASSET_TAGS | Custom tags | LIST | ["critical", "finance"] |
DOMAINS | Associated domains | LIST | ["Gold", "analytics"] |
ASSET_URL | Link to asset | STRING | TBD |
Consumption
| Field | Description | Data Type | Example |
|---|---|---|---|
DATE | Date of consumption | DATE | 2025-09-07 |
WAREHOUSE_NAME | Warehouse of monitor | STRING | prod-snowflake |
WAREHOUSE_ID | Warehouse UUID of monitor | STRING | 316ca77a-696c-491c-ac32-11xx4a0cb752 |
MONITOR_TYPE | Type of monitor | STRING | Table |
MONITOR_ID | UUID of monitor | STRING | c4ee57c1-0d8b-4aa9-82ce-73x1d38q435f |
CREDITS_CONSUMED | Credits consumed on that day by monitor | NUMBER | 21.75 |
Updated 3 months ago