Performance
Surface and troubleshoot slow performance of queries and ETL jobs.
How to use the dashboard to solve performance issues
The dashboard can help users proactively identify performance issues, or investigate a known performance issue. It aims to help answer questions such as
- "One of my Snowflake warehouses' cost increased this past week, I want to know what caused it."
- "I want to identify any slow dbt models and optimize the ones that are bottlenecking my dbt job."
- "I want to understand the experience of data product consumers and identify if any dashboard queries need to be optimized to improve the end consumers' experience."
- "I want to know if any Airflow DAG is running slow, running slower overtime, or frequently failing. And I want to know why."
Example 1: Investigate high-cost queries
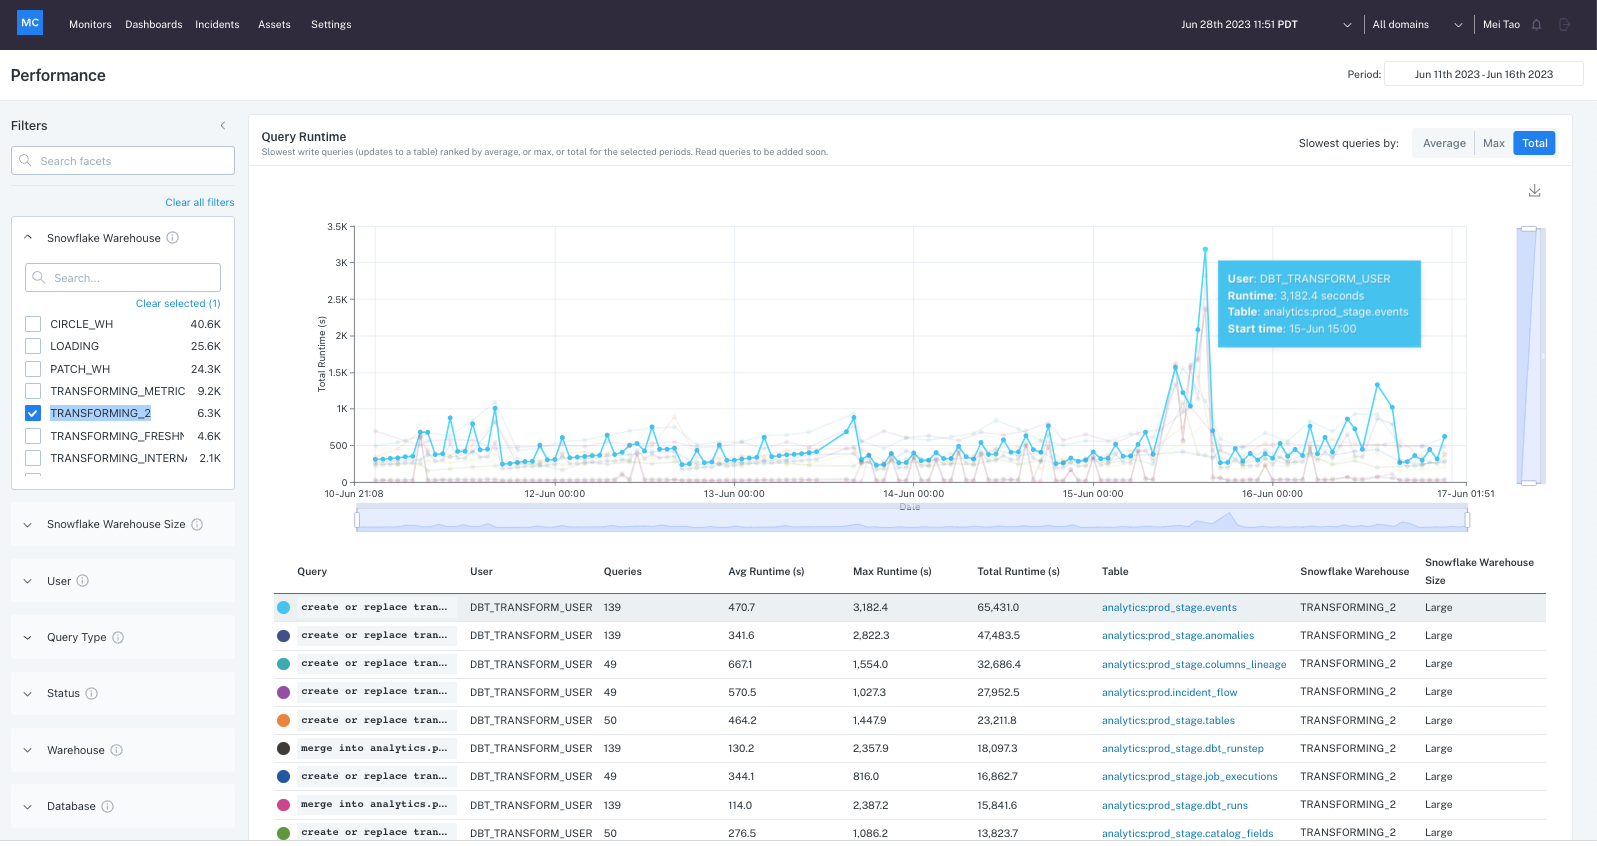
To illustrate how to leverage the dashboard to answer some of these questions, let's take an example, "I noticed higher costs for my Snowflake warehouse TRANSFORMING_2 in mid-June and I wonder what caused it".
First, select the one-week time period covering the cost increase, filter for queries in that warehouse TRANSFORMING_2, set the metrics toggle on "total" (as hourly aggregation metric), and then look for the slowest queries. You notice the runtime spikes across numerous queries on 6/15.
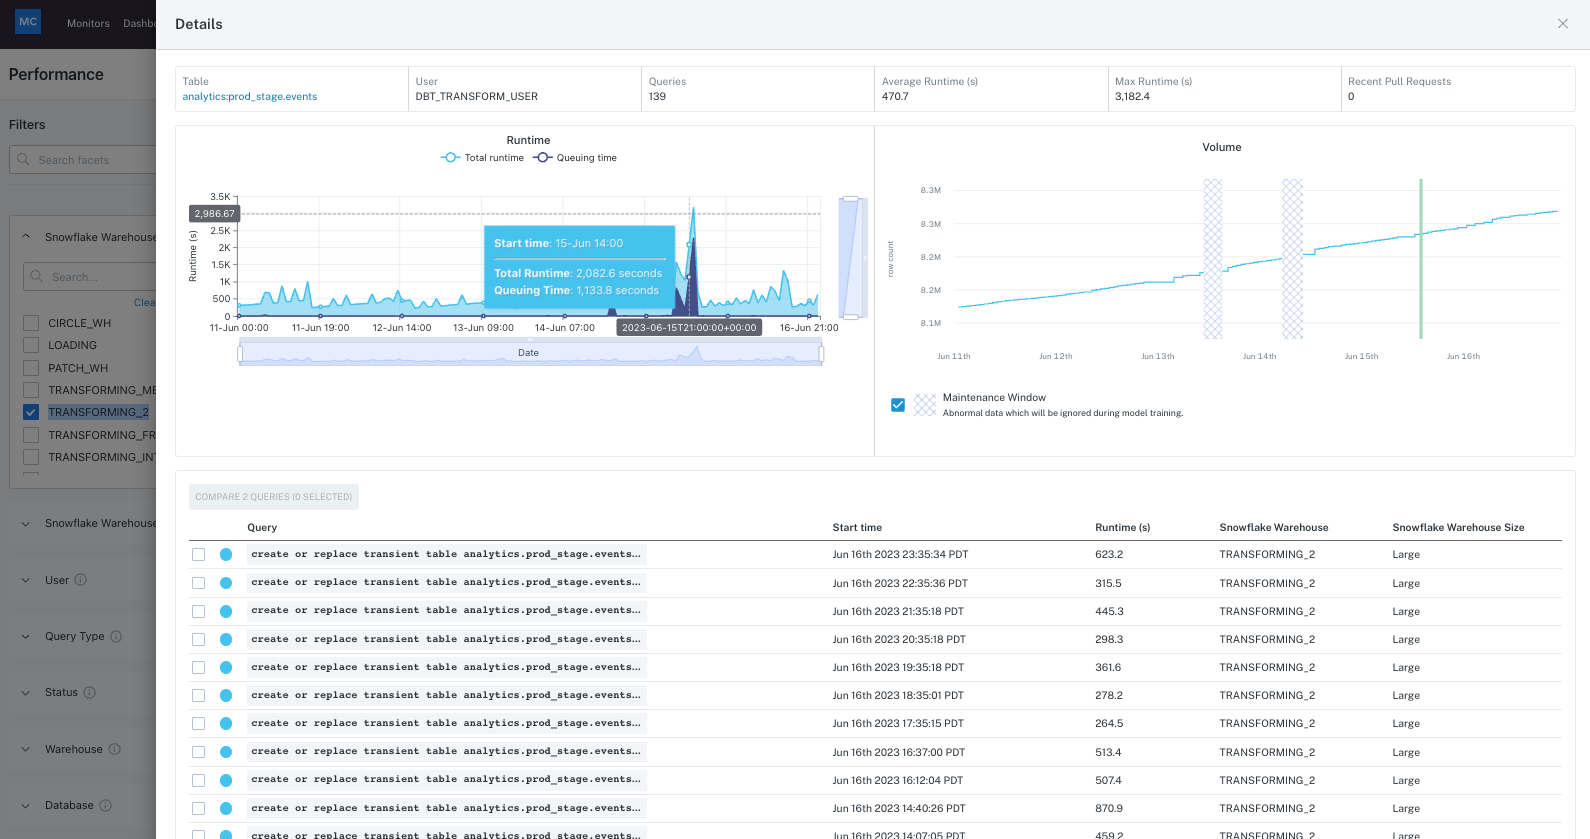
In order to understand why that happened, you can click into the slowest query to see its details. In the Details view you can see via the synced volume chart that no obvious volume increase happened around that date and the table volume trend looks relatively smooth, so it's likely not caused by rows added to the table.
However, notice from the runtime chart breakdown that the query queue time took up most of the total runtime on that day, so the slowness is coming from queries on that warehouse being queued up.
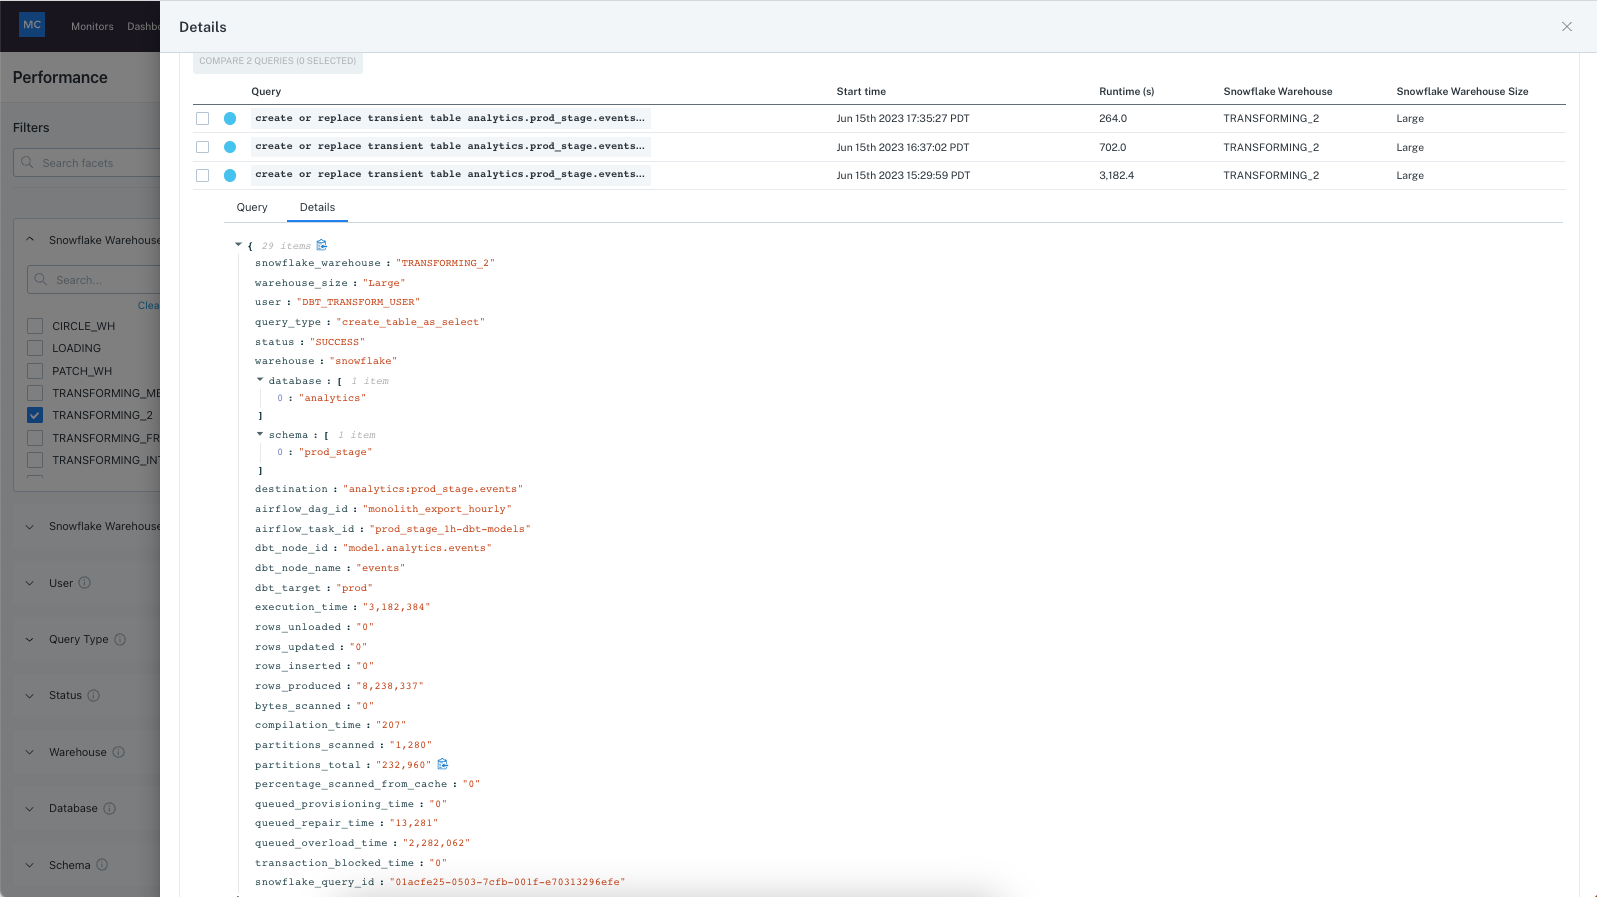
You can also find the peak run of the query and dive into the metadata details for it, to check for detailed queue time info, cache scanned, partitions info etc for other insights.
You could also drill into a few other slowest queries in this warehouse to see if they are all caused by queue time, then figure out if it might require upsizing the cluster or moving some of the queries to other clusters. This process helps drill into the details of a performance issue to find causes and then optimize.
Example 2: Investigate query performance in context of dbt job
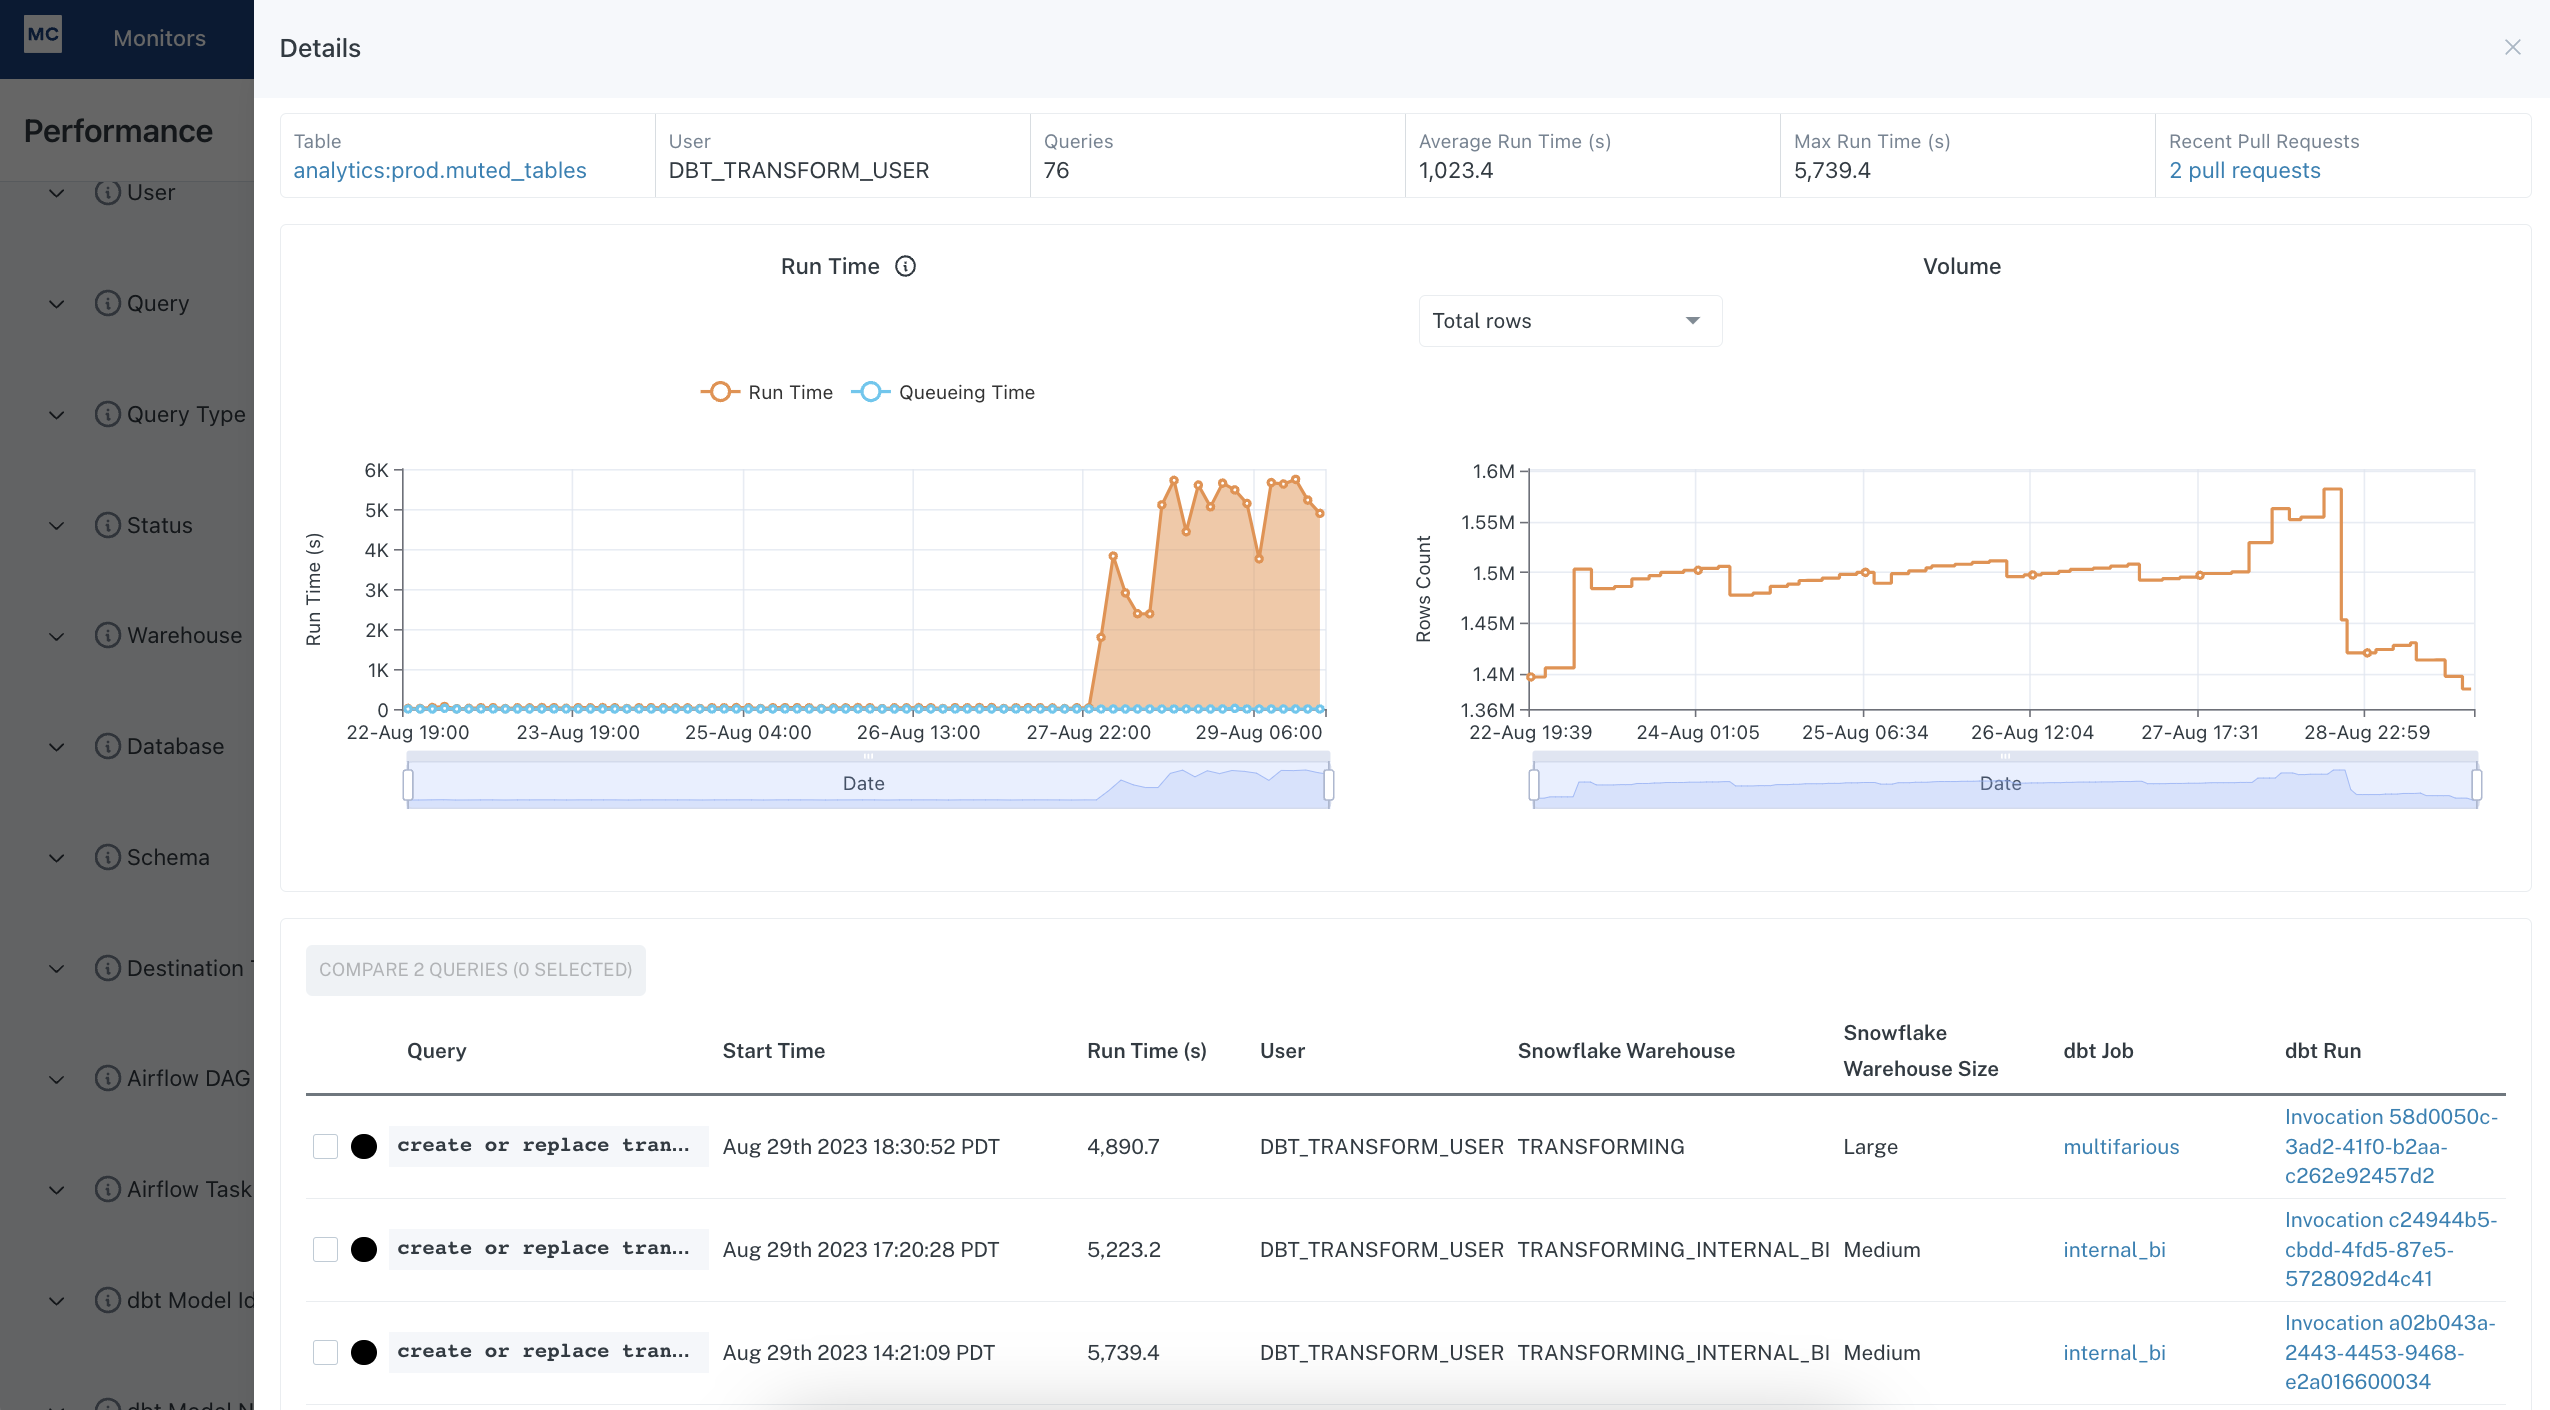
You might have noticed a query for a dbt model has slowed down recently, and you want to know if it's bottlenecking the dbt job that the model is part of. You can click into the query details drawer to identify the dbt job and the dbt job run a query is part of, and click into the dbt run to investigate.
That will take you to a gantt view for the dbt job run, where you can easily see what are the upstream and downstream dependencies for the slow model. Then you can determine if any models upstream are blocking the model of interest, or if any downstream models are bottlenecked by it, so that you can decide whether you need to optimize the runtime of the model.
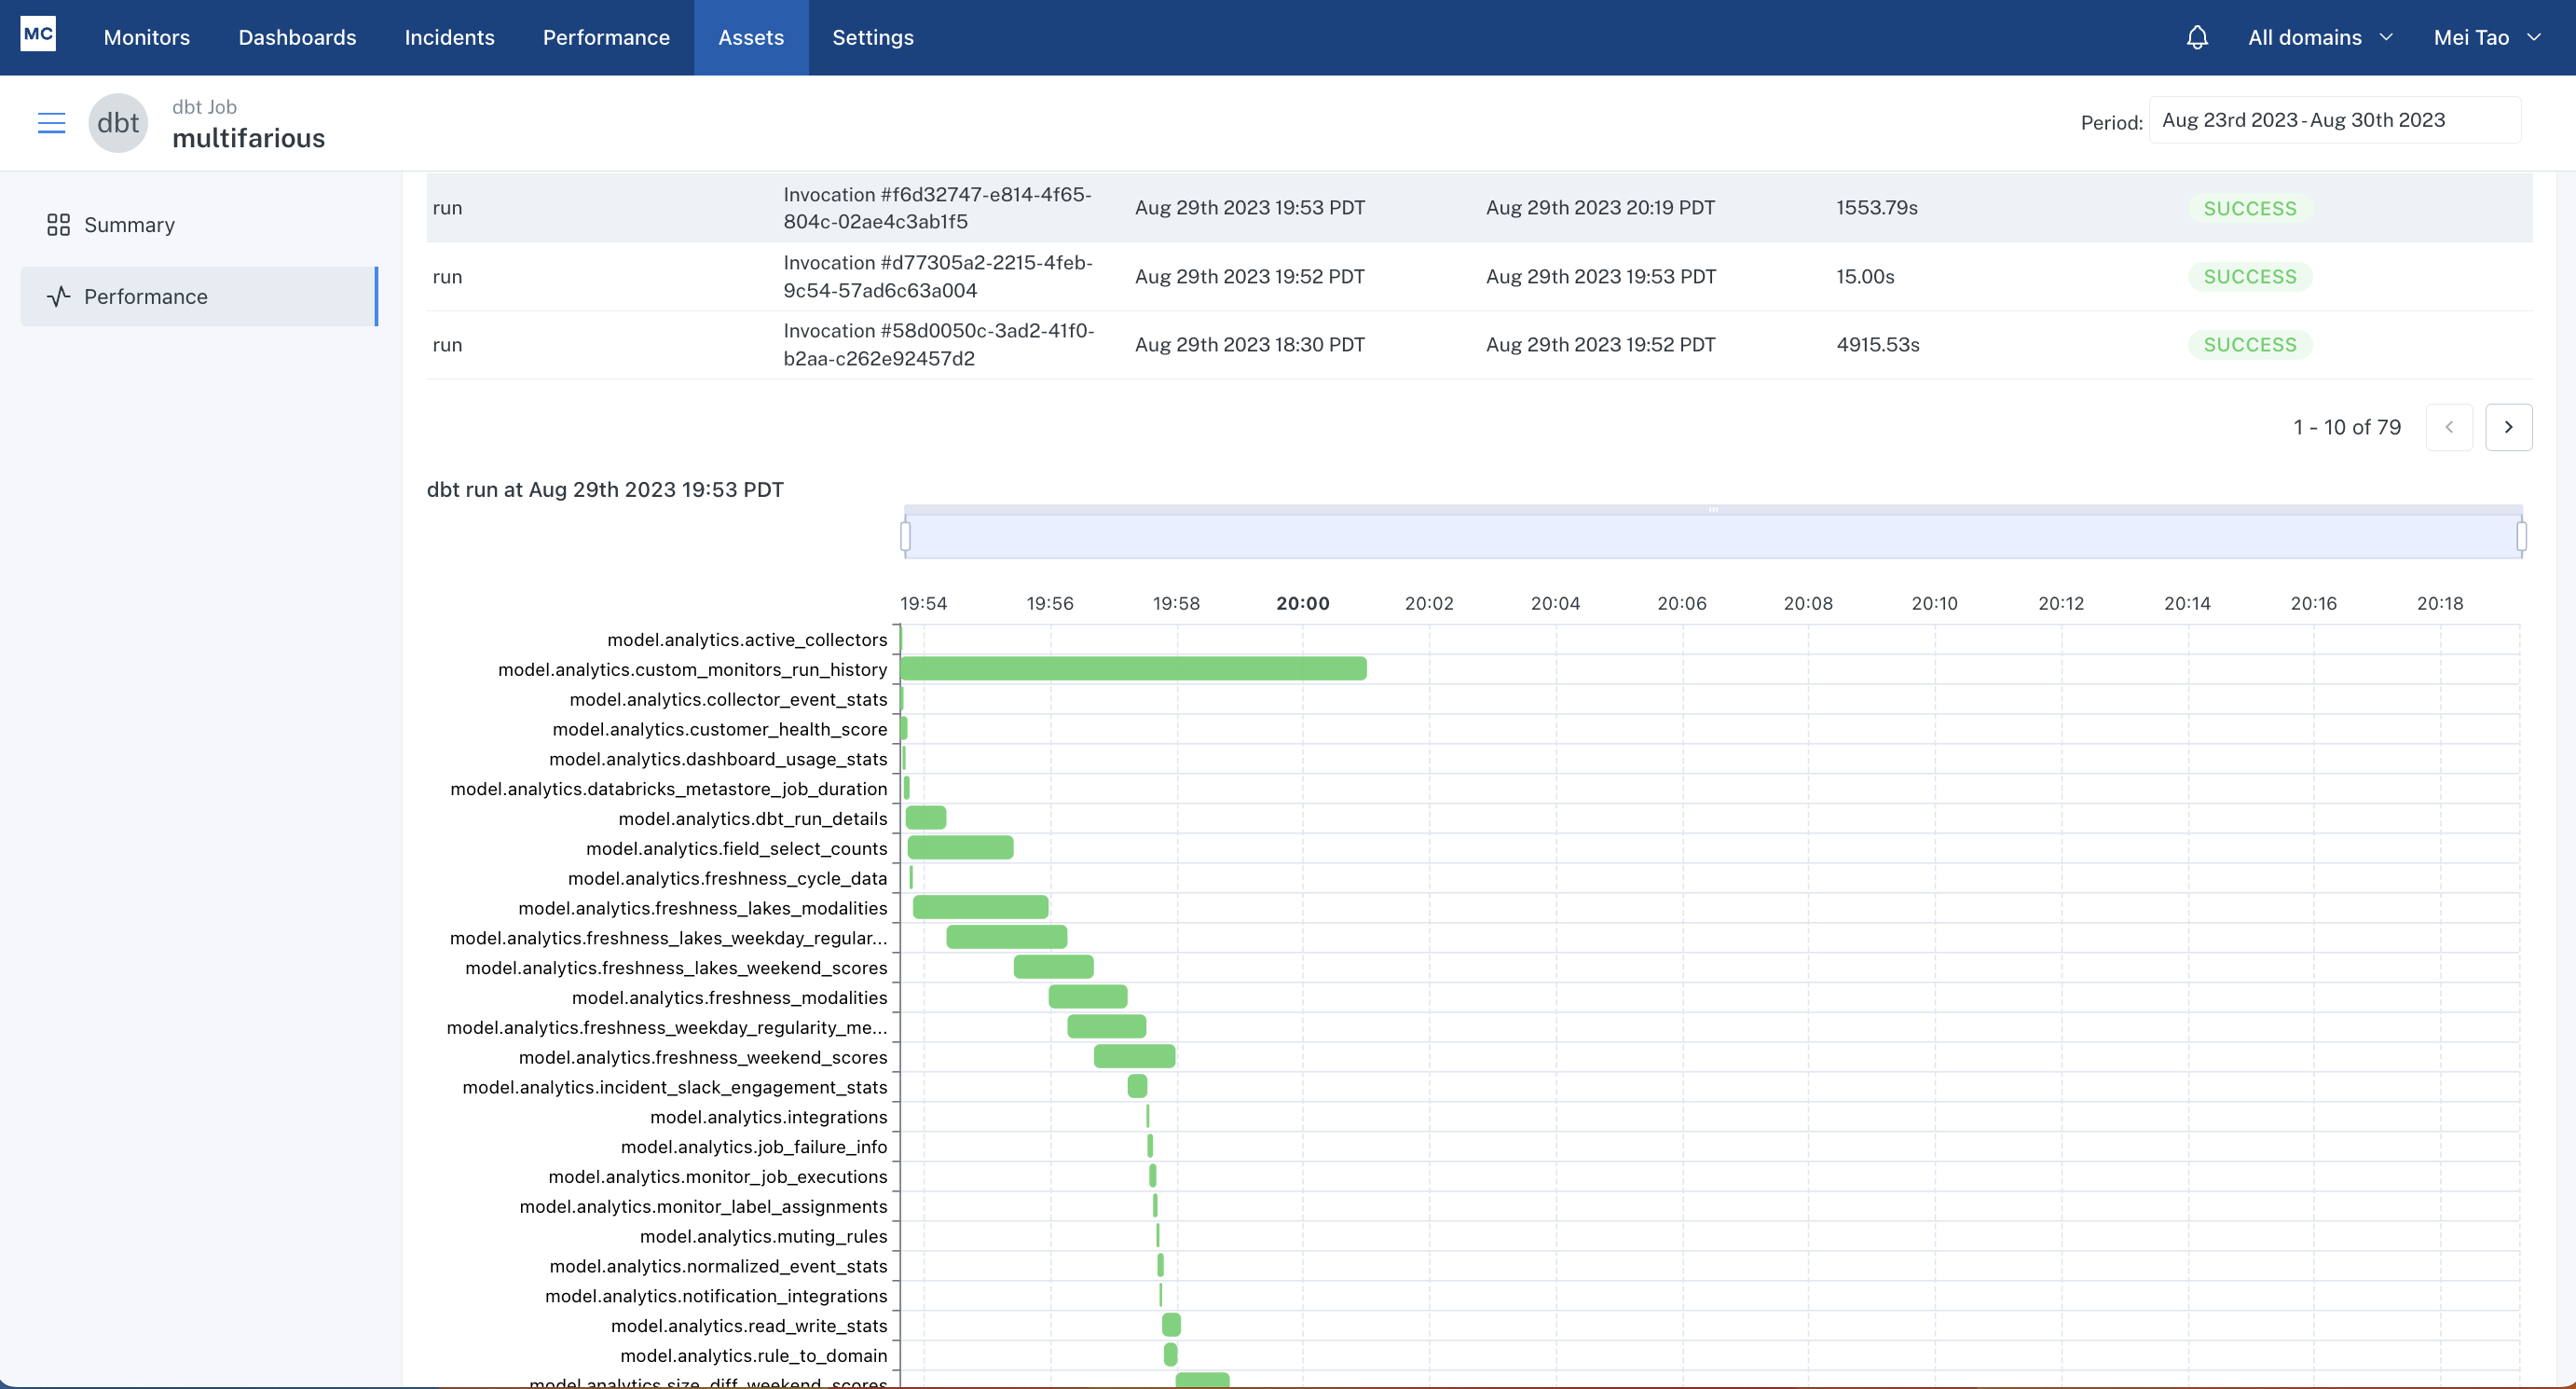
The gantt chart on asset page is available as long as you have dbt integration set up. The ability to link queries to dbt job runs requires query tagging per instructions here for dbt core, and here for dbt cloud.
Example 3: Understand end consumer experience
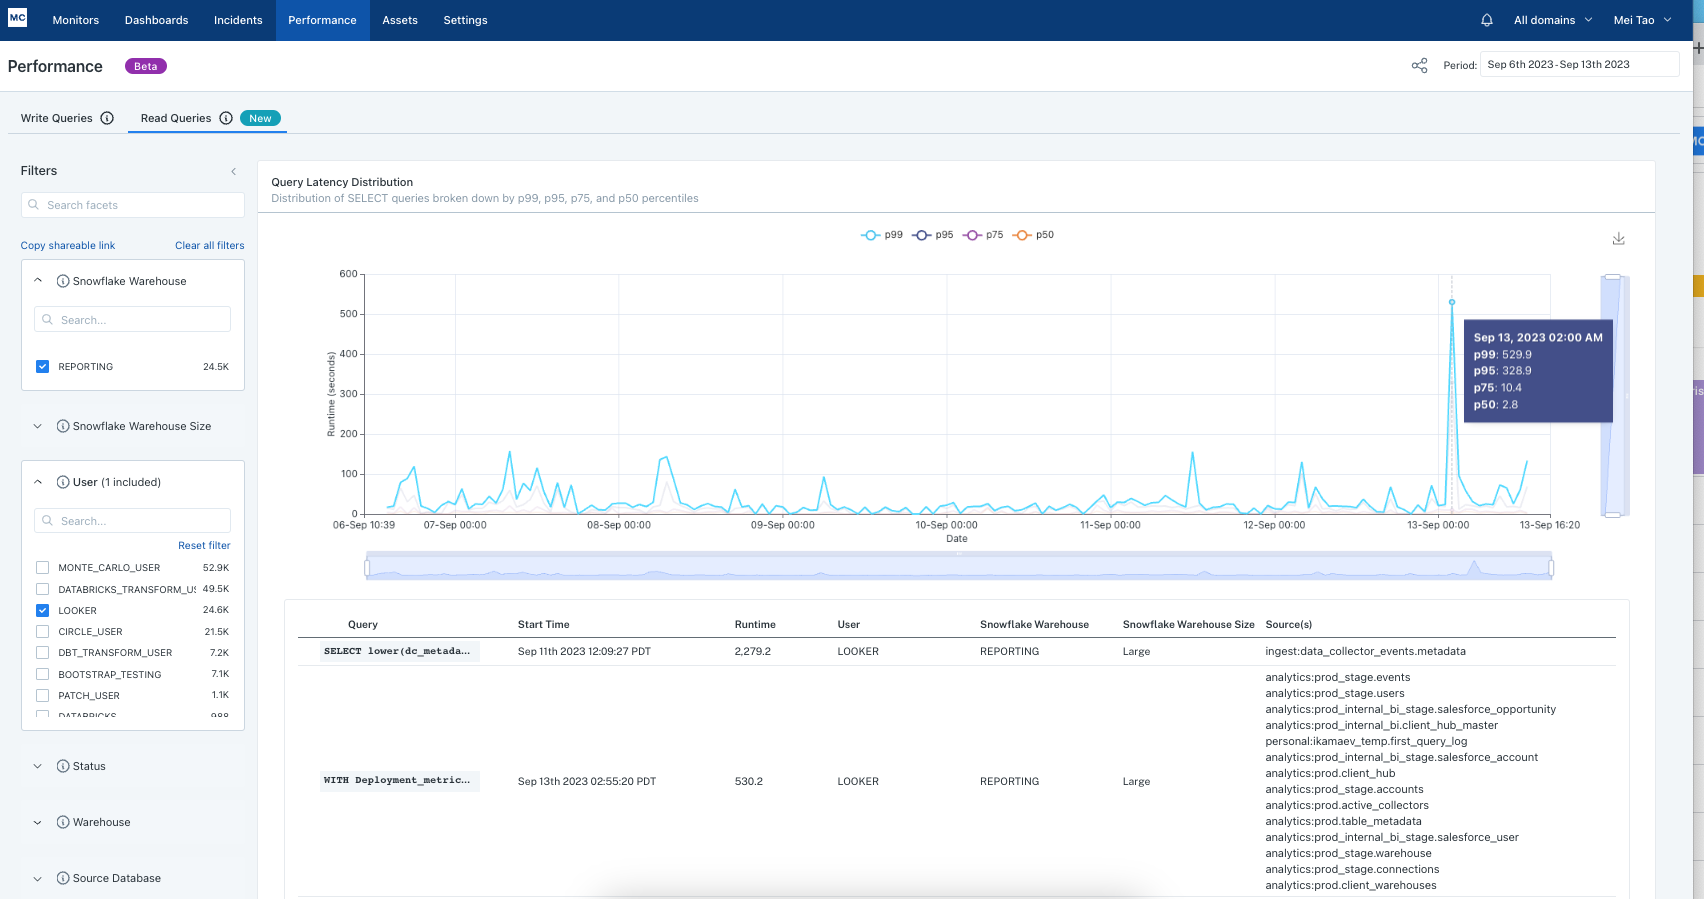
If I want to know if my Looker users are experiencing long wait time when they refresh dashboards, I can leverage the Read Queries (SELECT queries) tab to identify slow queries under the "Looker" User filter. In the example below, I see a spike on Sept 13th where the 99th percentile query ran for over 500 seconds and 95th percentile ran over 300 seconds, which means users were waiting for 5min+ for the looker dashboard to refresh. The table below lists those slowest queries and I can expand each row to investigate and optimize as needed.
Example 4: Find slowing Airflow DAGs and why
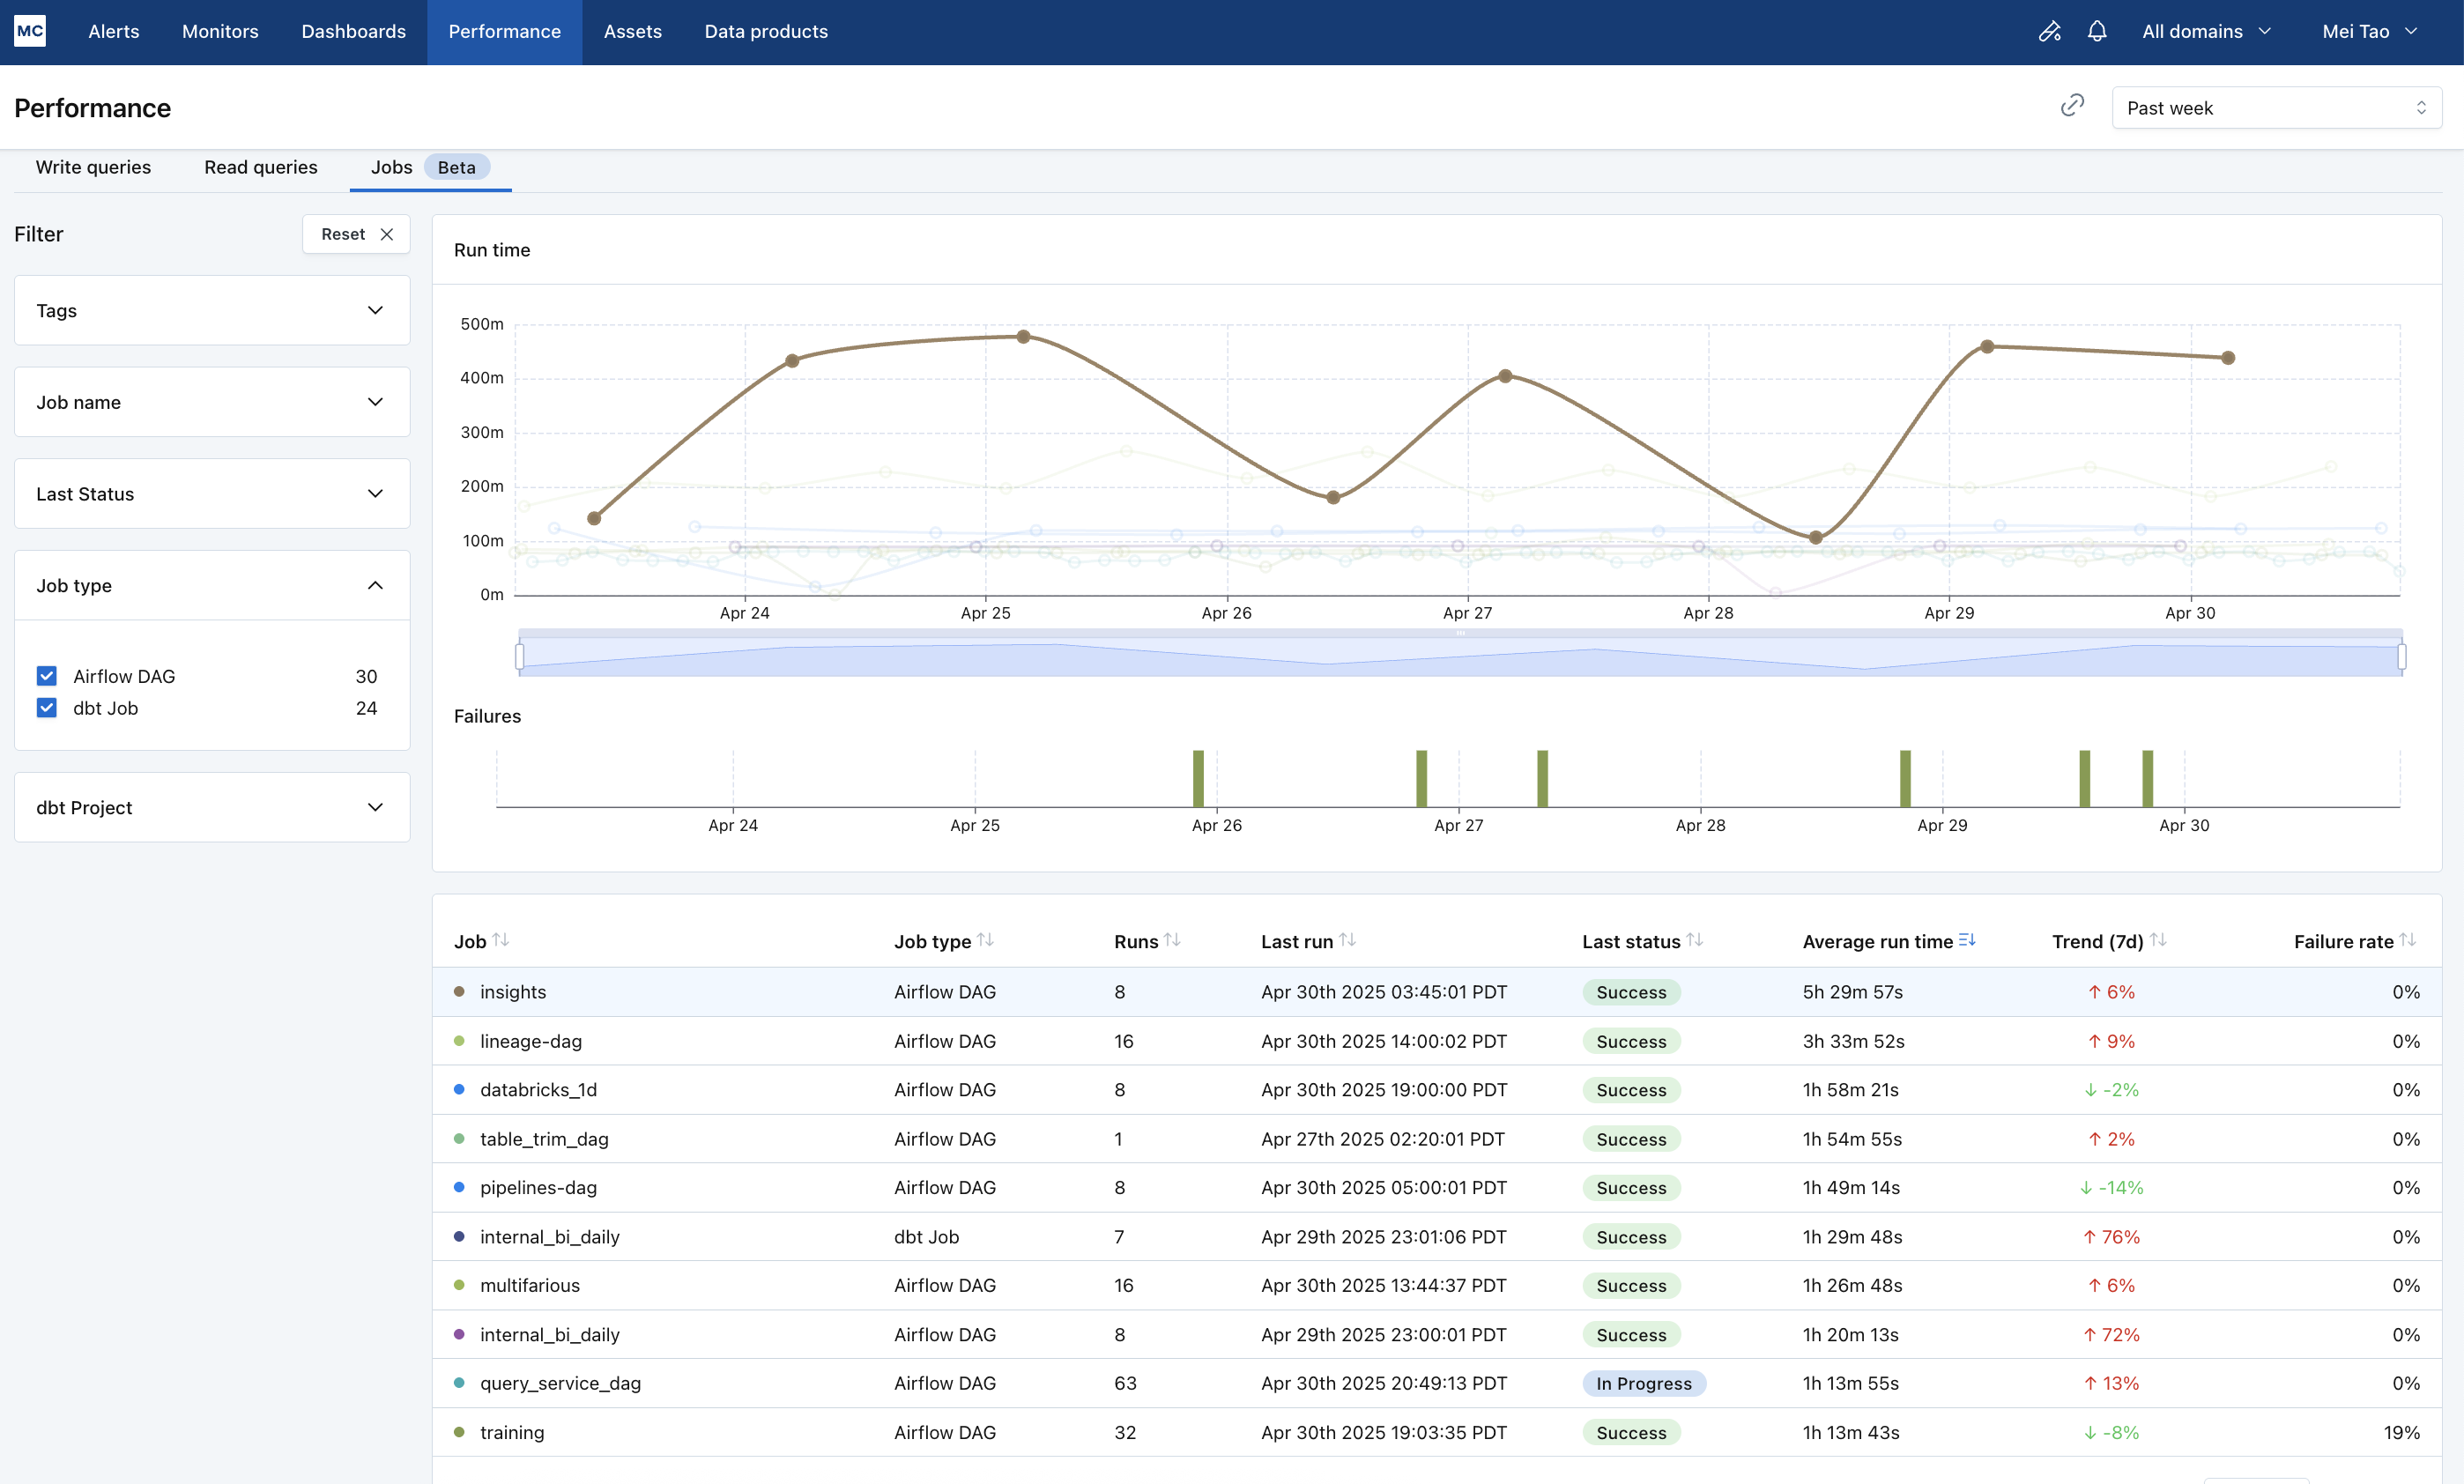
The job performance page helps you get a birds eye view on the health of your ETL jobs (Airflow/dbt/Databricks/ADF), find troublesome jobs and investigate them.
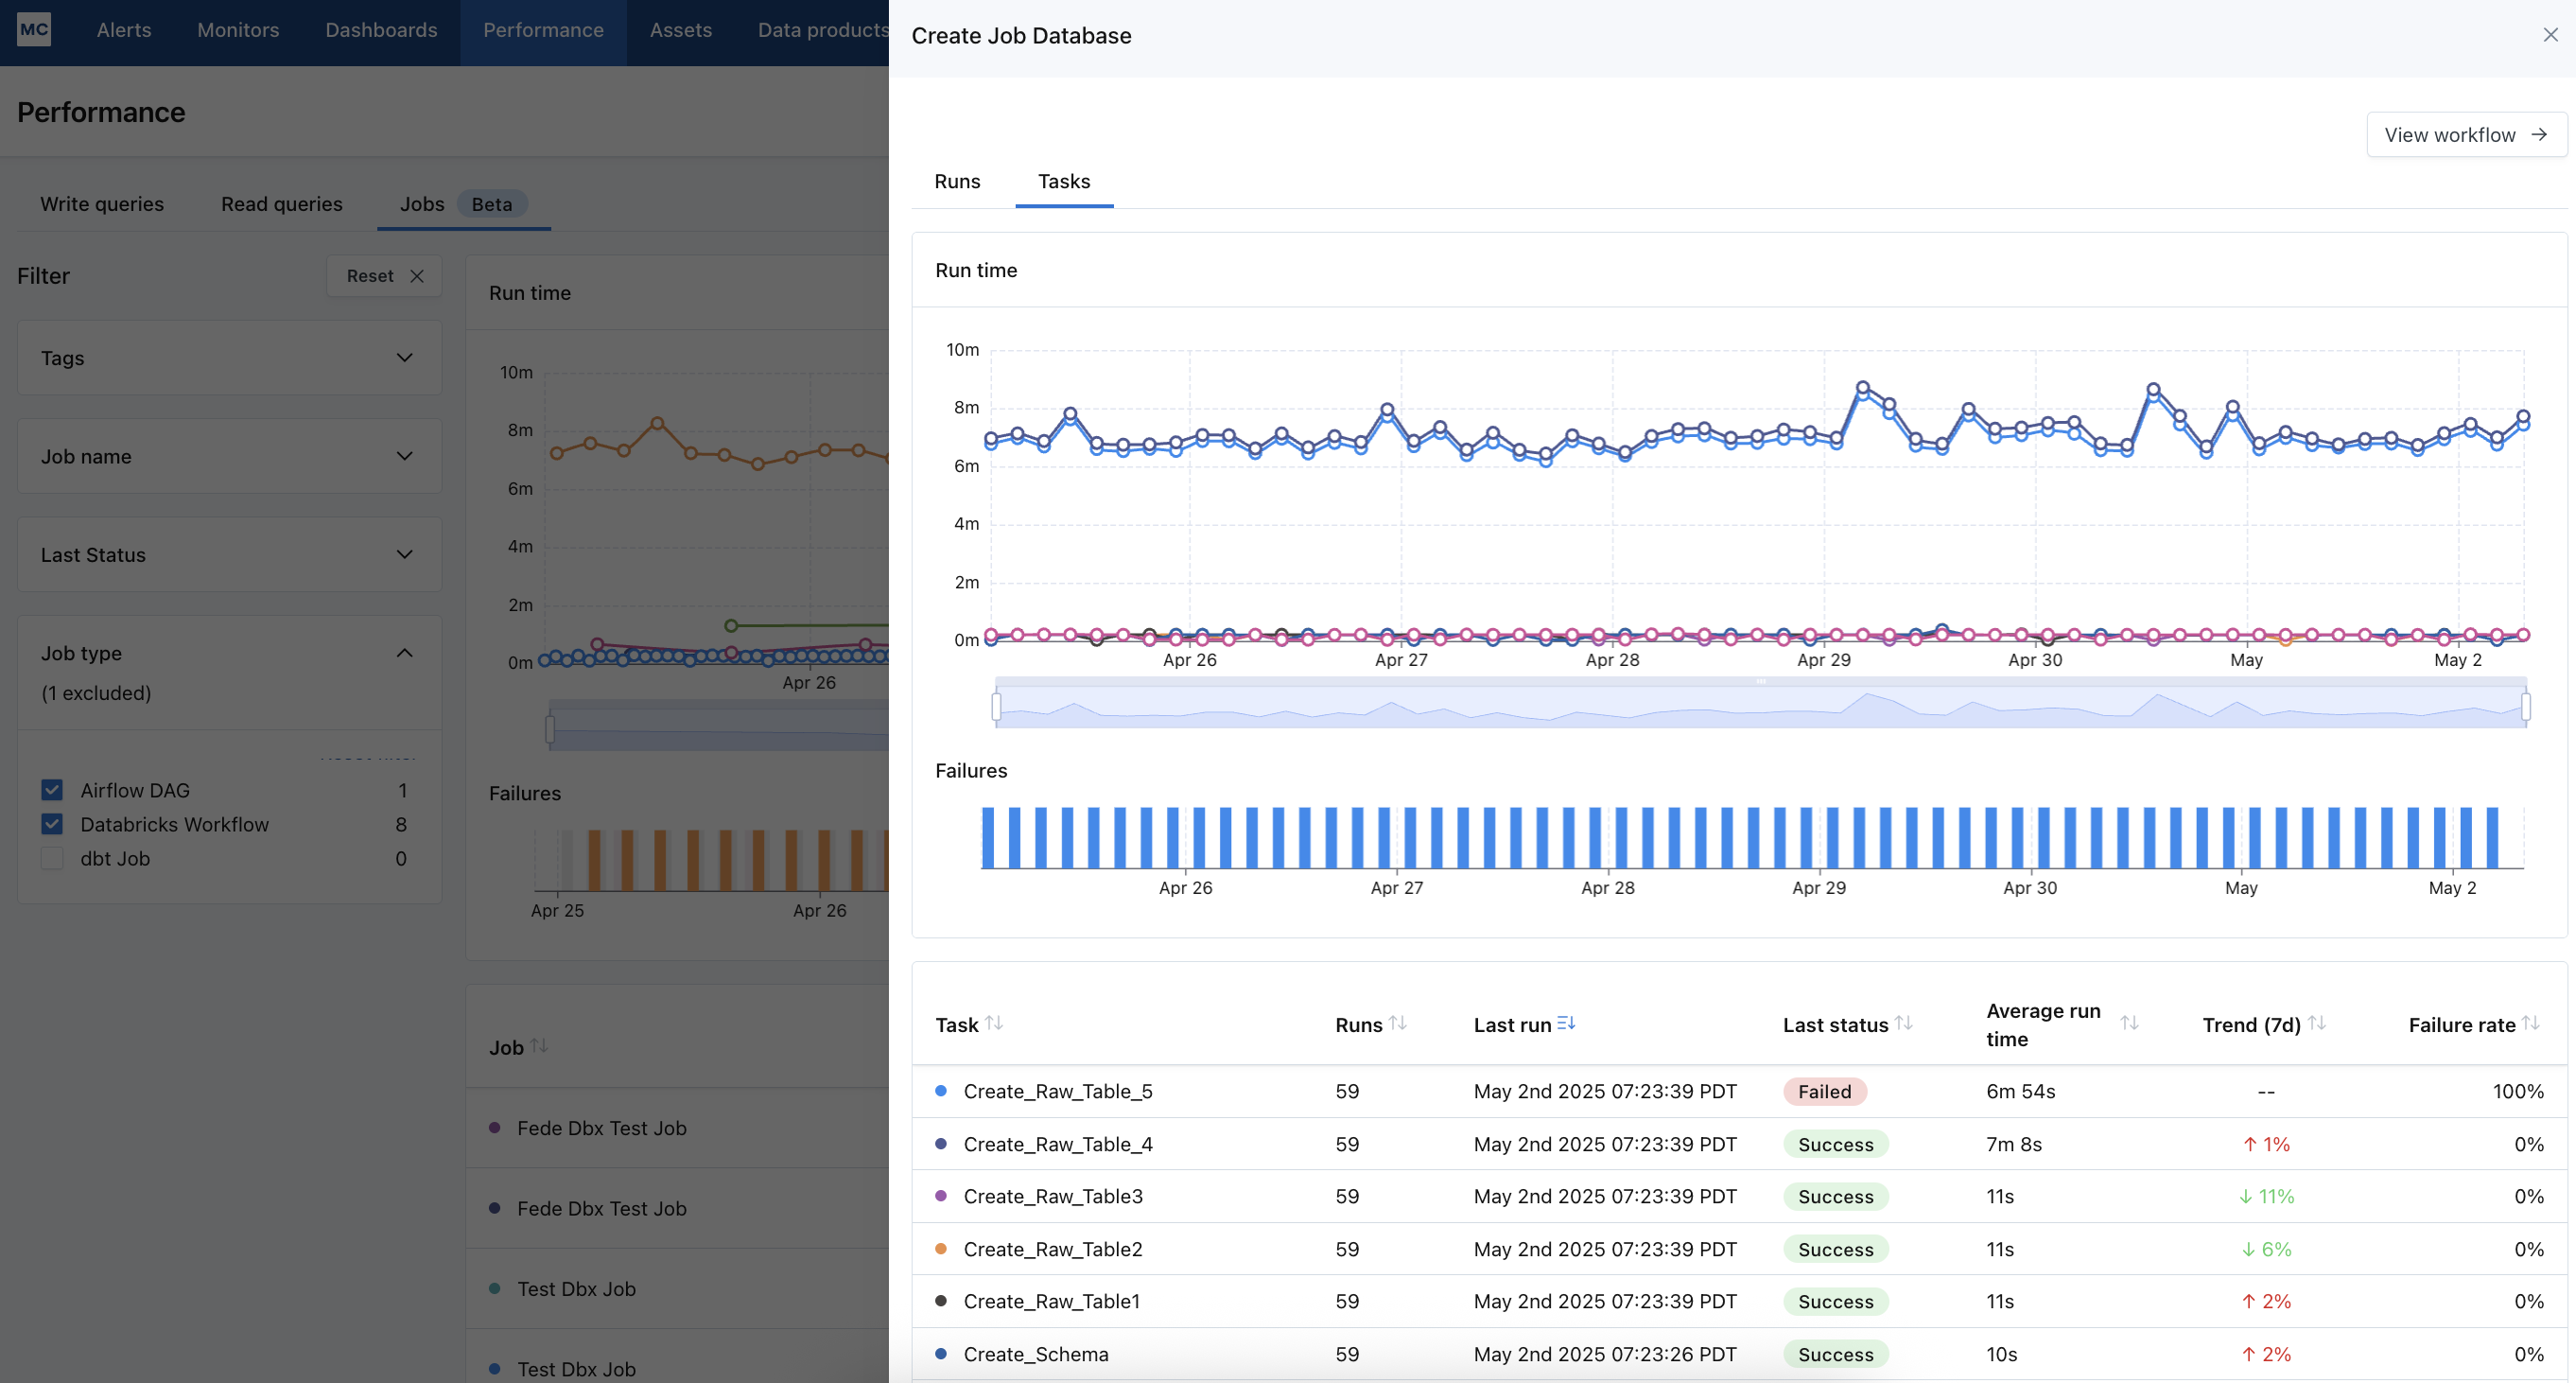
If you want to find the slowest running Airflow DAGs, sort the table by column "average run time" to see the longest running DAGs. You can then click on a DAG to open up a drawer that lets you investigate why the DAG is running long: the runs tab shows you a gantt view for each run to identify if the DAG is slow because one or more tasks are slow.
If you want to find Airflow DAGs running slower overtime, sort the table by "Trend (7d)", which compares average run time from the past 7 days to the 7 day prior (completed runs only), to see the fastest deteriorating DAGs week over week. You can then click on a DAG to investigate: the tasks tab can tell you if the DAG is deteriorating because all tasks are deteriorating or just one.
Or If you want to find frequently failing jobs, sort the table by "failure rate" to see the most common failed jobs.
The job performance dashboard currently works for Airflow DAGs, dbt jobs, Databricks Workflows, ADF pipelines.
Access
The Performance Dashboard is accessible to users View Query Performance action. These are users with the role of Account Owner, Domain Manager, Editor, Responder and Viewer. Learn more about these roles under Managed Roles and Groups.
Current Limitations
- The Writes, Reads performance dashboards support Snowflake, Bigquery, Redshift, Databricks, and Teradata integrations currently. Other Integrations and data lakes are not supported
- The queries are not filtered by domains.
- Access to the Performance Dashboard can be restricted to only those with "All data" for Allowed Domains using the API request togglePerformanceDashboardForDomainRestrictedUsers
- Only the most recent 4 weeks of queries are available currently
- The Job Performance dashboard supports Airflow DAGs, dbt jobs, Databricks Workflows, Azure Data Factory Pipelines.
FAQs
Q: On the Jobs Performance page, why does my "default-job" dbt job take a long time to load?
A: "default-job" is the default job name MC assigns to your dbt core job runs if you did not provide dbt job names in your configuration. This results in a single dbt job that includes a large number of models, tests, snapshots, and seeds—usually more than 200. As everything is bundled into one job, it becomes difficult to efficiently calculate performance metrics like historical trends, average run times, and error counts for each component.
To improve performance and visibility, we recommend breaking up your dbt "default-job" into smaller, more focused jobs via providing unique job names for your dbt commands. This helps Monte Carlo process and display job metrics much more efficiently.
Q: in the Job Performance view, why does my DAG show status of “running” or “in progress”, even though it has already completed the latest run?
This typically indicates that DAG-level callbacks are not properly configured in your Airflow environment. In many cases, only task-level callbacks are enabled, which means Monte Carlo never receives the signal that the DAG has finished — whether successfully or not.
When DAG callbacks are misconfigured or missing, it can lead to the following issues:
- DAG runs remain in a “running” state indefinitely.
- No alerts are triggered — Monte Carlo cannot detect DAG failures, so notifications are not sent.
- Job performance metrics appear as a steadily declining performance chart in the Jobs Performance view.
To resolve this, ensure both task and DAG callbacks are correctly implemented. You can refer to our Airflow integration guide for detailed instructions, or reach out via our Support Agent if you need assistance.
Updated about 1 month ago