Metric Monitors
Metric monitors detect anomalies for dozens of available metrics, or for custom metrics defined by the user. All metrics support machine learning thresholds and most support manual thresholds. Metric monitors will also backfill historical data in order to quickly generate a machine learning threshold.
One monitor can track many different metrics across many different fields on a given table. Metric monitors can also be easily segmented, allowing the user to isolate anomalies that could otherwise be diluted and missed.
Creating Metric Monitors
Metric monitors can be created from the Create Monitor page or Assets page. Configuration steps include:
Choose data
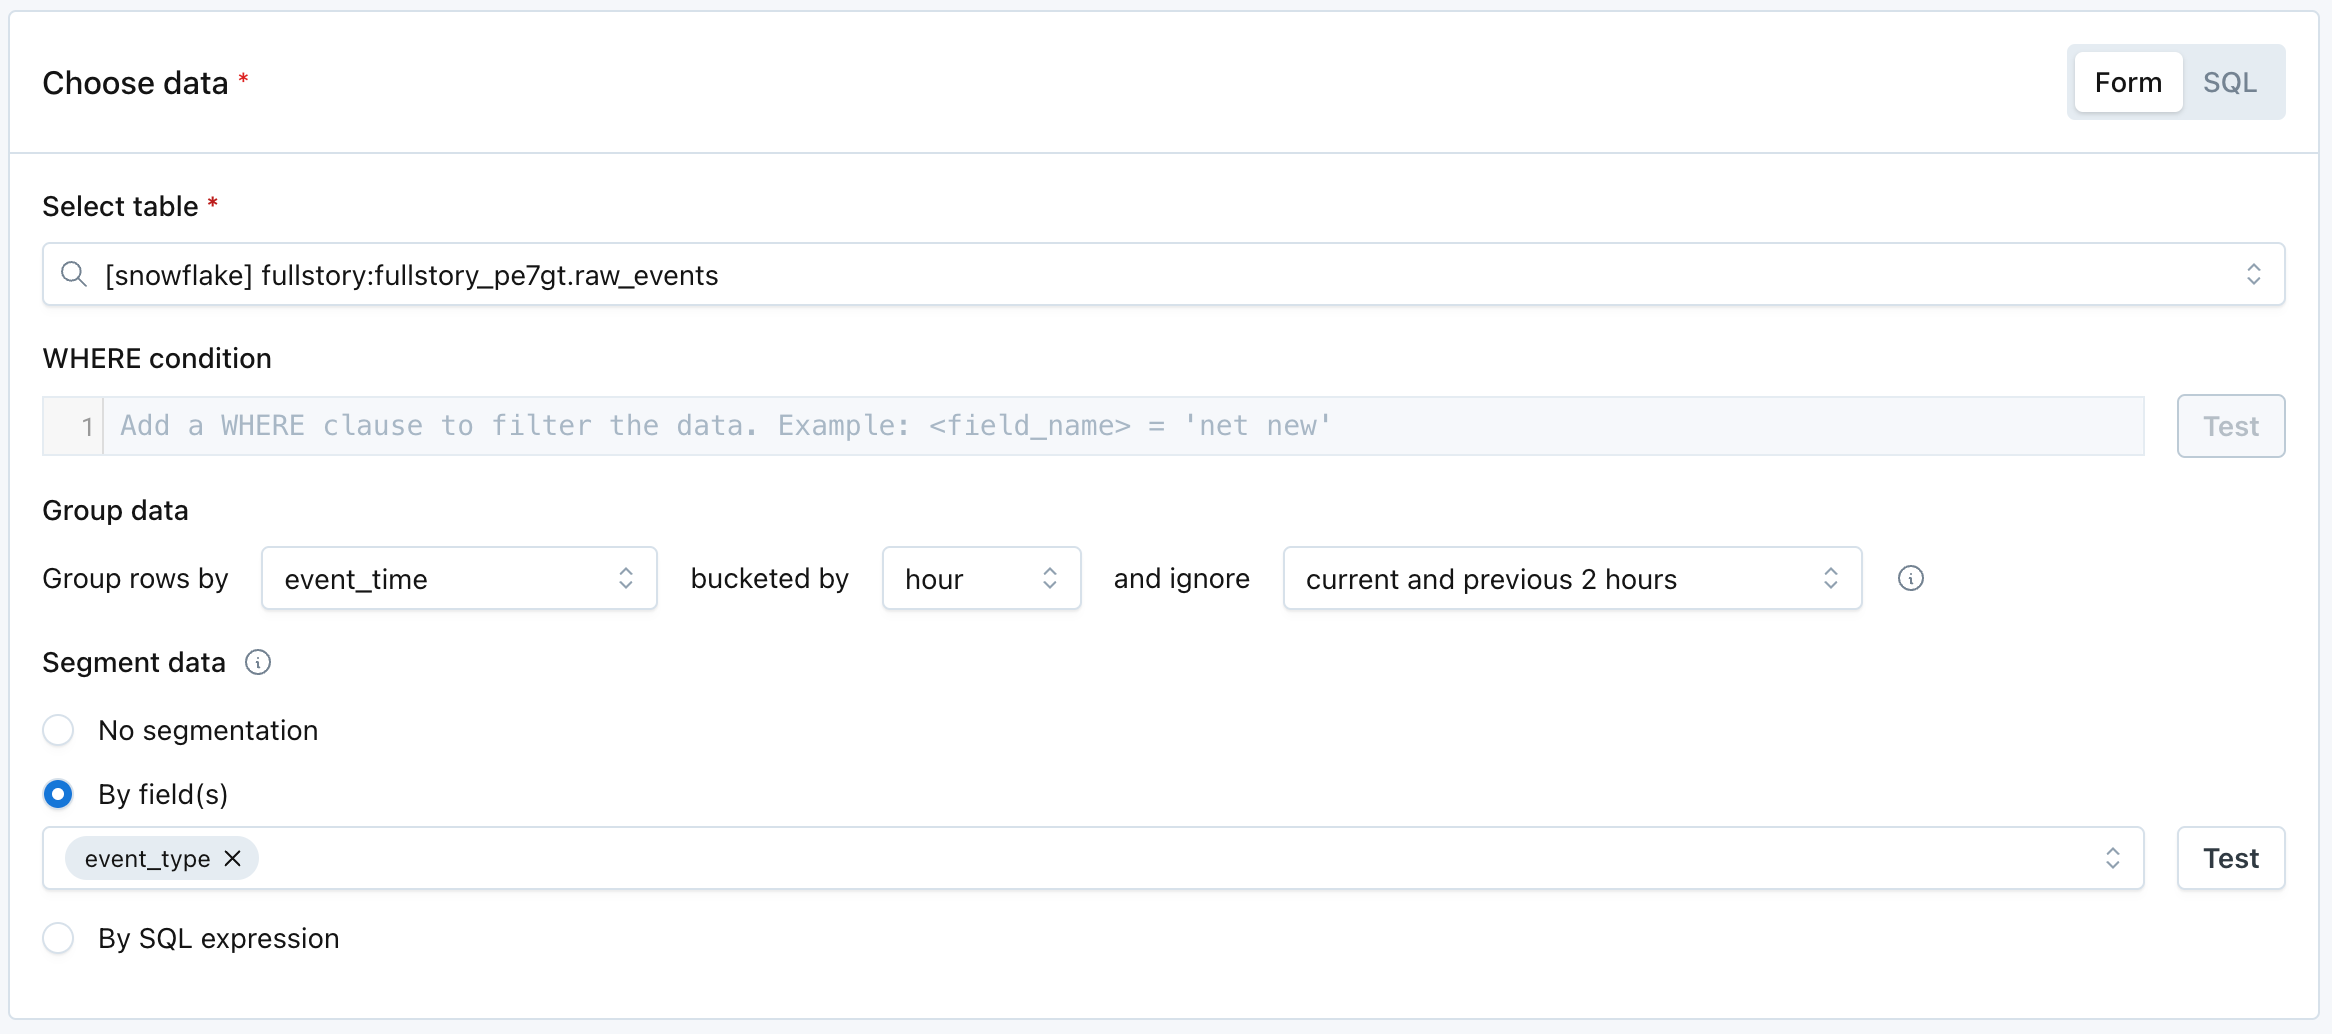
Select which table or view to monitor, and how to aggregate, filter, and segment the data. Instead of selecting a table, users can also define a source using SQL. Settings include:
Select table: picks which table or view to monitor. Alternatively, users can write custom SQL and monitor the output of the query.
WHERE condition: filters the entire selected table or the output from the custom SQL. For example, a specific segment of data you would like to monitor.
Group data: indicates:
- Which time field (if any) should be used to group data the data into a time series. Custom SQL can also be used to compose a time field.
- If the rows should be bucketed by hour or day.
- If any of the recent buckets of data should be ignored. Filtering out recent hours or days ensures that the monitor does not query incomplete or immature buckets of data.
Segment data: select up to 2 fields to segment the data by, or compose one with a SQL expression. Common fields to segment by include products, regions, event types, versions, and merchants. Read more about segmentation.

Define alert conditions
Select the metrics and fields to monitor, and the threshold to generate an incident. See the full list of available metrics or create your own custom metric.
When the monitor is segmented, only one alert condition containing one metric and one field can be used. When not segmenting, there is no limit on how many metrics you can include in a single monitor.
Once you select a metric, you can then select specific fields or All supported fields. If All supported fields is selected, then only automated thresholds are available.
The operators for alert conditions are self-explanatory, with the exceptions of:
- Not between: this is exclusive of the bounds. For example, "Alert when mean for sale_price is not between 500 and 1,000" could be rephrased as "Alert when mean for sale_price is <500 or >1,000."
- Between: this is inclusive of the bounds. For example, "Alert when mean for sale_price is between 500 and 1,000" could be rephrased as "Alert when mean for sale_price is >=500 and <=1,000."

Define schedule
Select when the monitor should run. There are two options:
- On a schedule: input a regular, periodic schedule. Options for handling daylight savings are available in the advanced dropdown.
- When the table is updated: the monitor will run when Monte Carlo sees that the table has been updated. This logic uses the history of table updates that Monte Carlo gets through its hourly collection of metadata.

Send notifications
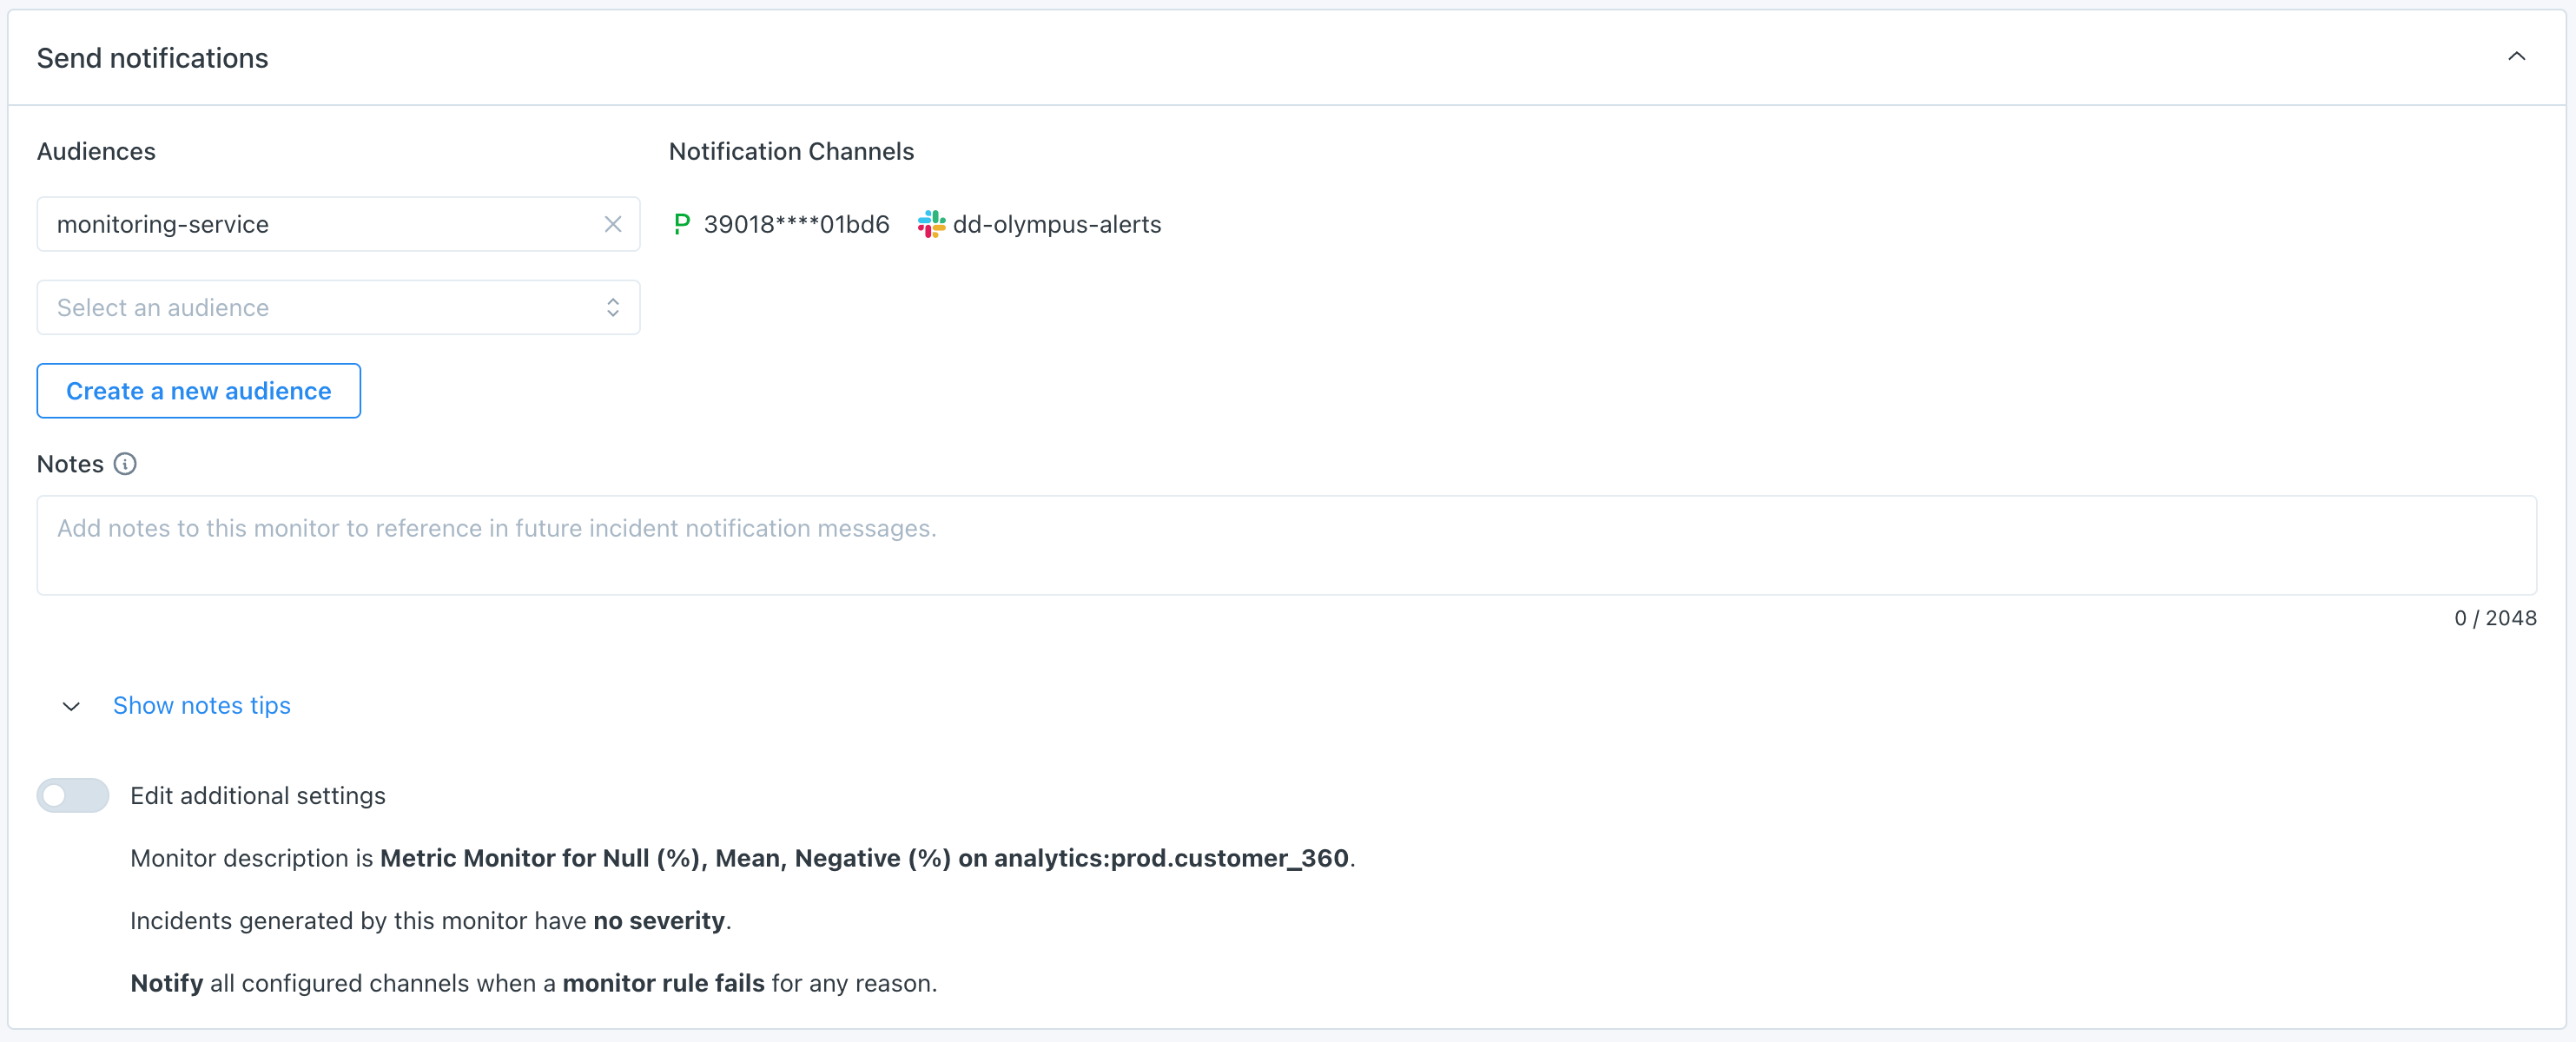
Select which audiences should receive notifications when an anomaly is detected.
Text in the Notes section will be included directly in notifications. The "Show notes tips" dropdown includes details on how to @mention an individual or team if you are sending notifications to Slack.
Additional settings exist for customizing the description of the monitor, pre-setting a severity on any incidents generated by the monitor, or for turning off failure notifications.
Learn more about setting Monitor tags.

Notes about automated thresholds
The automated thresholds for some metrics, such as Null (%) and Unique (%), are optimized for the extremes. In other words, if a column rarely or never sees nulls, then the threshold becomes very very sensitive. But if there is a lot of volatility (e.g. where we see 30-50% null rate), and especially if that volatility is away from the extremes (e.g. 40-60% vs 0-1%), then it becomes insensitive. This is to prevent lots of false positives and noise.
"Metric - legacy" monitors
Metric monitors combine the functionality from two deprecated monitor types: Field Health and Field Quality Rules. In April 2024, their functionality was brought together in Metric monitors.
Some customers have Metric - legacy monitors in their environment, which are historical Field Quality Rules. These still function, and are simply renamed for design consistency. They were not automatically converted to Metric monitors because they have certain backend differences that result in slightly different behavior.
Updated about 1 month ago
