Root Cause Analysis (RCA) Insights
RCA Insights have generally been moved into the Troubleshooting agent, so you will no longer see pop-up info boxes on the alerts.
Introduction
Root cause analysis (RCA) insights are automated findings that Monte Carlo produces to facilitate in the discovery of the root cause of a particular data incident. Our RCA insights are created using query logs, lineage information and the content of the table in order to generate helpful findings.
Click here to see what insights are available by incident type
If an insight is found for a particular incident, you will see the insight flagged on the Incidents feed and the Incident IQ page as well as in Slack alerts. See an example for a correlation insight below.
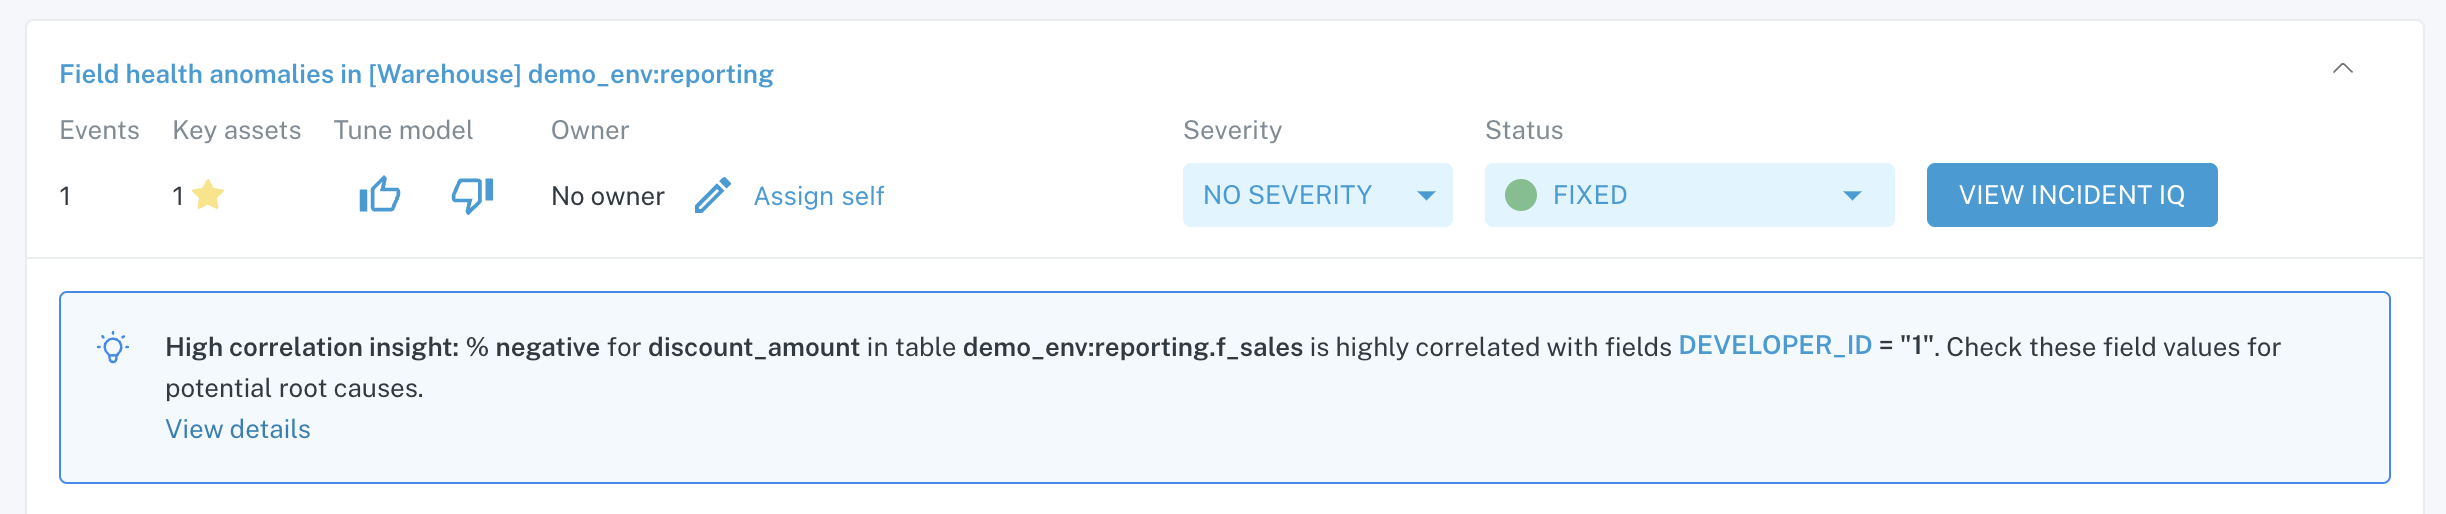
Example: Insight notification on Incidents feed
RCA insight types
There are generally 2 types of incident insights we will detect:
You can find information on each type below.
Correlation insights
Correlation insights provide automated correlation analysis on incidents, looking for fields in the incident table that match patterns in the incident. There are two general types of correlation insights — 1) those that are based on an exceptional addition or deletion in volume detected by default table monitoring and 2) those based on a change in computed metrics (e.g. % null, % unique) detected by field health monitors.
When a high correlation insight is found, you will see the incident flagged with the insight and details of the insight found on the Correlation Analysis tab.
In cases where there is no insight or an insight isn't highly correlated enough, details on the lack of insight will be on the Correlation Analysis tab as well.
In some cases, you will be able to perform manual correlation analysis, where you can select a timestamp (to plot on x-axis) and a categorical field (to plot on y-axis) on the supplied graph to spot any patterns. This gives you the ability to perform some spot checks in the case that we were not able to find a high correlation insight.
1. Correlation insights from exceptional volume addition / deletion anomalies
This correlation type examines the distribution of each categorical field (i.e. fields with a limited number of options like a product category or a currency type) and how they change with the volume of the incident table, and then finds the categorical field values that are highly associated with the volume incident.
In the example below, we can see that the value pending in the columns status is highly correlated with a volume incident, giving us evidence that there might be a change with the upstream source or the transformation on the table that may have created a disproportionate amount of rows with that status.

Example: Correlation insight for a volume incident on the Correlation Analysis tab of Incident IQ
2. Correlation insights from field health anomalies
Field health monitors track patterns in the content of columns (e.g. for a given column, the percentage of rows that are null) and create incidents when those patterns go outside of their normal thresholds. When there are anomalous patterns in metrics like % null, % unique, % negative, this correlation insights feature looks at other field values in the table to identify if any of those values can be highly associated with the anomalous metric.
In the example below, you can see that the anomalous change in the % negative metric is highly correlated where records in the table have developer_id = 1.
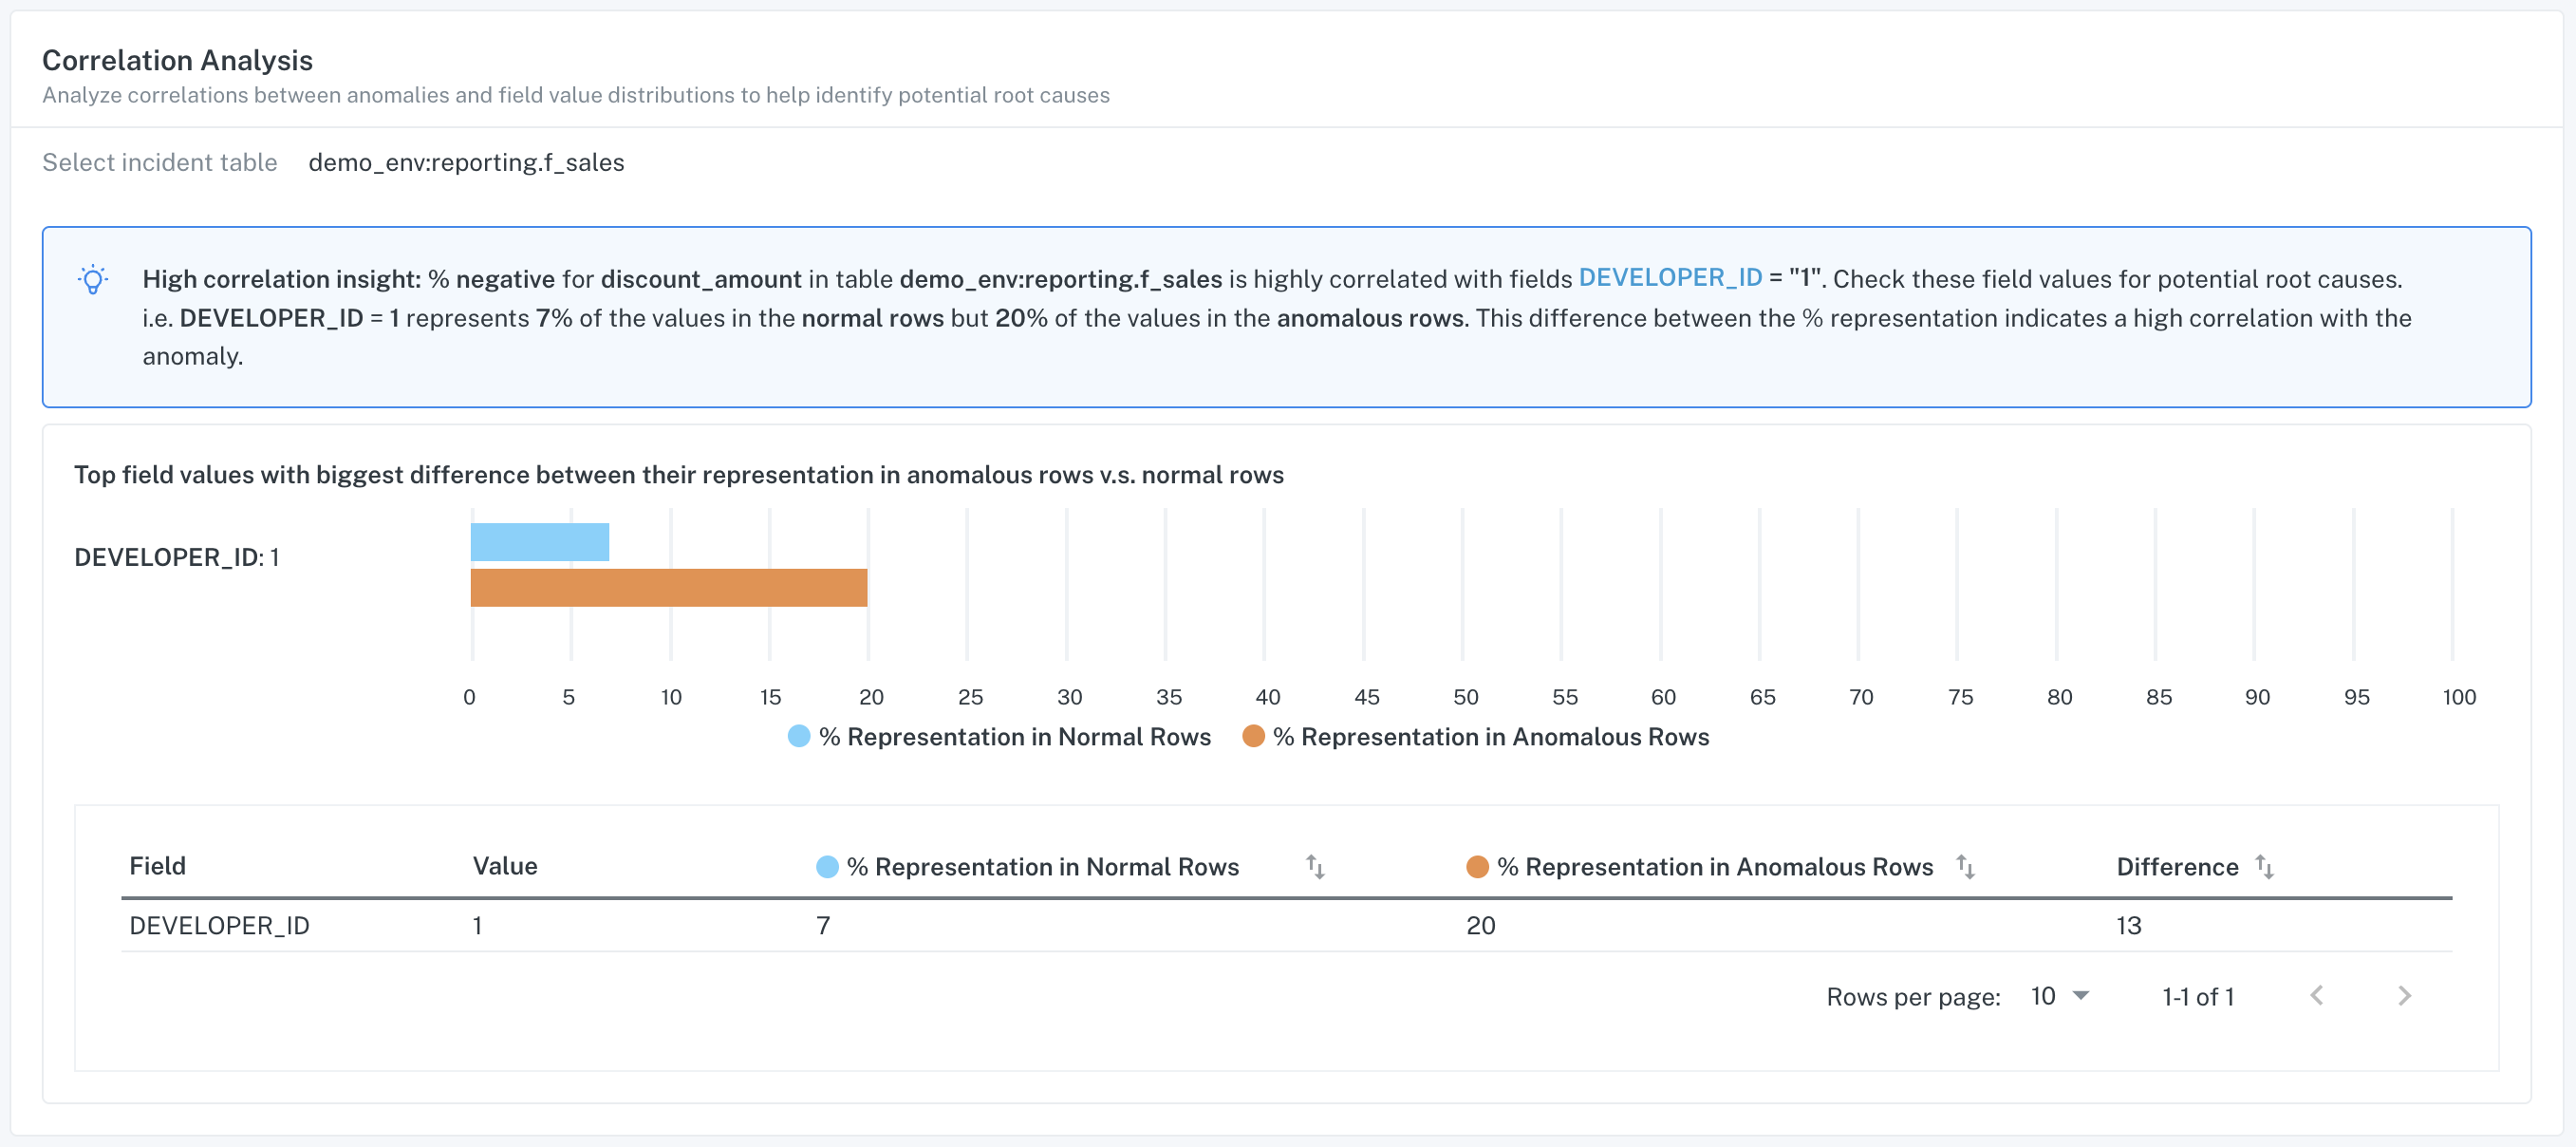
Example: Correlation insight for field health incident on the Correlation Analysis tab of Incident IQ
Query insights
In addition to finding insights based on highly correlated values, Monte Carlo also provides automated insights when we detect changes in queries that may be related to an incident. There are three different types of these insights, 1) query change insights, 2) failed query insights and 3) empty query insights.
When these insights are detected, you will see the insight flagged in the Incidents feed and on the Incident IQ page. See an example for a query insight below.
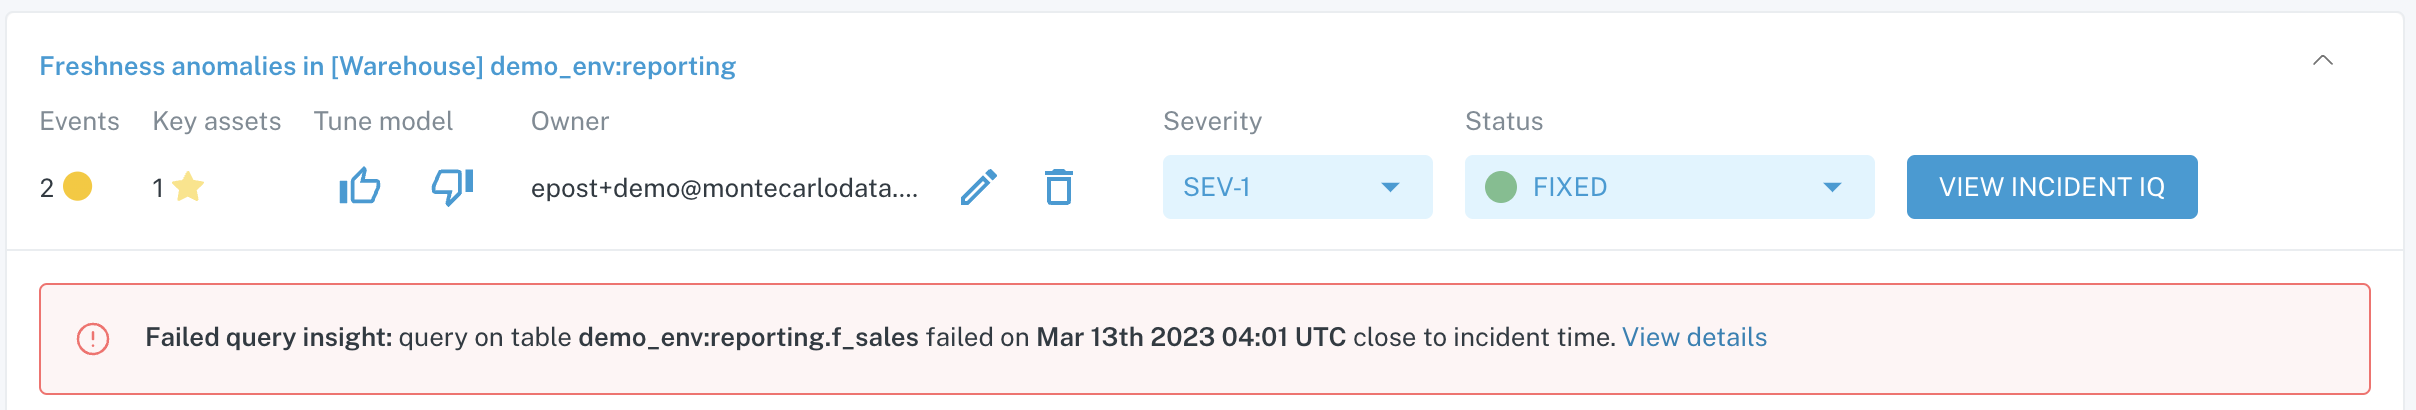
Example: Failed query insight flagged on an incident in the Incidents feed
1. Query change insights
This insight type identifies changes to queries that create or update the incident table that have occurred around the same time as the incident. Query change insights are meant to surface the possibility that a change to the query that is used to create/update the table might have been the cause of the incident.
Under the Query Logs tab, you can see the change in query patterned marked and even compare the old query pattern to the new query pattern to determine if the query change is related to the incident.
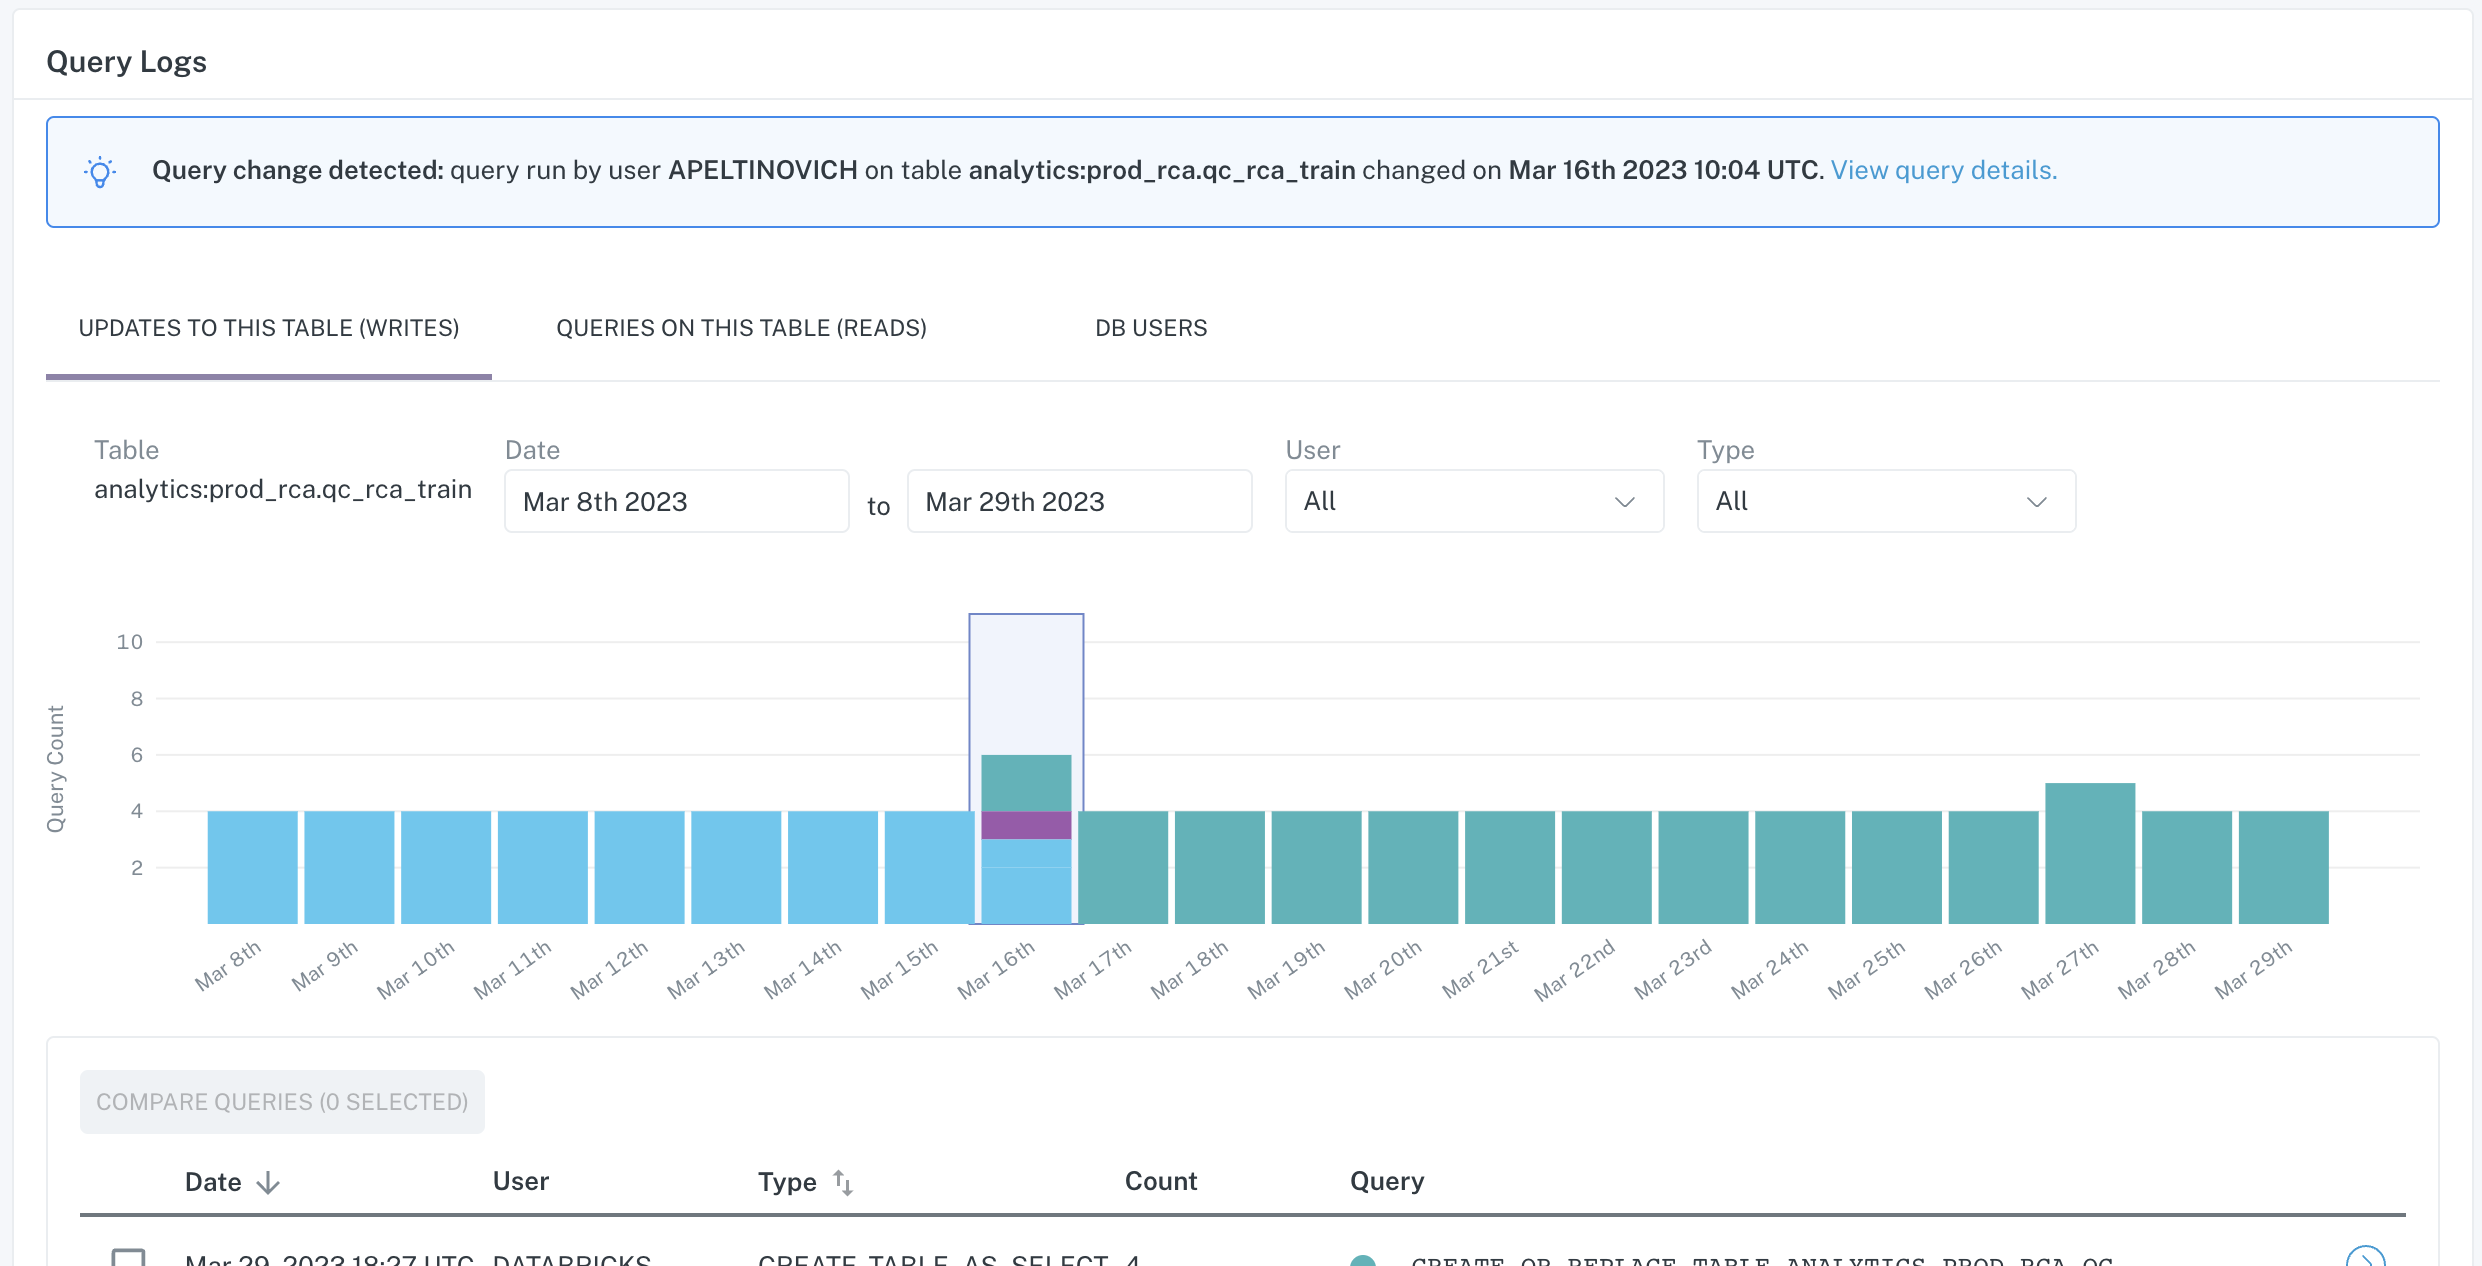
Example: Query change insight on the Query Logs tab of Incident IQ
2. Failed query insights
Failed query insights are produced when a query that has failed execution (due to timeout, poorly written code, missing fields referenced, permission issues, etc.) correlates with the time the incident occurred. This insight can be used to determine if a failed query was responsible for the incident.
Monte Carlo alerts you of the specific failing query that is highly associated with the incident. You can view the query and its associated metadata on the Query Logs tab of the Incident IQ page.
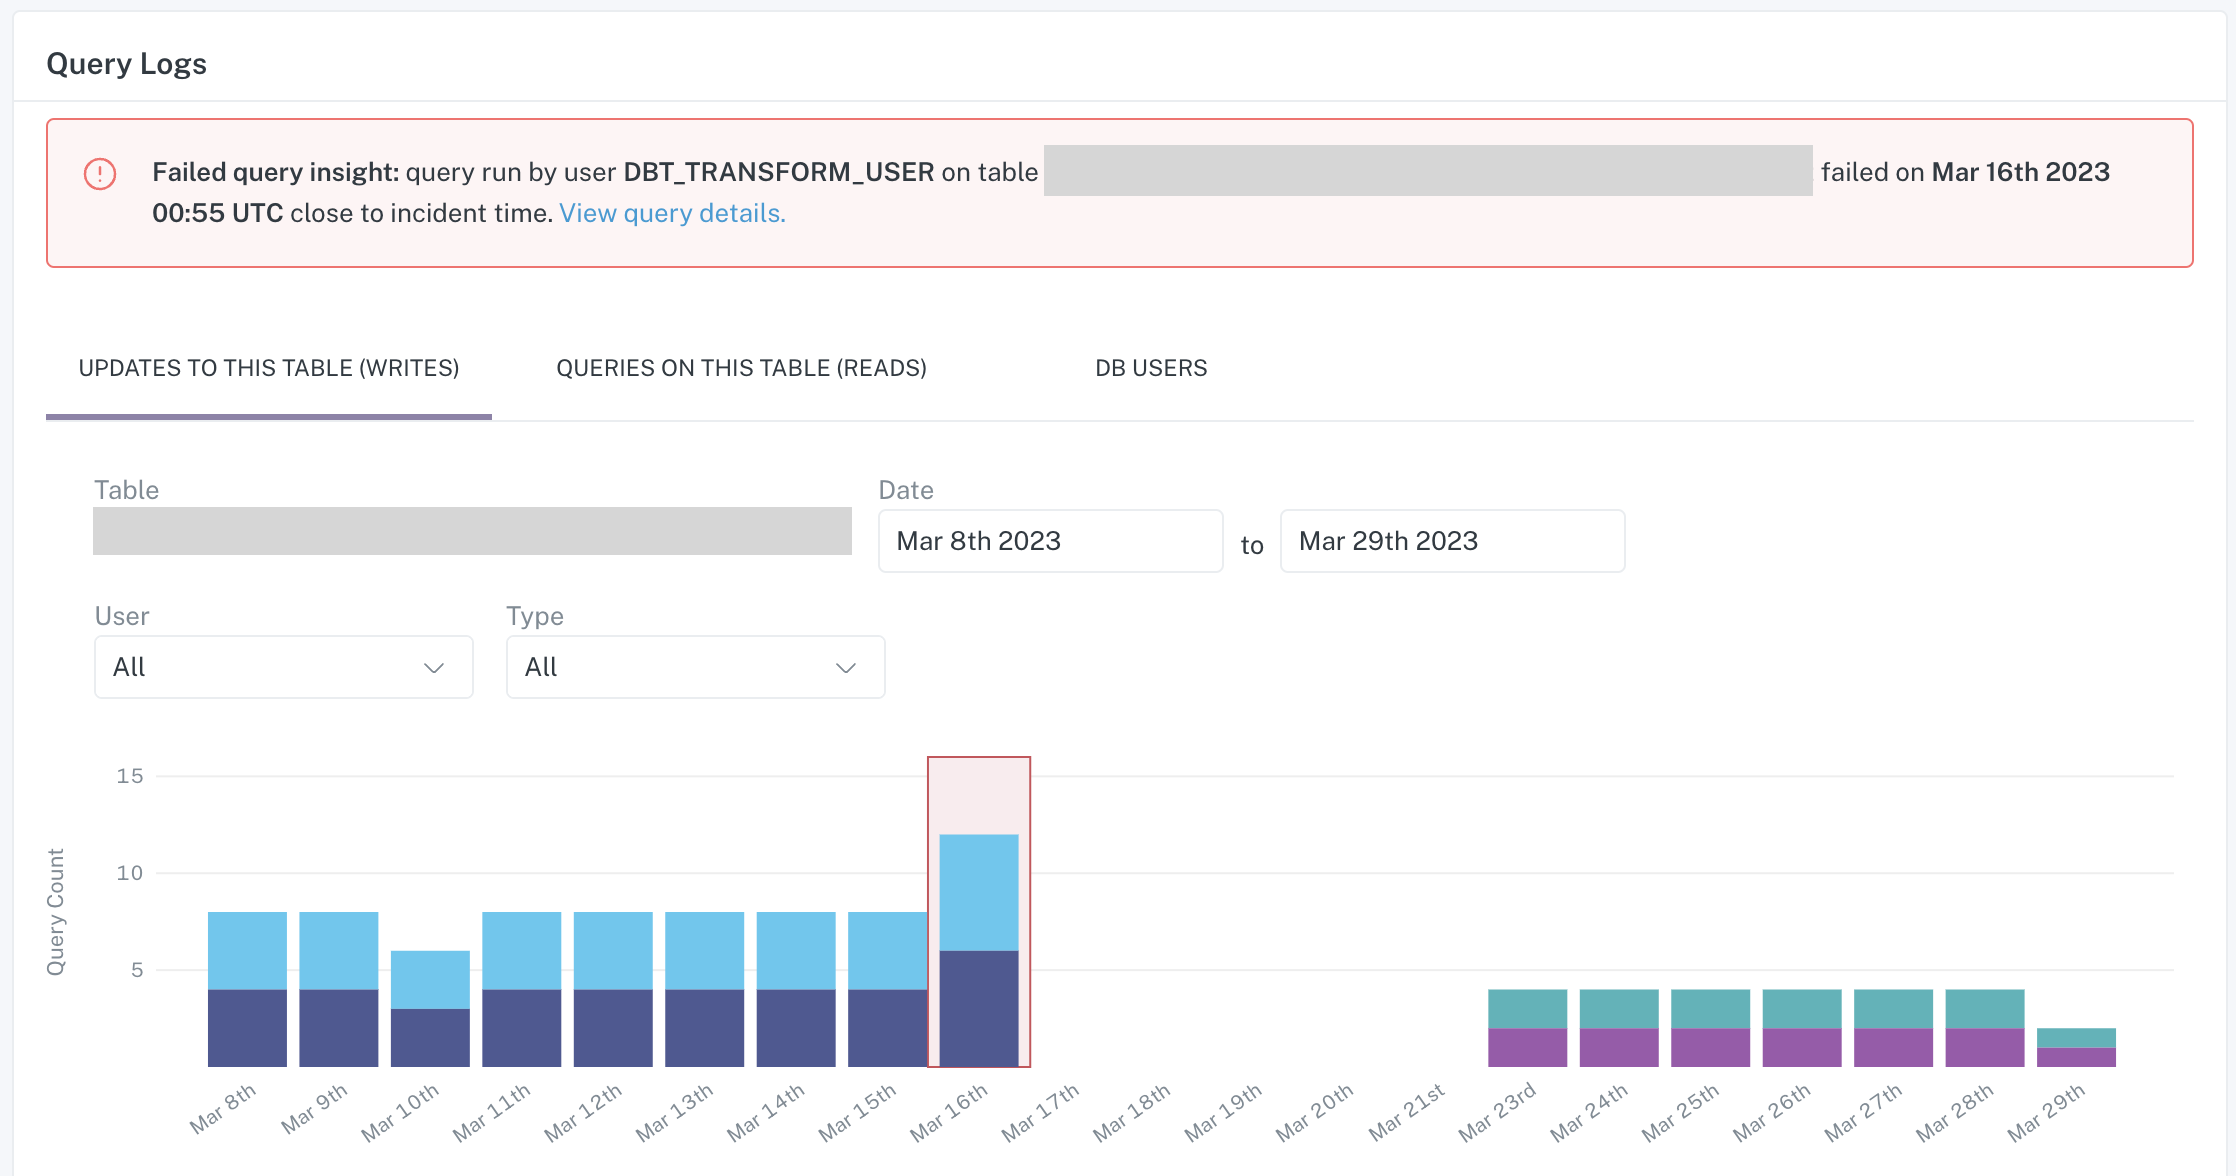
Example: Failed query insight on the Query Logs tab of Incident IQ
3. Empty query insights
Empty queries are queries that run successfully but do not produce any rows or update the table. A query can produce empty results often because it is reading from upstream tables that do not have the rows needed for updates. We surface these empty queries as insights to help you determine if the "silent" failure of an empty query was the root cause of the incident.
Monte Carlo alerts you of the specific empty query that is highly associated with the incident. For all query insights, you can view the query and its associated metadata on the Query Logs tab of the Incident IQ page.
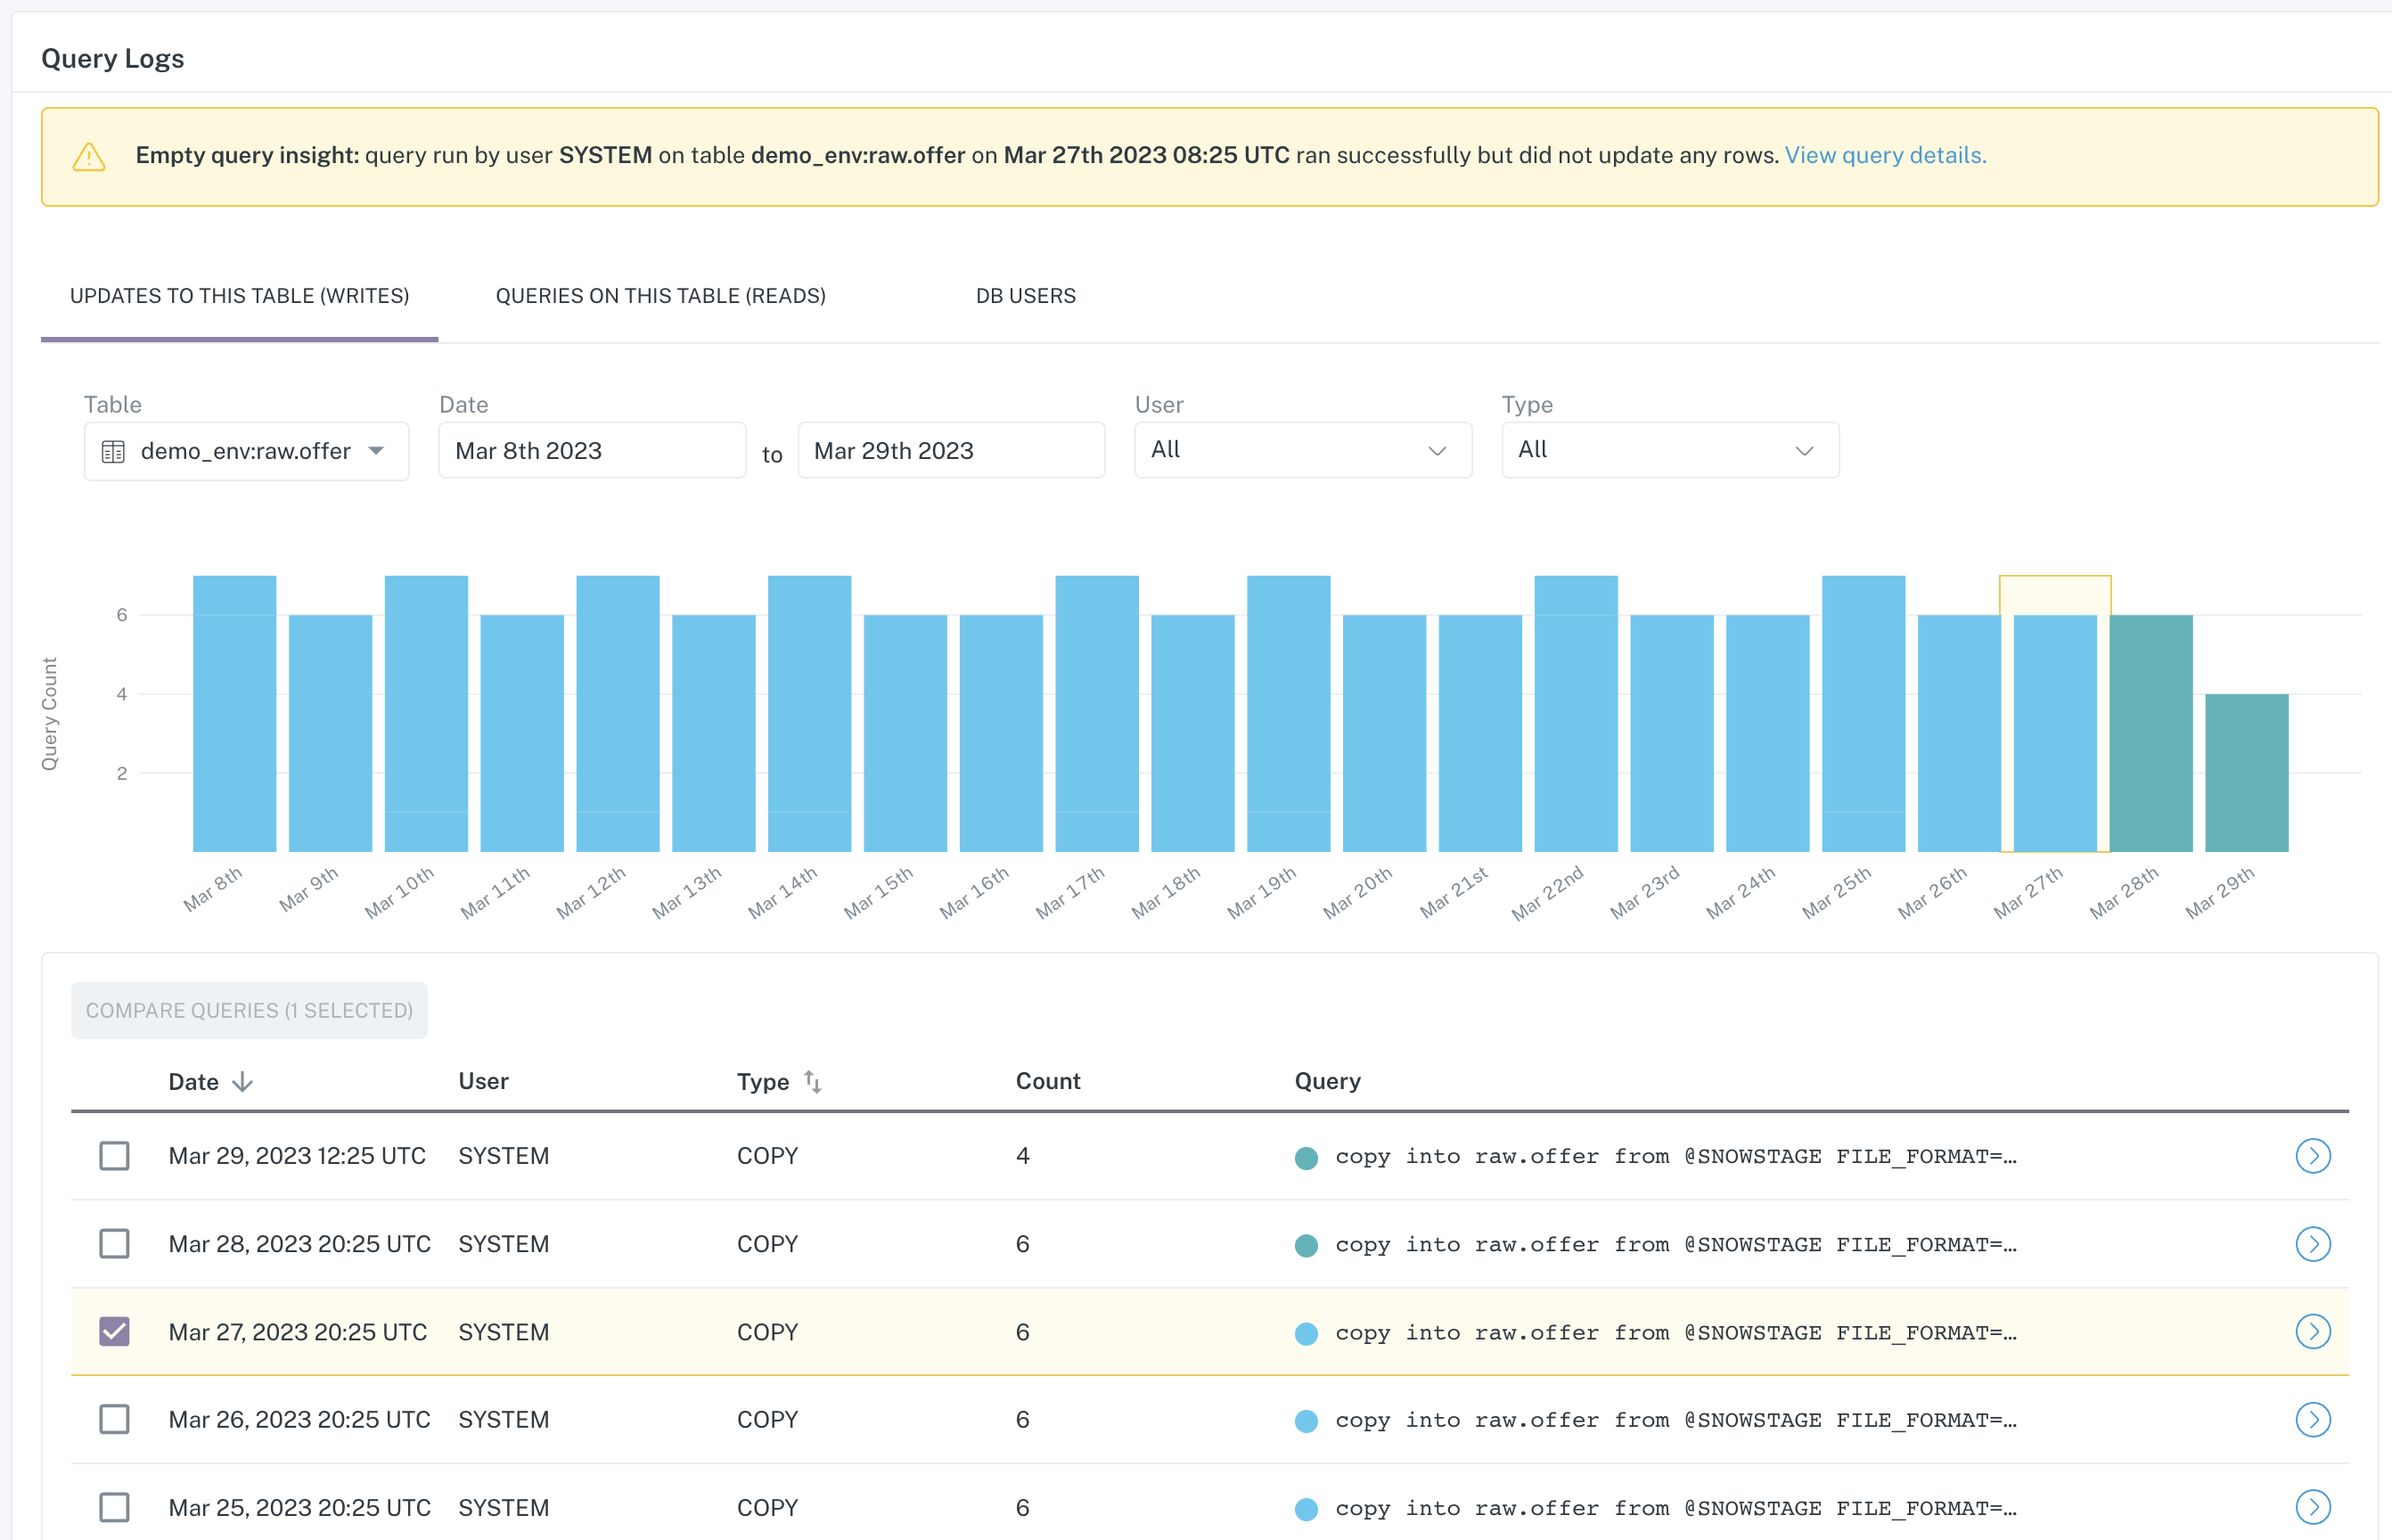
Example: Empty query insight on the Query Logs tab of Incident IQ
RCA insight availability
| Monitoring type | Incident type | Insights available by warehouse |
|---|---|---|
| Table Monitor: freshness | Out of date | Query change - All warehouses Failed query - All warehouses Empty query - Snowflake & BigQuery only |
| Table Monitor: volume | Exceptional volume addition | Volume correlation - All warehouses |
| Table Monitor: volume | Exceptional volume deletion | Volume correlation - Snowflake only |
| Table Monitor: volume | Unchanged size | Failed query - All warehouses Empty query - Snowflake & BigQuery only |
| Opt-in field health monitor | Anomalous field metrics (% null, % negative, % zero, % unique) | Field health correlation - All warehouses Query change - All warehouses |
Note: All warehouses includes Snowflake, BigQuery and Redshift. Data lakes (including Databricks) do not currently have automated insights functionality
Updated about 1 month ago