Agent Management
About
This page provides additional resources for managing a customer-hosted Agent in AWS, Azure, or GCP. Information on managing agents for native apps or other generic cloud deployments can be found in their respective hubs.
To learn more about the agent architecture and deployments, please refer to the Platform Overview documentation.
Prerequisites
- Monte Carlo Role: You must have the Account Owner role in Monte Carlo to upgrade and manage information about the agent.
- Monte Carlo Hybrid Deployment: You must have a Hybrid Agent already deployed. Learn more about what this entails here and here.
- Monte Carlo API or CLI: Certain operations might suggest or require using the Monte Carlo API or CLI. For the API, you can either use the API explorer in the Monte Carlo UI or generate an API key and use tools such as cURL or Postman to make API calls. To configure the CLI, please see the documentation here.
- Cloud Vendor Admin: Administrative access to AWS, Azure, or GCP might be necessary to update configurations and review deployments in your cloud vendor of choice. Note that examples generally use the console, but you can always use the API, CLI, or your favorite IaC tool if you prefer.
Monitoring
There are multiple options available to help you monitor your agent. These options might vary by cloud vendor, so please review the subsection that corresponds to your deployment for further details.
All Vendors
The following operations are mostly vendor agnostic and are executed from the Monte Carlo Platform either using the UI, API, or CLI. See here for prerequisites, such as how to use the API or CLI if you haven't done so before.
Testing Agent Reachability from Monte Carlo
This test is helpful to confirm whether Monte Carlo can still access the agent. Although this is automatically done during registration, periodic testing helps validate that the agent remains reachable and responsive. For example, under very heavy load, this operation might time out, indicating that metrics should be reviewed and potential scaling up of your deployment considered.
UI
-
Navigate to the Monte Carlo settings page:
Select the Integrations -> Agents & Data Store tab. -
Find the agent you want to test:
Select the "More Options" icon (vertical ellipsis/kebab), and then select "Test."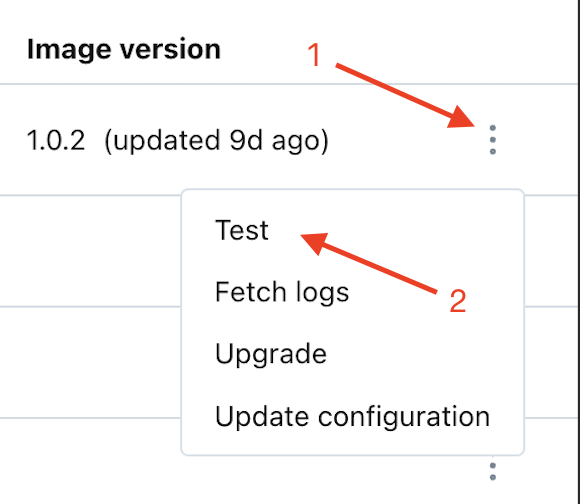
-
Review the results of the test:
Use the on-screen wizard to review the results. You can expand each test for additional details.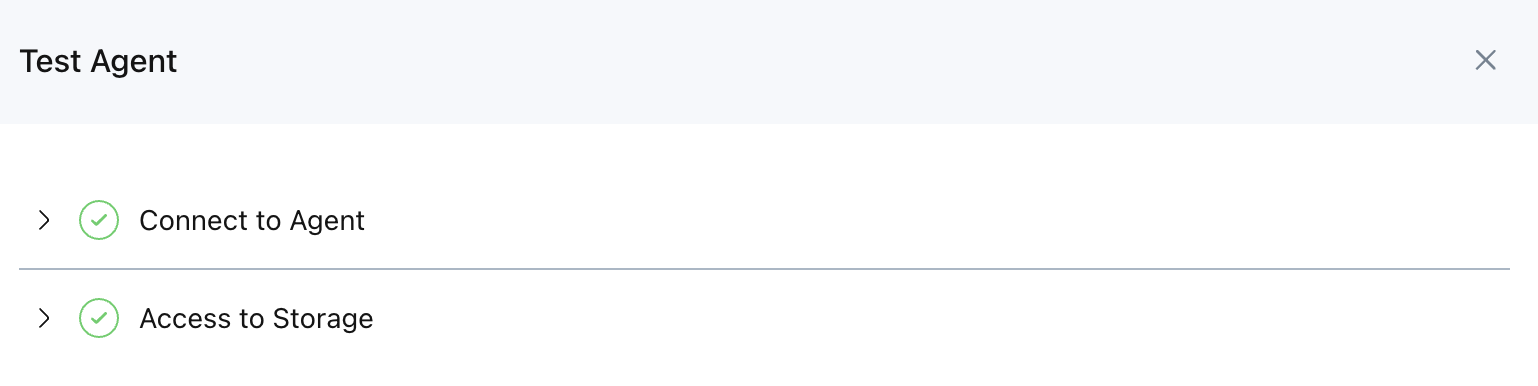
API
You can use the testAgentReachability API to validate that the agent is accessible. Note that you will need the Agent ID first, which you can fetch via the getPlatformServices API. For instance:
query getPlatformServices {
  getPlatformServices {
    deployment {
      deploymentType
      agent {
        endpoint
        uuid
      }
    }
    connections {
      name
      uuid
      connectionType
    }
  }
}

query testAgentReachability {
  testAgentReachability(agentId: "<UUID from getPlatformServices>") {
    success
    errors {
      cause
      stackTrace
      friendlyMessage
    }
    additionalData {
      returnedData
    }
  }
}
To learn more about the deployment type listed above, see here.
CLI
You can use the health command to validate that the agent is accessible.
Note that you will need the Agent ID first, which you can fetch via the list command.
Reviewing Agent Logs in Monte Carlo
This is useful when you want to review agent operations, such as queries being executed, or if any errors are being raised by your agent. Most Monte Carlo logged operations will also include a trace ID, which is helpful for tracing an execution or sharing with support when debugging an operation.
Note that the UI only fetches the last 1000 logs from the last 5 minutes. For the most granularity and ability to filter, it is recommended to use the API instead. You can also fetch these logs from your cloud vendor if you prefer, as they use the default logging destination for their respective framework (e.g., AWS uses CloudWatch).
UI
-
Navigate to the Monte Carlo settings page:
Select the Integrations -> Agents & Data Store tab. -
Find the agent you want to fetch logs for:
Select the "More Options" icon (vertical ellipsis/kebab), and then select "Fetch logs."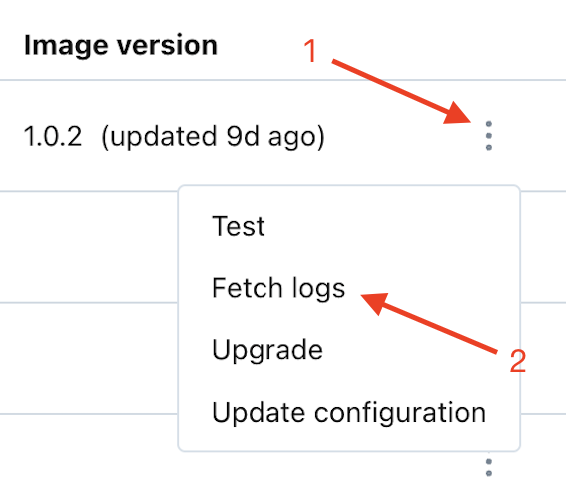
-
Review the results:
Use the on-screen tooling to review the results. You can expand each log message for additional details.
API
You can use the getAzureAgentLogs, getAwsAgentLogs, or getGcpAgentLogs API to validate that the agent is accessible. Note that you will need the Agent ID first, which you can fetch via the getPlatformServices API. For instance:
query getPlatformServices {
  getPlatformServices {
    deployment {
      deploymentType
      agent {
        endpoint
        uuid
      }
    }
    connections {
      name
      uuid
      connectionType
    }
  }
}

query getAzureAgentLogs {
  getAzureAgentLogs(
    agentId: "<UUID from getPlatformServices>"
    startTime: "2024-08-26T14:00:00Z"
    endTime: "2024-08-26T15:00:00Z"
    query: "where message like \"executing operation:\""
  ) {
    timestamp
    payload
  }
}
Some useful queries include:
| Vendor | Description | Example Query |
|---|---|---|
| Azure | Search for operations | where message like "executing operation:" |
| Azure | Search for errors | where message like "error" or message like "fail" |
| Azure | Search by trace ID | where customDimensions.mcd_trace_id == "fd0a9a72-42f0-4b3b-bfdd-abfbce6292b0" |
CLI
You can use the get-operation-logs command to fetch logs.
Note that you will need the Agent ID first, which you can fetch via the list command.
Azure
The following operations are only applicable to Azure Agent deployments.
Logs
Similar to how you can review agent logs from the Monte Carlo Platform, you can fetch and review logs directly from Azure.
The following instructions show how to do this via the Azure Portal, but you can use another tool of your preference.
-
Navigate to your Agent's Resource Group:
From there, filter for "application-insights-mcd-agent-service" and select the corresponding Application Insights resource.Generally, your resource group will use the following naming prefix:
mcd-agent-group-. You can find the full name via theterraform output -raw resource_groupcommand from the module.
Azure Console Example
-
From the Monitoring subsection, select Logs
From there, you can type in your query and execute it.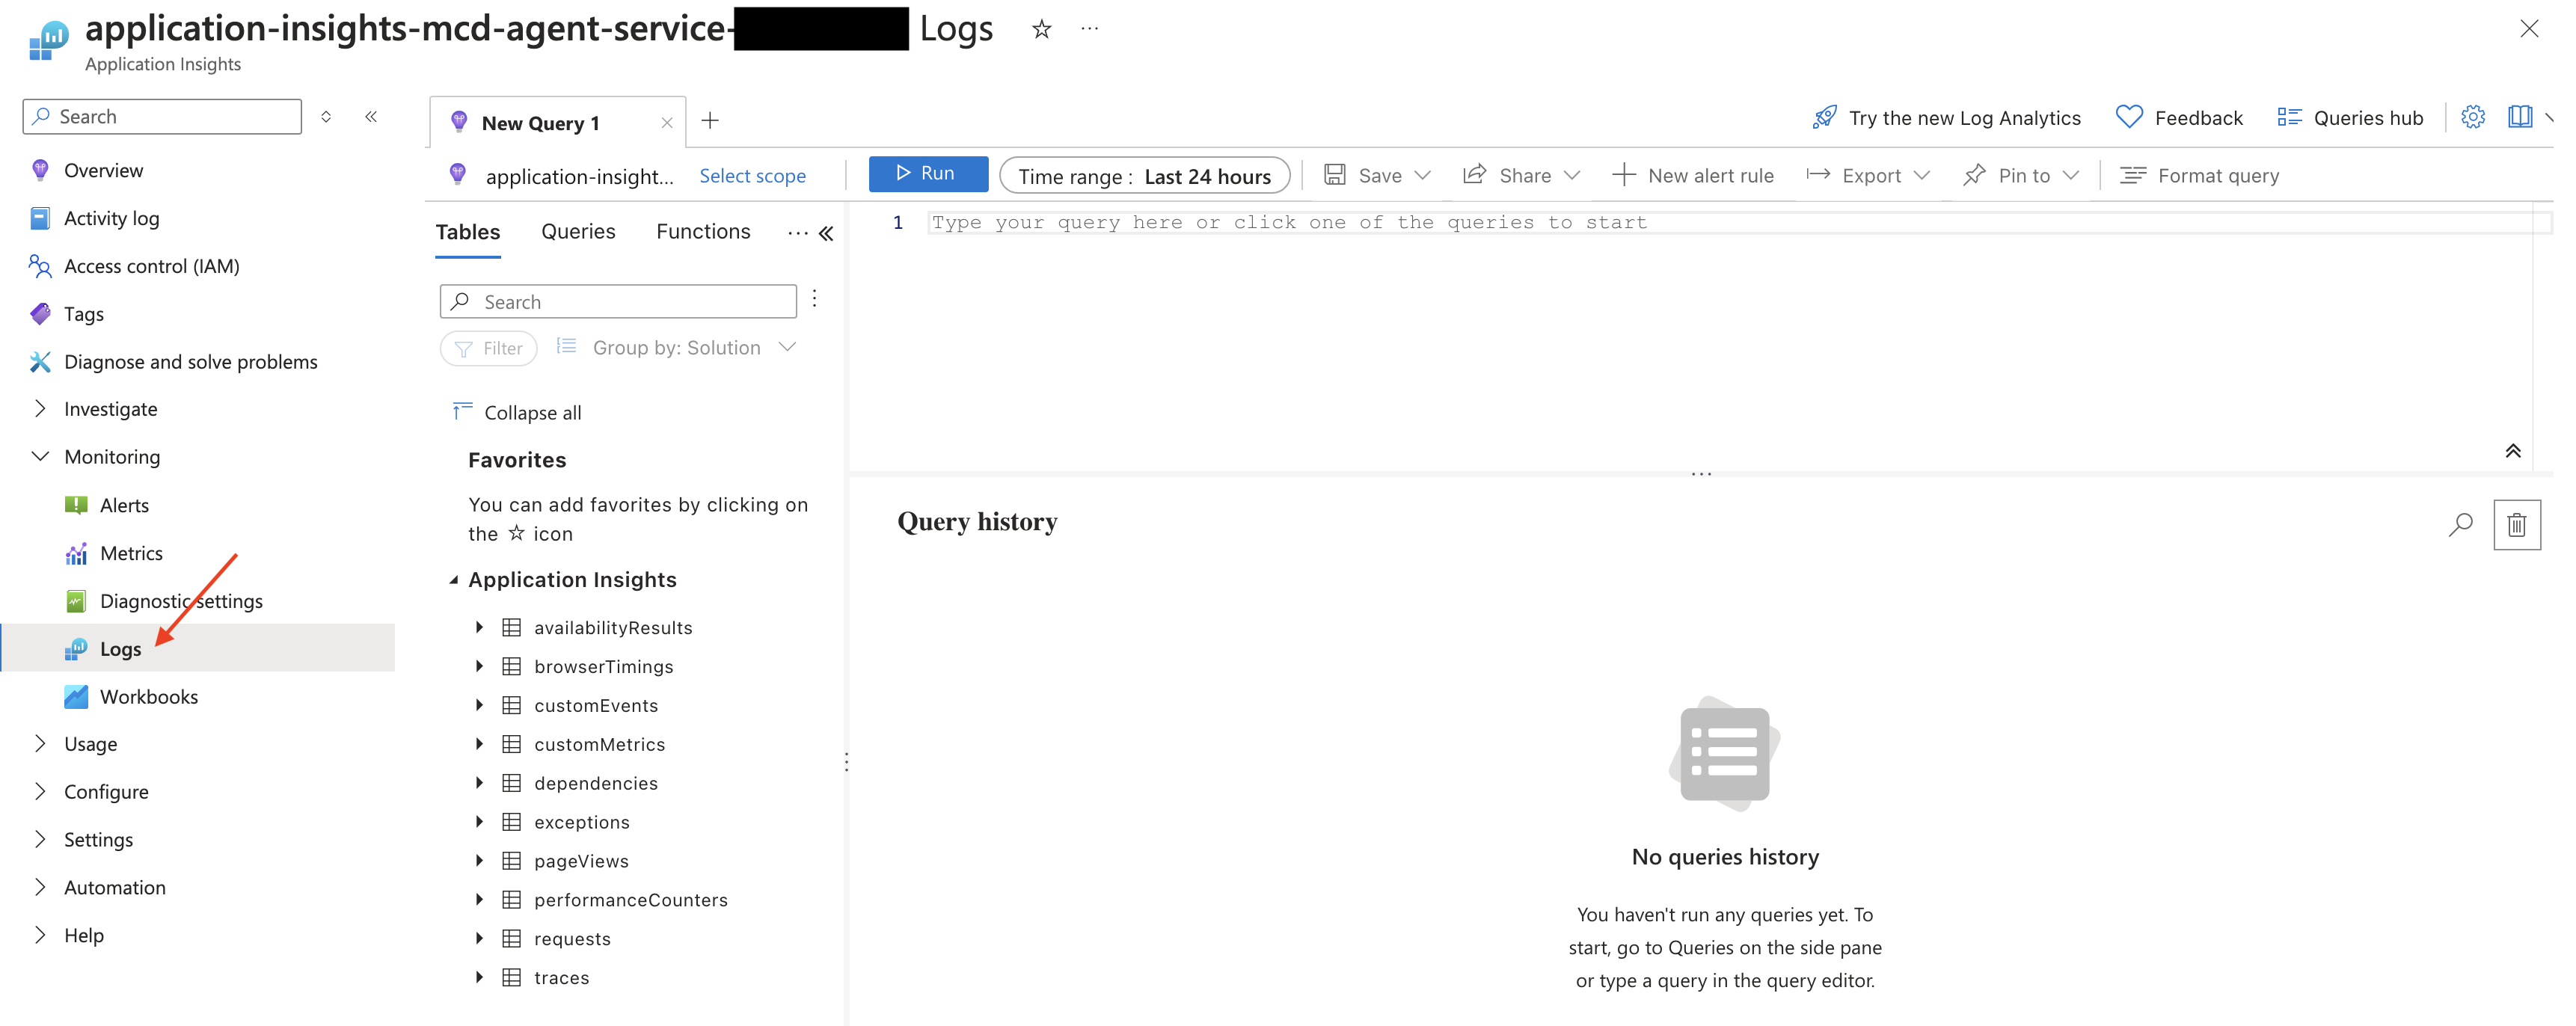
Azure Console Example
Some useful queries are listed below.
Description Query Example Search for errors traces | where (message like "error" or message like "fail") and customDimensions.mcd_operation_name != 'storage/read_json' and not(message like 'Host initialization') and not(message like 'LanguageWorkerOptions' and not(message like 'Retrying request')) Search for operations traces | where message like "executing operation:" | project timestamp, message, customDimensions Search by trace ID traces | where customDimensions.mcd_trace_id == "233f019f-21ed-447d-8635-cc25efe138d3" | order by timestamp asc Search for the start of an execution traces | where message like "Started async operation"
You can also use these log insights to create alerts that notify you when an error occurs (e.g., by creating an alert rule using the error queries outlined above). Note that an occasional error isn't always necessarily an indicator of a major issue. It should still be looked into, but generally, those types of problems generate multiple errors within a short window. For instance, you can set the aggregation and evaluation frequency to hour, with a threshold greater than 20, to be proactively notified about multiple errors raised by the agent. Note that creating alerts and metrics might incur additional costs.
Metrics
There are multiple useful metrics available to see how your agent is performing. A few handy ones are listed below.
CPU and Memory
-
Navigate to your Agent's Resource Group:
From there, filter for "mcd-agent-service-plan" and select the corresponding App Service plan.Generally, your resource group will use the following naming prefix:
mcd-agent-group-. You can find the full name via theterraform output -raw resource_groupcommand from the module.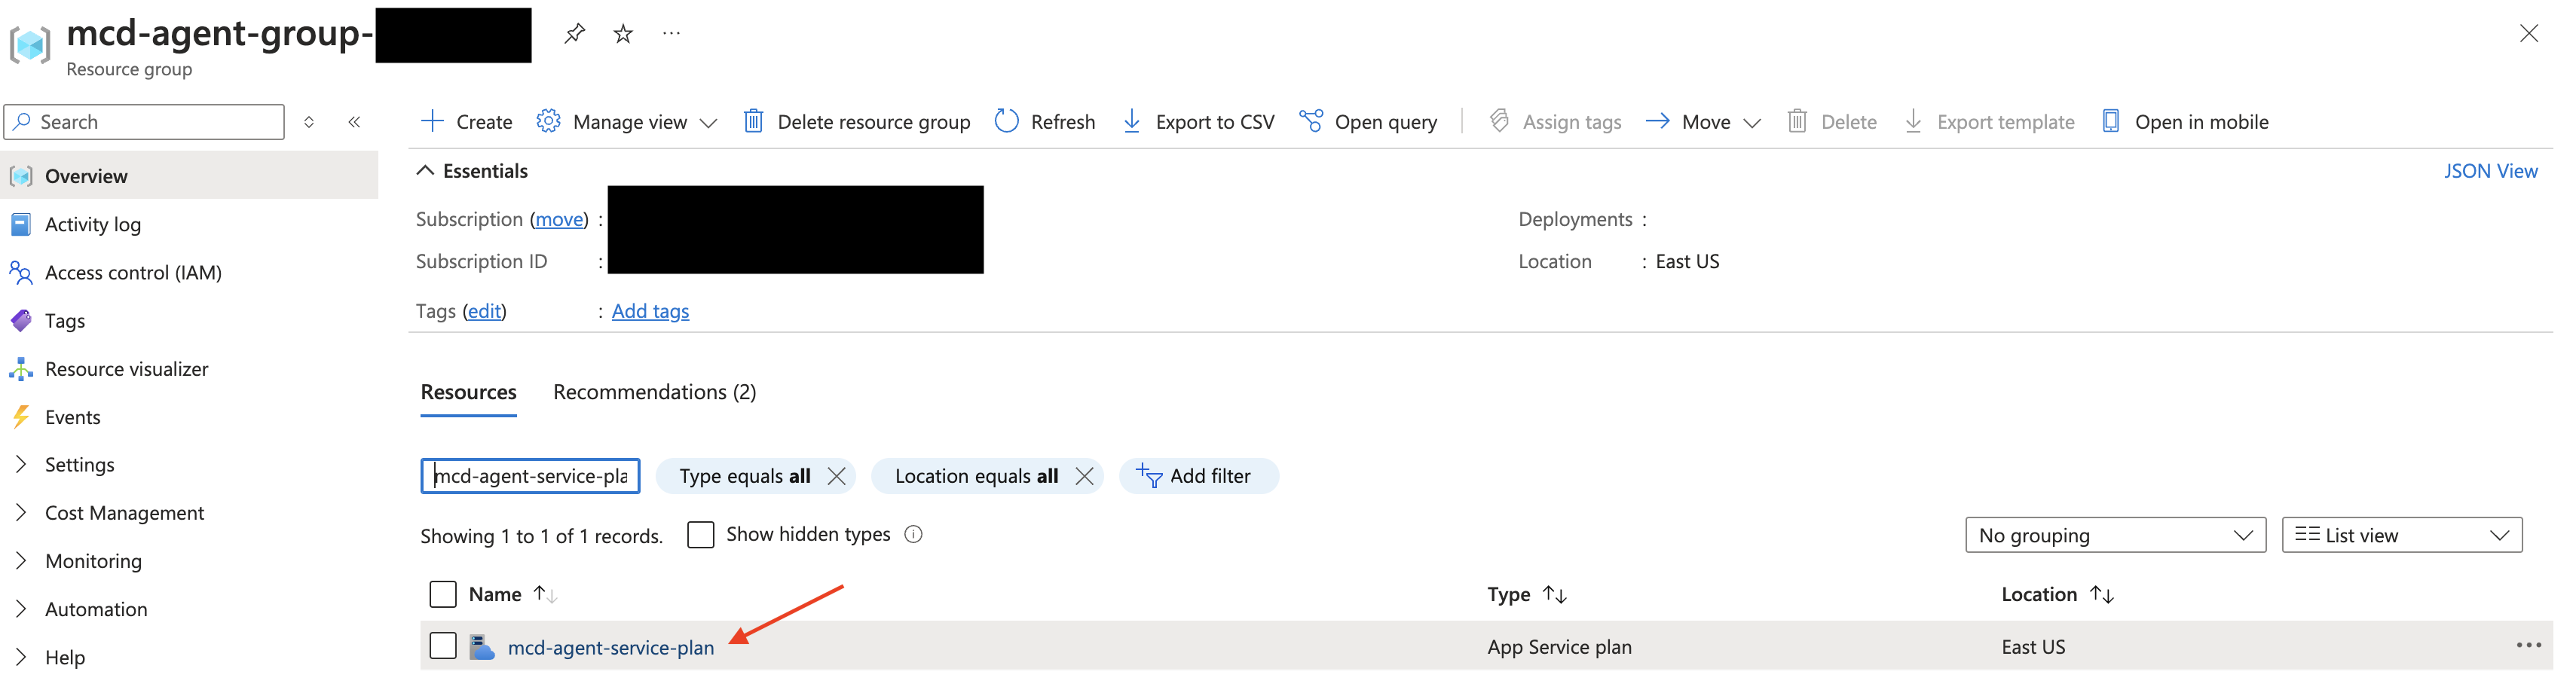
Azure Console Example
-
From the Monitoring subsection, select Metrics
From there, you can filter for "CPU Percentage" and "Memory Percentage" to review the results.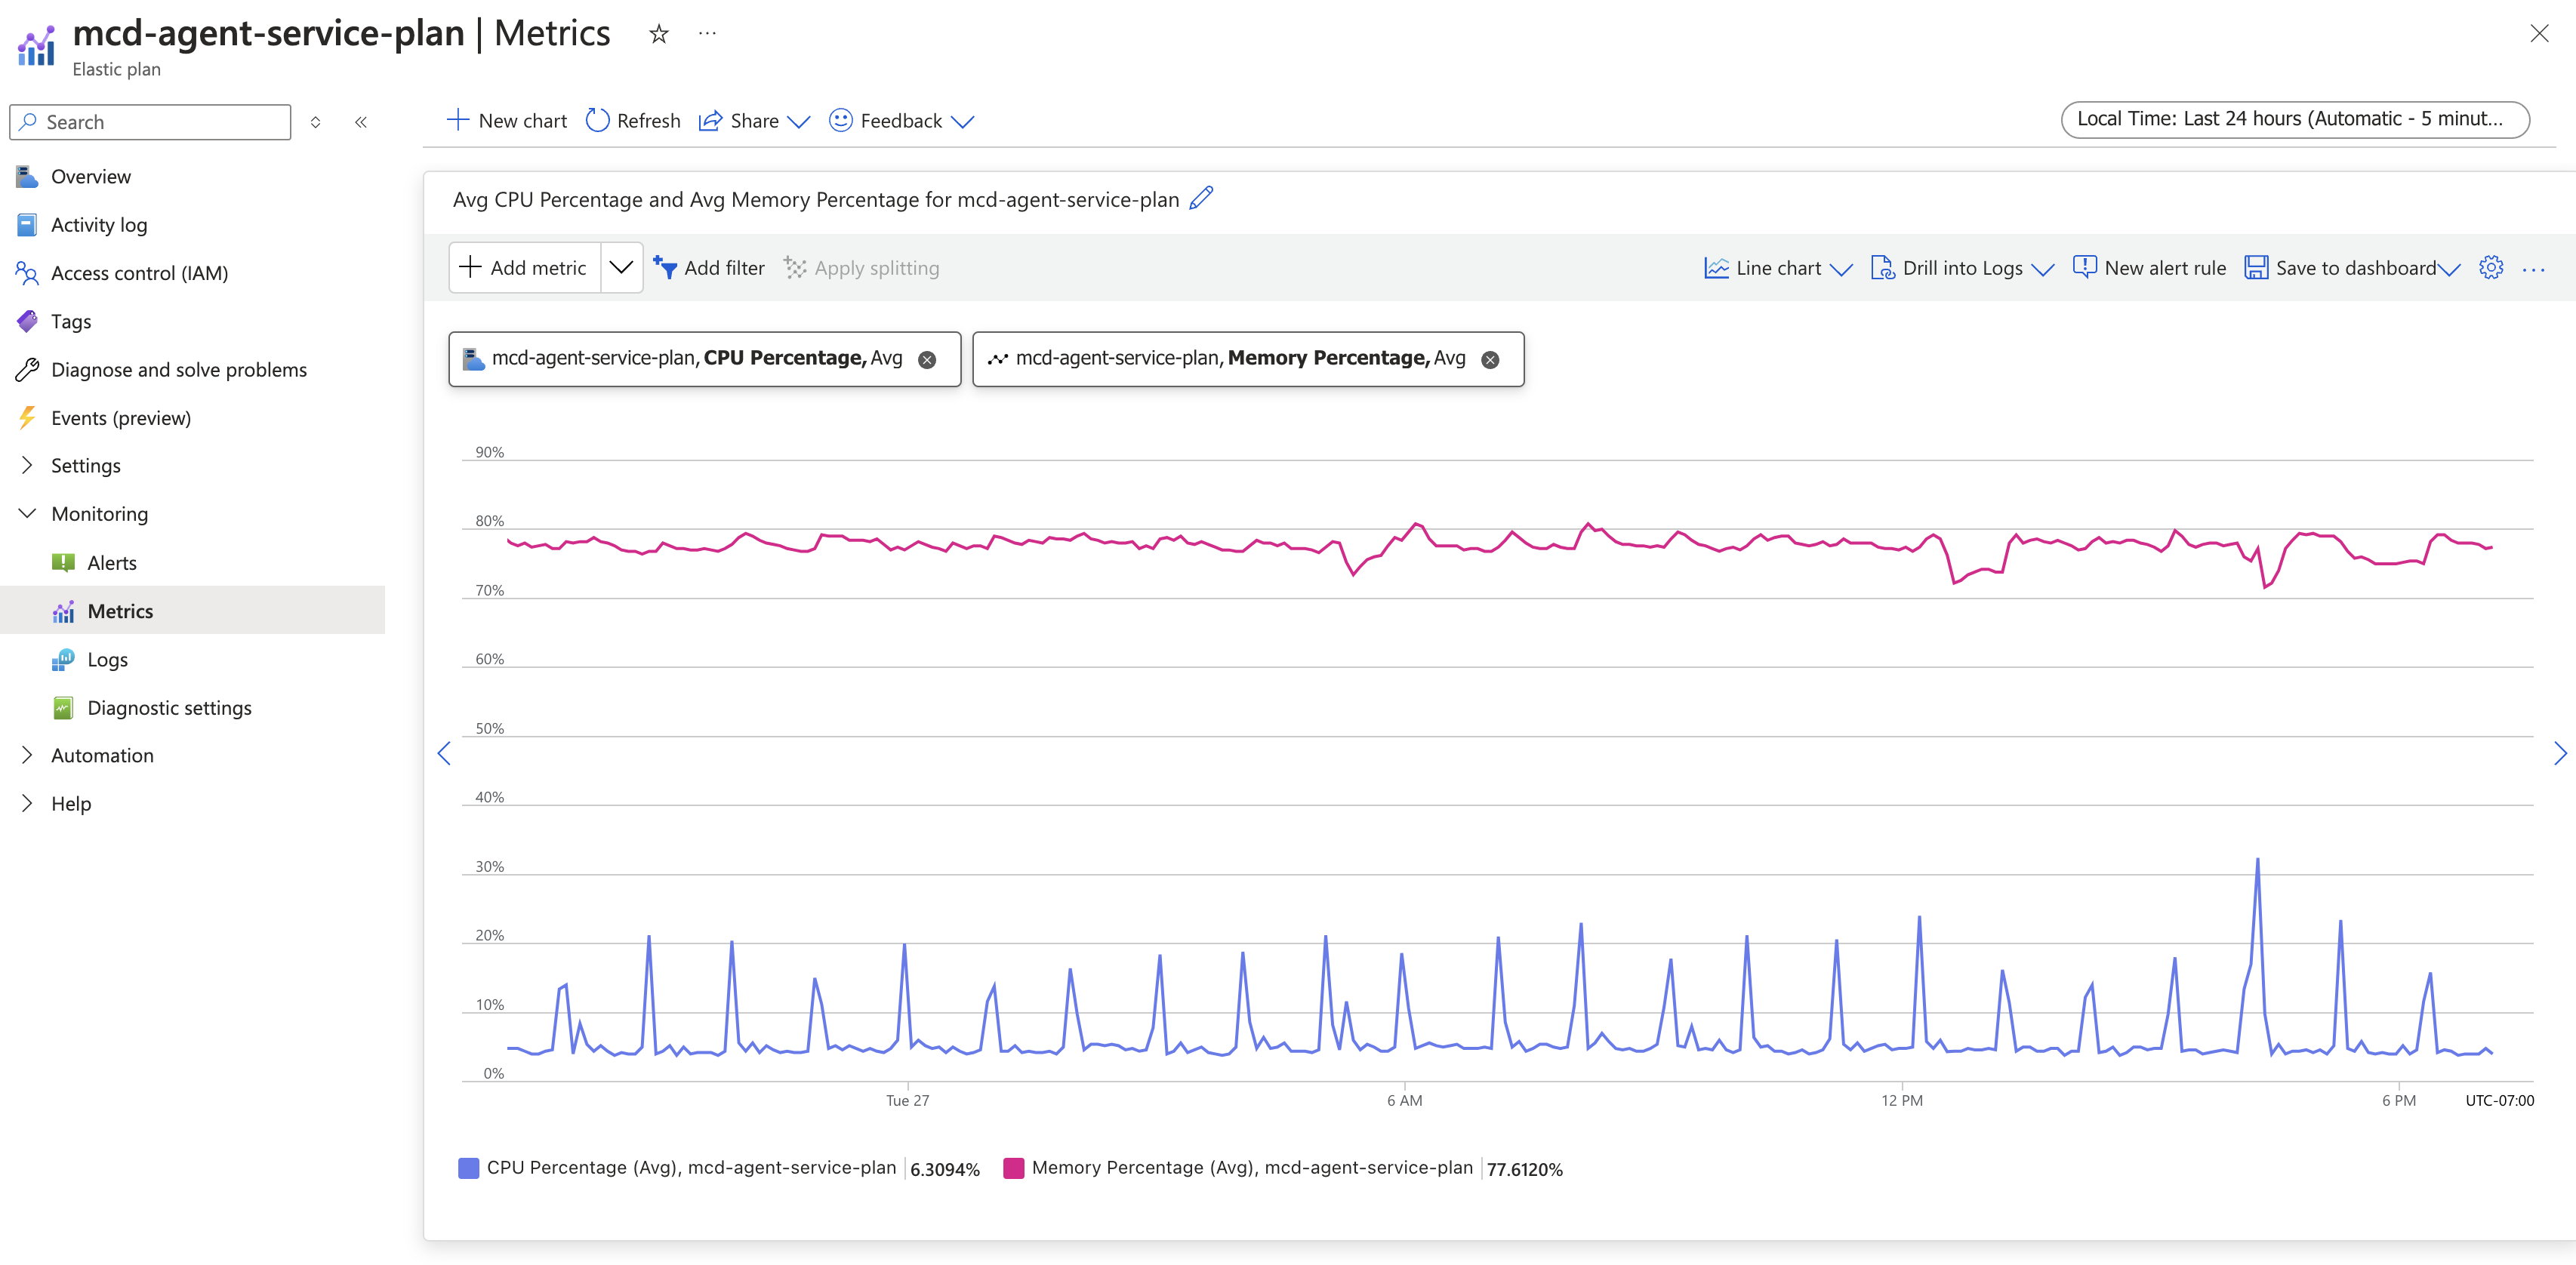
Azure Console Example
You can also use these metrics to create alerts that notify you when CPU and memory usage is very high (via alert rules). A useful threshold is above 95%. If you frequently see spikes or very high usage, you might want to consider scaling up or out your plan or working with Monte Carlo support to better balance monitors so that they are more evenly spread out or distributed. It's worth noting that the root cause of high load might be from your resources (e.g., warehouse), so it is worth investigating there too. Note that creating alerts and metrics might incur additional costs.
Data In and Data Out
-
Navigate to your Agent's Resource Group:
From there, filter for "mcd-agent-service-plan" and select the corresponding App Service plan.Generally, your resource group will use the following naming prefix:
mcd-agent-group-. You can find the full name via theterraform output -raw resource_groupcommand from the module.
Azure Console Example
-
From the Monitoring subsection, select Metrics
From there, you can filter for "Data In" and "Data Out" to review the results.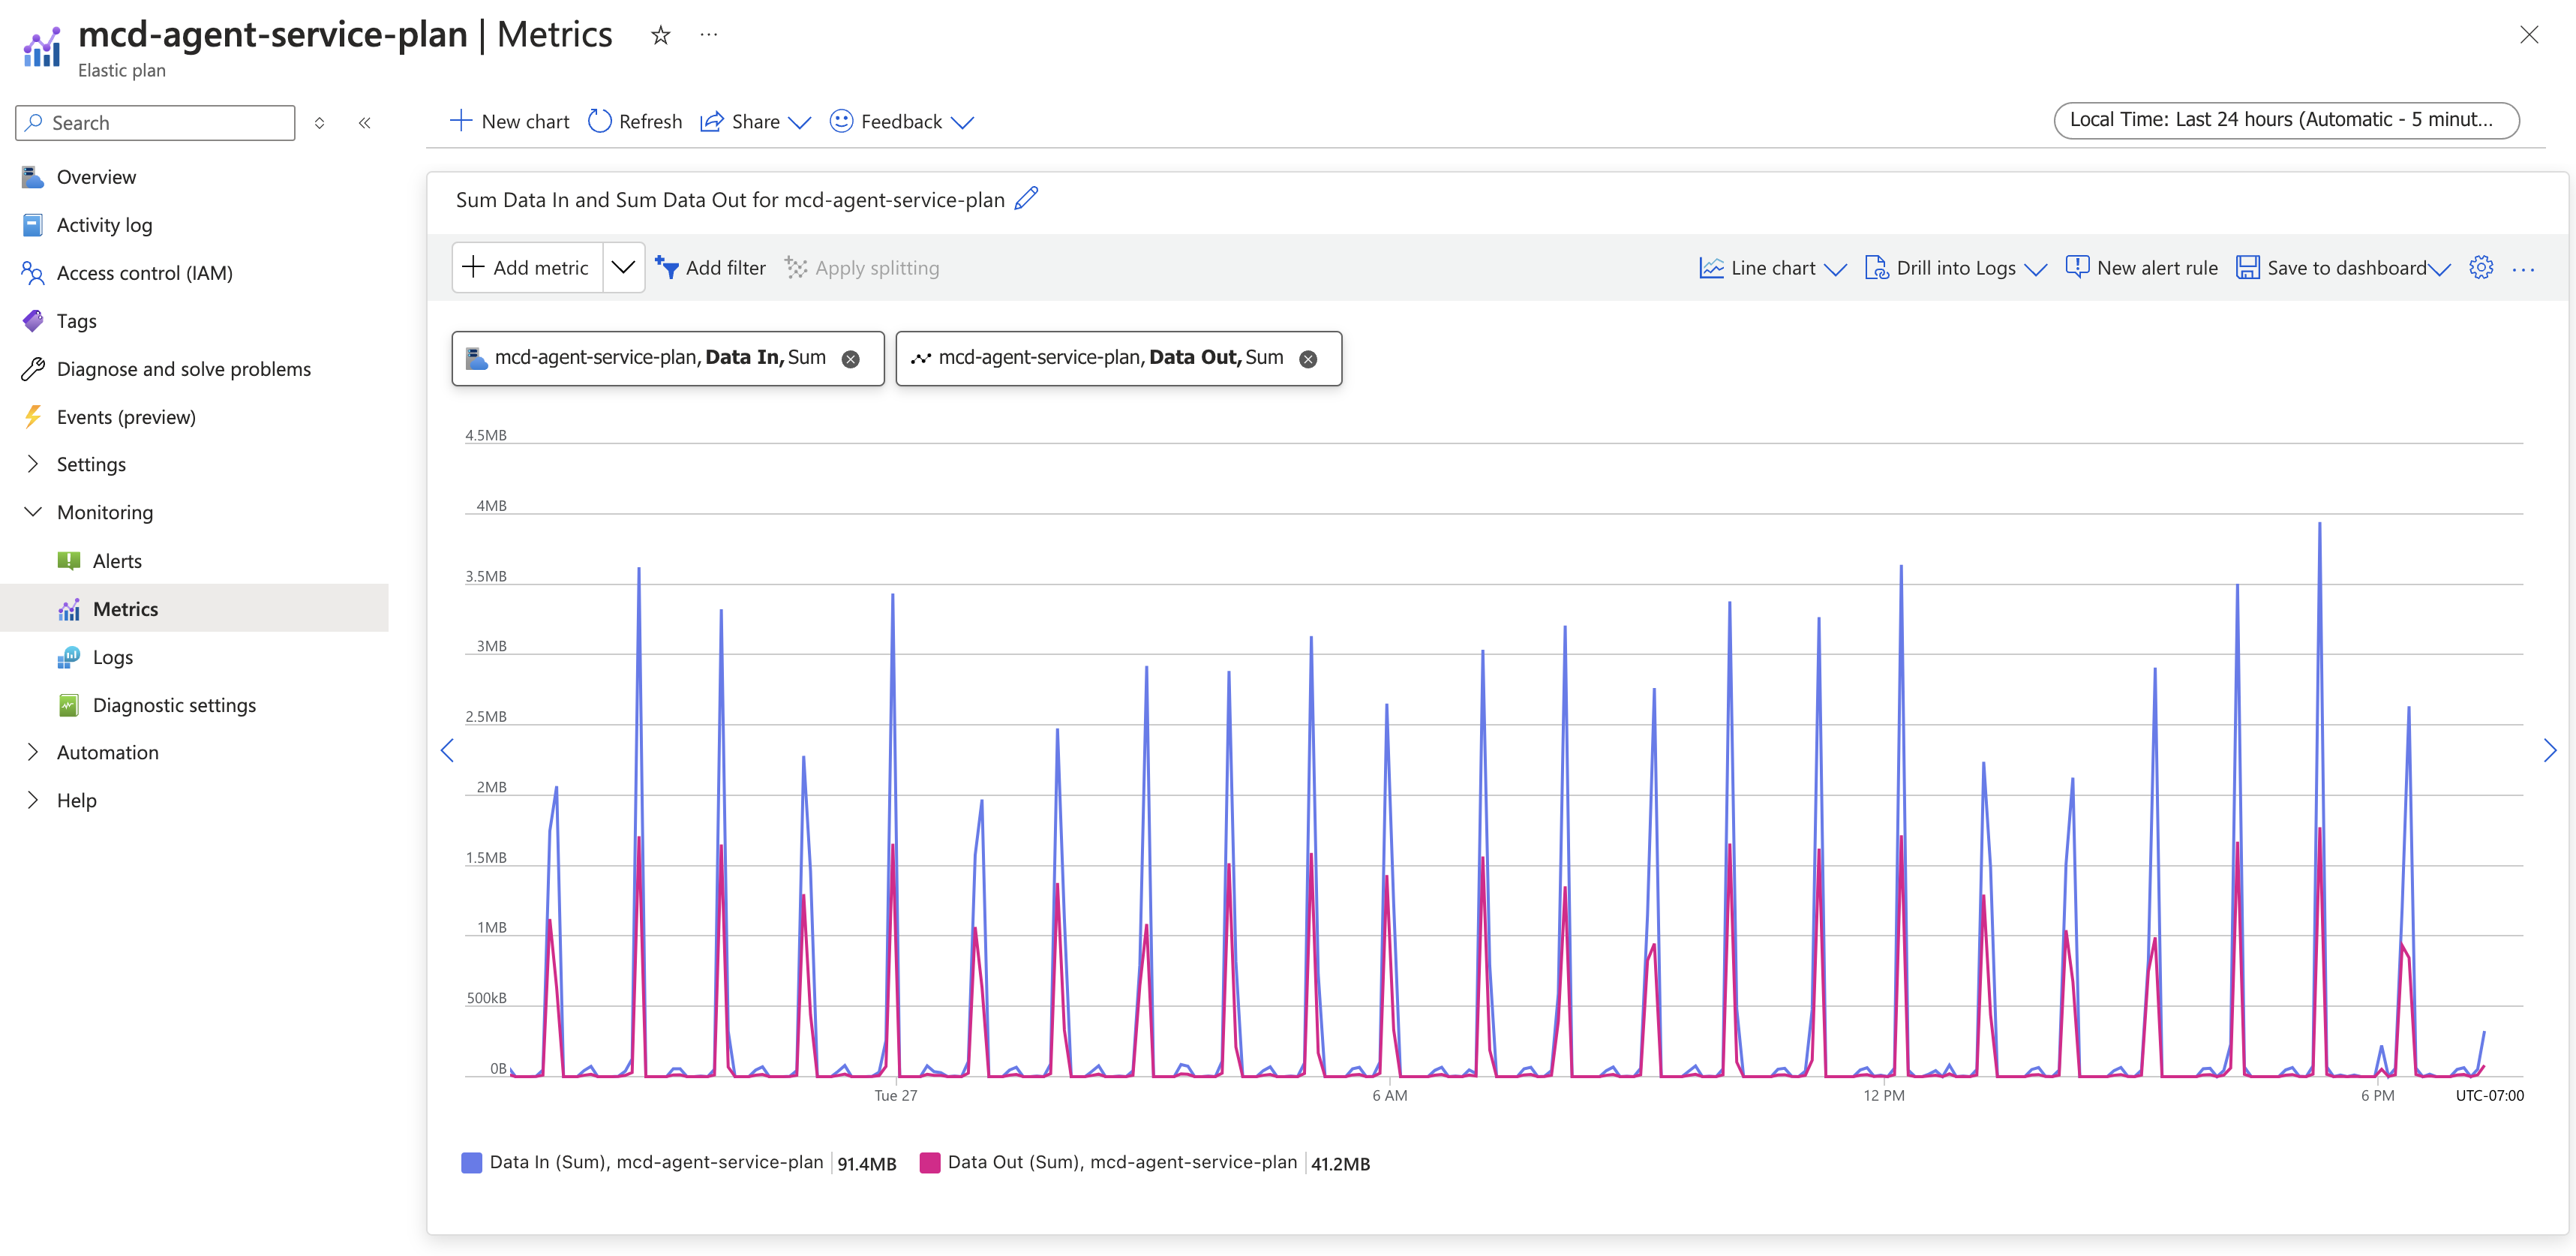
Azure Console Example
You can also use these metrics to create alerts that notify you when Data In and Data Out are at 0 (via alert rules). In normal operations, there should not be extended periods of 0 traffic. This can indicate that Monte Carlo is unable to access your agent and there might be an outage. The reachability tests mentioned above are another good way to help validate this. You should work with Monte Carlo support as soon as possible to restore connectivity and apply a maintenance window. Note that creating alerts and metrics might incur additional costs.
Exceptions
-
Navigate to your Agent's Resource Group:
From there, filter for "application-insights-mcd-agent-service" and select the corresponding Application Insights resource.Generally, your resource group will use the following naming prefix:
mcd-agent-group-. You can find the full name via theterraform output -raw resource_groupcommand from the module.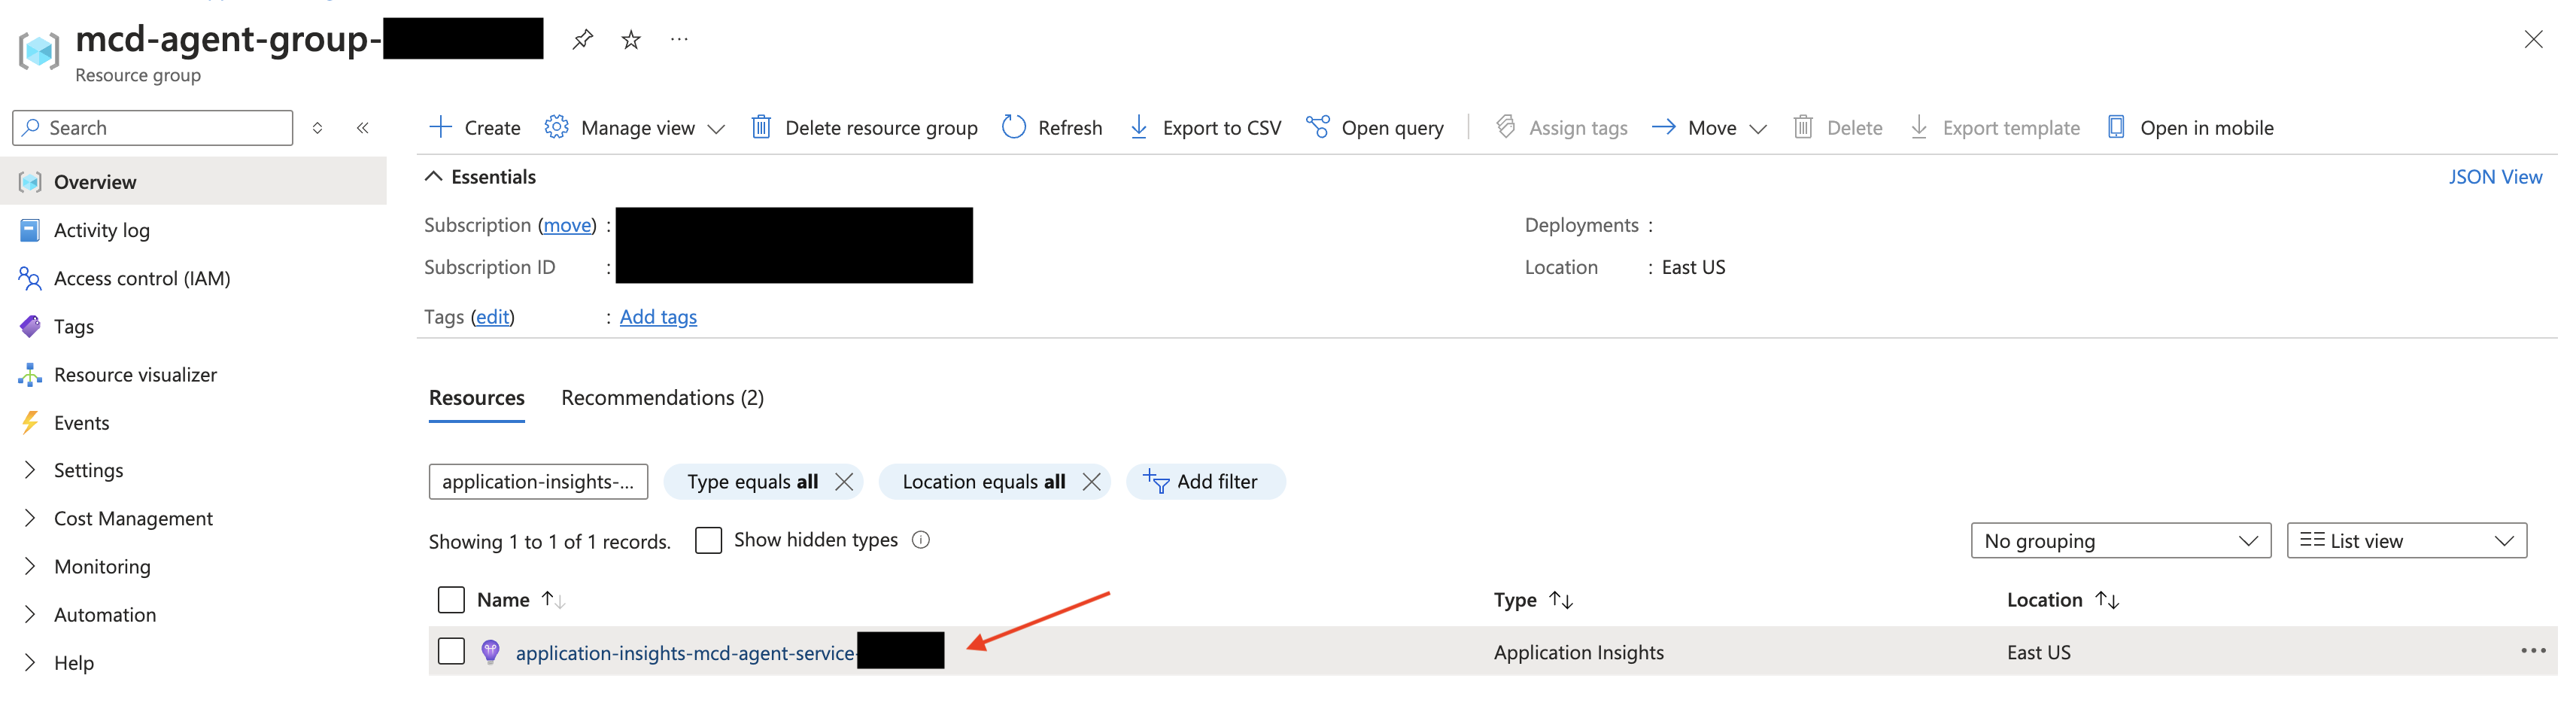
Azure Console Example
-
From the Monitoring subsection, select Metrics
From there, you can select "Exceptions" and review the results.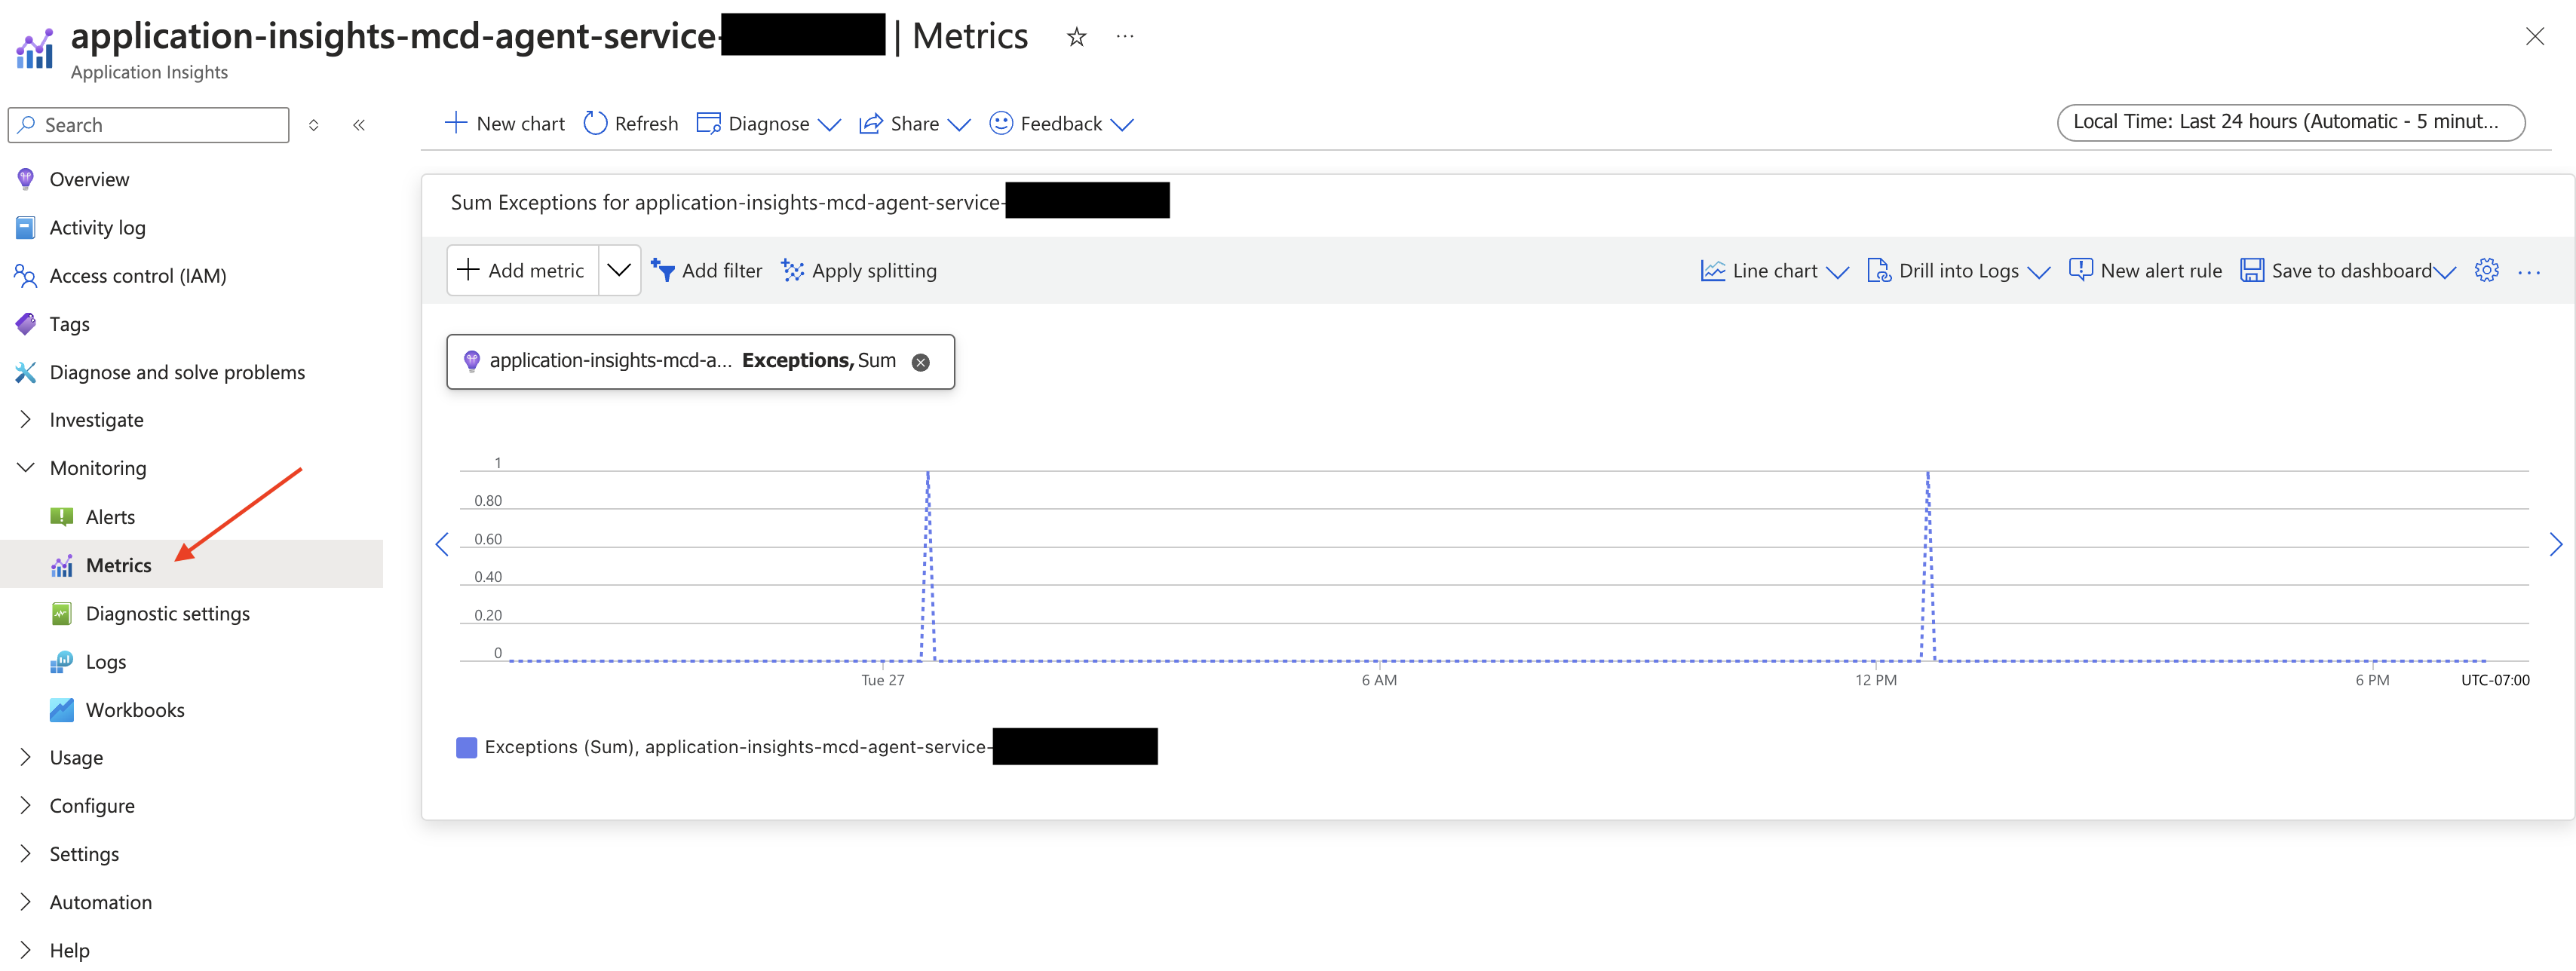
Azure Console Example
You can also use this metric to create alerts that notify you when multiple errors occur (e.g., by creating an alert rule). Note that an occasional exception isn't necessarily an indicator of a major issue. It should still be looked into, but generally, those types of problems generate multiple exceptions within a short window. Note that creating alerts and metrics might incur additional costs.
Scaling
The default configuration works for many deployments, but depending on the number of integrations, resources, types, or monitors, it might require some adjustments to better fit your usage. These options might vary by cloud vendor, so please review the subsection that corresponds to your deployment for further details.
Azure
After reviewing metrics or working with your Monte Carlo team, you might need to adjust your usage plan to increase CPU, memory, or the number of instances.
-
Navigate to your Agent's Resource Group:
From there, filter for "mcd-agent-service-plan" and select the corresponding App Service plan.Generally, your resource group will use the following naming prefix:
mcd-agent-group-. You can find the full name via theterraform output -raw resource_groupcommand from the module.
Azure Console Example
-
From the settings subsection, select Scale Up or Scale Out
From there, you can make the necessary adjustments. Scaling Up impacts CPU and memory, while Scaling Out impacts the number of instances. Note that these operations can increase the cost of hosting. Note that certain changes might cause a drift if you are using the default Terraform module. It is always recommended to review the plan and make changes in Terraform whenever possible.
Upgrading
It's recommended to always keep your agent up-to-date, as updates can contain important fixes and security enhancements.
Updates consist of both code and templates. You can review the change log for the code here, and similarly, review infra changes based on how you deployed (AWS, Azure, and GCP).
Managing code updates is part of your shared responsibility, even when remote upgrades are enabled. You can track new releases by following the corresponding public Git repositories.
Code
Remote Upgrades Enabled (Default)
If you haven't opted out of remote upgrades, Monte Carlo can trigger code updates on your behalf. If you would still like to explicitly upgrade, you can do so via the Monte Carlo UI by following the steps below:
- Navigate to the Monte Carlo settings page:
Select the Integrations -> Agents & Data Store tab. - Find the agent you want to test:
Select the "More Options" icon (vertical ellipsis/kebab), and then select "Upgrade."
You can also use the upgrade command on the Monte Carlo CLI if you prefer. This allows you to specify a tag.
% montecarlo agents upgrade --image-tag -1
Defaulting to lambda image variants because platform is AWS
? Please choose a valid image tag (Use arrow keys)
 » 1.2.14-lambda
   1.2.13-lambda
   1.2.12-lambda
   1.2.11-lambda
   1.2.10-lambda
Alternatively, if you're using the Azure Agent, you can follow these steps on the Azure Console:
- Navigate to Function -> Deployment -> Deployment Center.
- Update the "Full Image Name and Tag" to
montecarlodata/agent:latest-azure. - Save your changes.
Please note that the version displayed in the Monte Carlo UI may take 1-2 hours to update. However, you can always fetch the latest version and other details by running a reachability test. For more information, see here.
Remote Upgrades Disabled
If you have opted out of remote upgrades, you can upgrade the agent image via your deployment. You can find the available image tags on Docker Hub, searching by the "family" suffix that matches your deployment:
| Vendor | Tag suffix | Example |
|---|---|---|
| AWS Lambda | -lambda | 1.4.20-lambda |
| Azure | -azure | 1.4.20-azure |
| GCP Cloud Run | -cloudrun | 1.4.20-cloudrun |
Please note that if you deployed the AWS Lambda agent via the default Terraform or CloudFormation configuration (which uses Monte Carlo's ECR repository instead of Docker Hub), the tag is just the version number — e.g. 1.4.20 — without the -lambda suffix.
Then, follow the corresponding steps to apply the new tag:
| Vendor | Details |
|---|---|
| AWS | If you have opted out of remote upgrades you can upgrade the agent image by setting the ImageUri parameter in the CloudFormation stack or image variable in the Terraform module. |
| Azure | If you have opted out of remote upgrades (i.e. set remote_upgradable = false) you can upgrade the agent image by setting the image variable in the module. |
| GCP | If you have opted out of remote upgrades (i.e. set remote_upgradable = false) you can upgrade the agent image by setting the image variable in the module. |
Please note that the version displayed in the Monte Carlo UI may take 1-2 hours to update. However, you can always fetch the latest version and other details by running a reachability test. For more information, see here.
Infra
To update your module/template version, please reach out via our Support Agent for further details.
Updated 11 days ago