Data operations
Replacing the data reliability dashboardThe data operations dashboard has replaced some of the content on the data reliability dashboard and the data reliability dashboard is being deprecated. Some of the content has moved to the Activity dashboard. If you have needs around deprecated content, please reach out here.
Overview
The data operations dashboard provides a look at team operational metrics over the last 12 months.
- How quickly are we responding to alerts?
- How many incidents did we have and of what severity?
- How quickly are we resolving incidents?
⚠️ Please note that since this is meant to be a long-term view of team metrics, this dashboard only updates every 6 hours.
Creating dashboards
Use the Add filter or Create dashboard action button to add your own filters to the data operations dashboard. It can be filtered by the various taxonomies available in Monte Carlo:
The following allow for filtering alerts and incidents by a set of tables:
The following allow for filtering alerts and incidents by a set of tables or set of monitors:
Data operations dashboard
Best practice is to review these metrics for your team on a monthly cadence, but some teams use it weekly or quarterly as well. The time filter can be saved to a dashboard in order to frequently revisit the time period that is most appropriate for you.
The preset timeframes are relative when saving; the custom timeframe will remain static.
Using the data operations dashboard
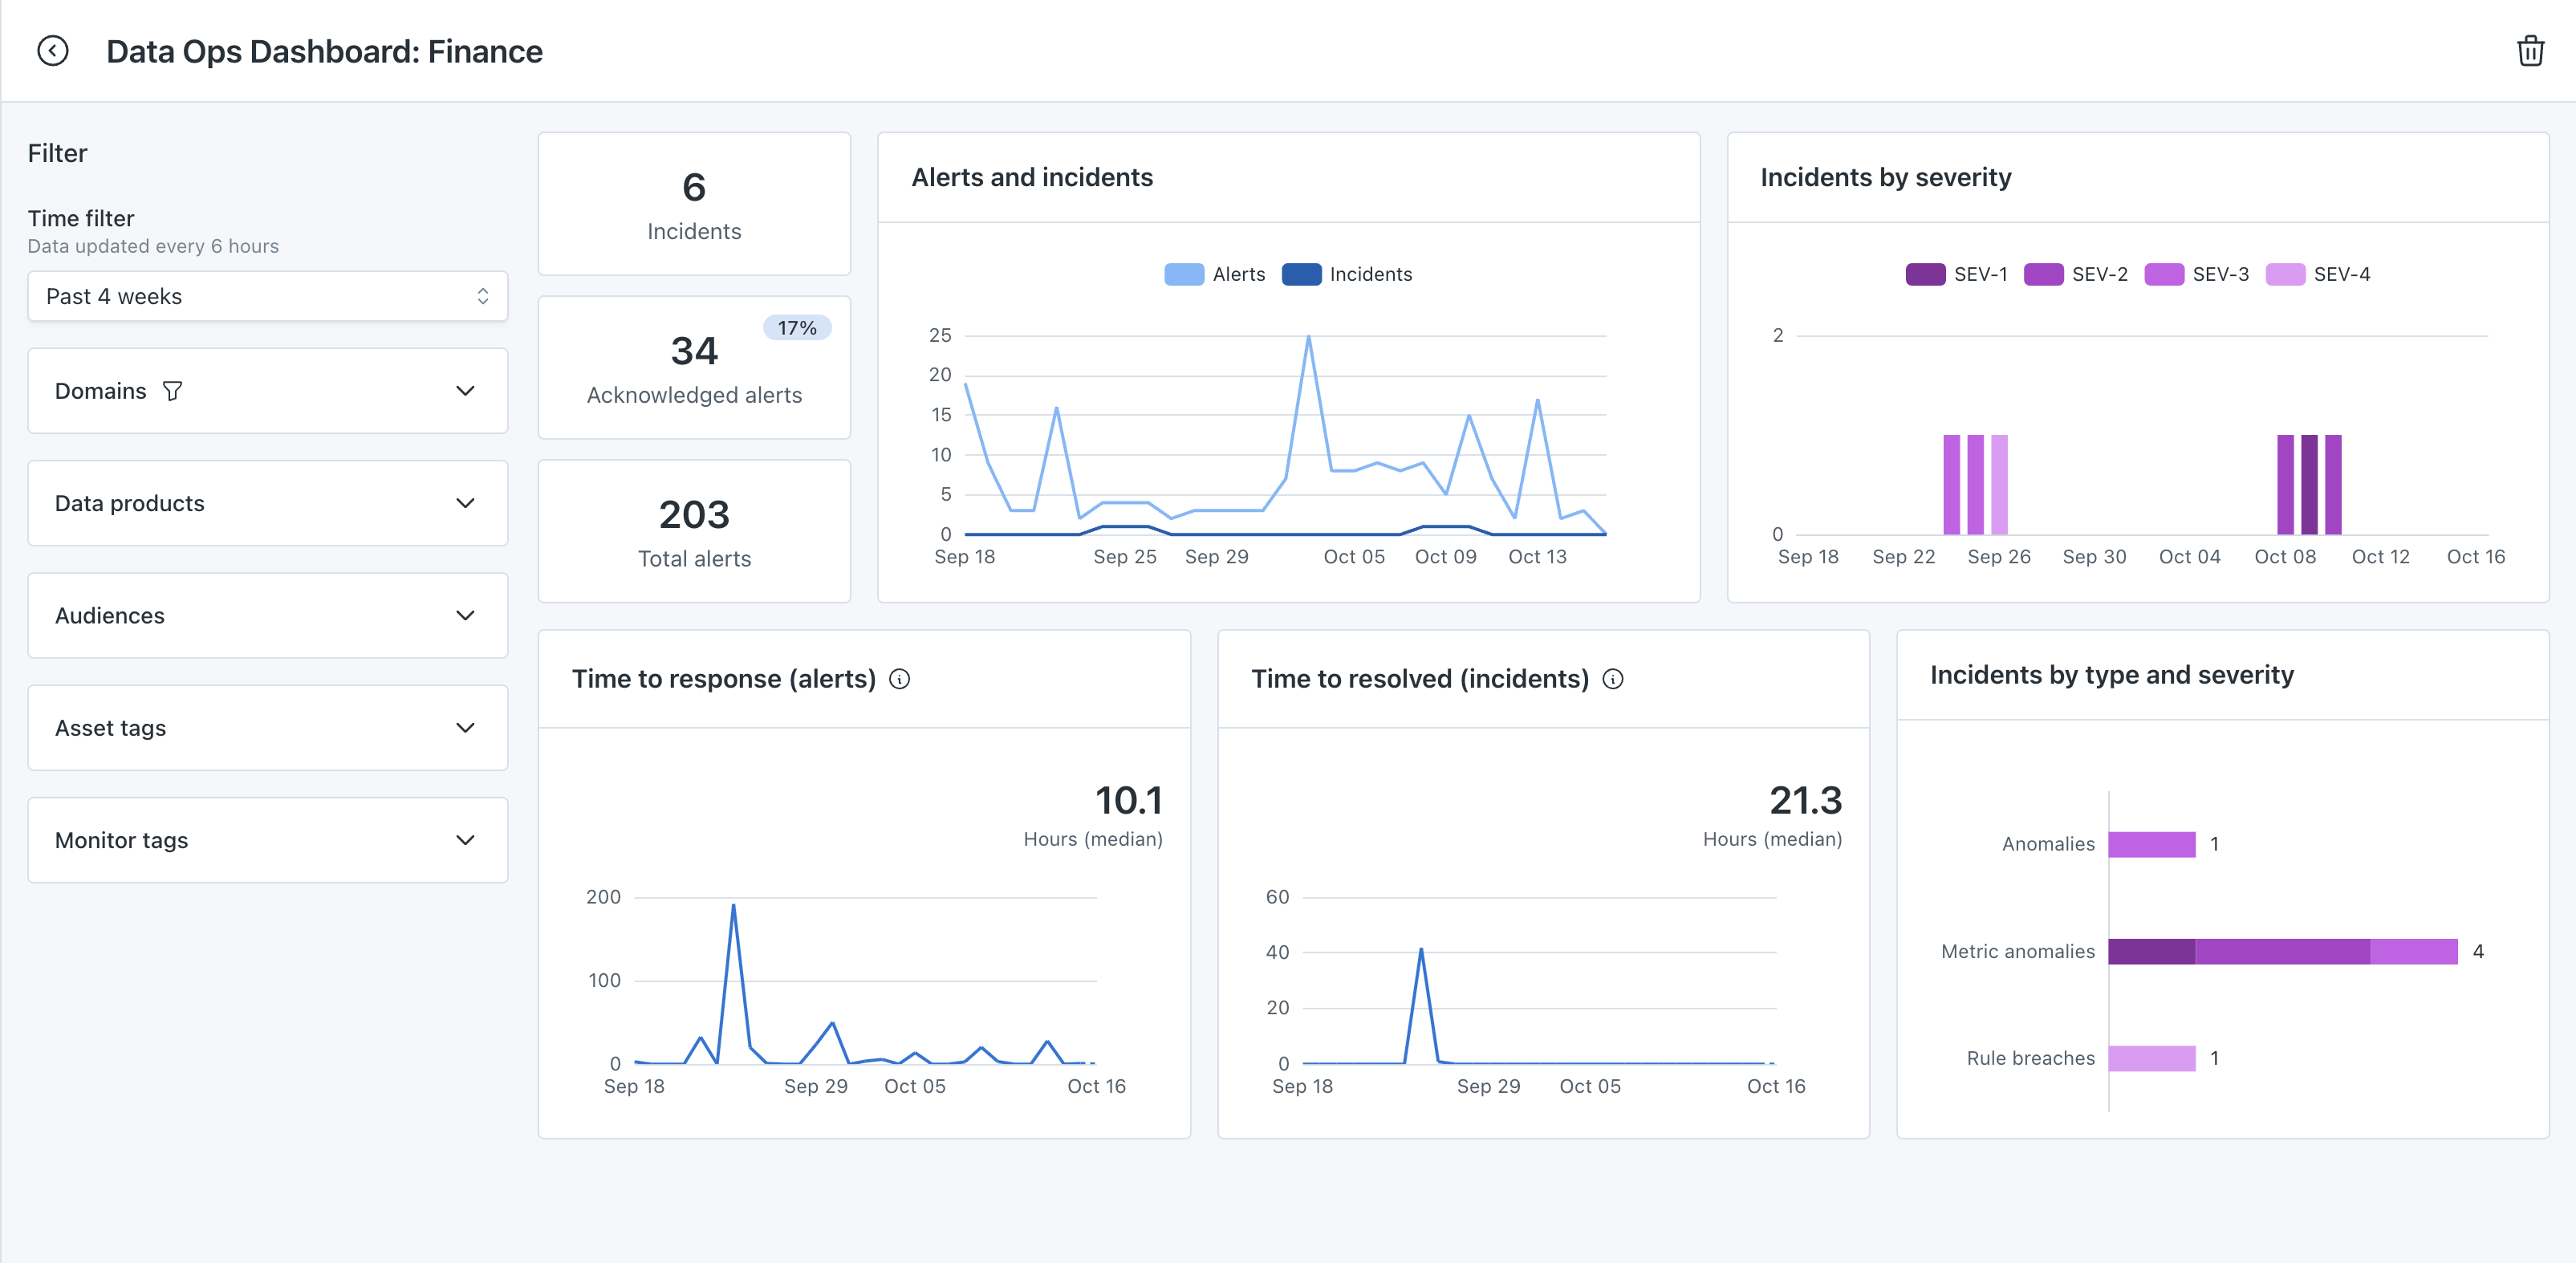
Incidents
Incidents are the alerts that have been marked as incidents using a severity. Best practice is to mark as alert as an incident when an alert is confirmed as an issue or requires work to resolve. Learn more under Marking Alerts as Incidents.
You can drill in to see the alerts marked as incidents in the feed.
Acknowledged alerts
Acknowledged alerts are any that have had been acknowledged, marked as an incident, or resolved. The percentage above denotes the percent of the total alerts that have been acknowledged.
You can drill in to see the acknowledged alerts in the feed.
Total alerts
Completing the top of the funnel is Total alerts. These are all the alerts that Monte Carlo sends. The acknowledged alerts and incidents are subsets of the total alerts.
You can drill in to see all alerts in the feed.
Alerts & incidents
View alerts and incidents trending over time. For both the alerts and alerts marked as incidents, the date is tracked by the timestamp of when the original alert was created.
Incidents by severity
View alerts marked as incidents by the severity that was applied.
You can drill in to see the incidents in the feed.
Time to response (alerts)
Over time, view the time to response for all alerts. Best practice is to measure how quickly a team is acknowledging alerts that are received.
Time to resolved (incidents)
Over time, view the time to resolution for alerts that were marked as incidents. Best practice is to measure time to resolved for incidents rather than tracking for all alerts.
Incidents by type and severity
View alerts marked as incidents by what type of issue occurred and the severity of it.
You can drill in to see the incidents in the feed.
Updated 23 days ago