Interacting with Alerts
Discover and troubleshoot anomalous events happening in the data assets within your data ecosystem from the Alerts pages in Monte Carlo.
Exploring the Alerts Feed
On Alerts, you see a feed of all alerts, past and ongoing. Filters on the left allow you to filter the alerts by:
- Status
- Alert type
- Incident severity
- Priority
- Owner
- Table
- Schema
- Database
- Asset tag
- Audience
- Monitor tag
- Linked issues (Jira / ServiceNow / Opsgenie etc)
Each row in this table is a summary of the alert with a few, quick-access alert management tools that allow you to:
- Assign an owner to the alert
- Classify severity
- Manage status
Each alert has a preview action to see the details of an alert in a preview drawer.
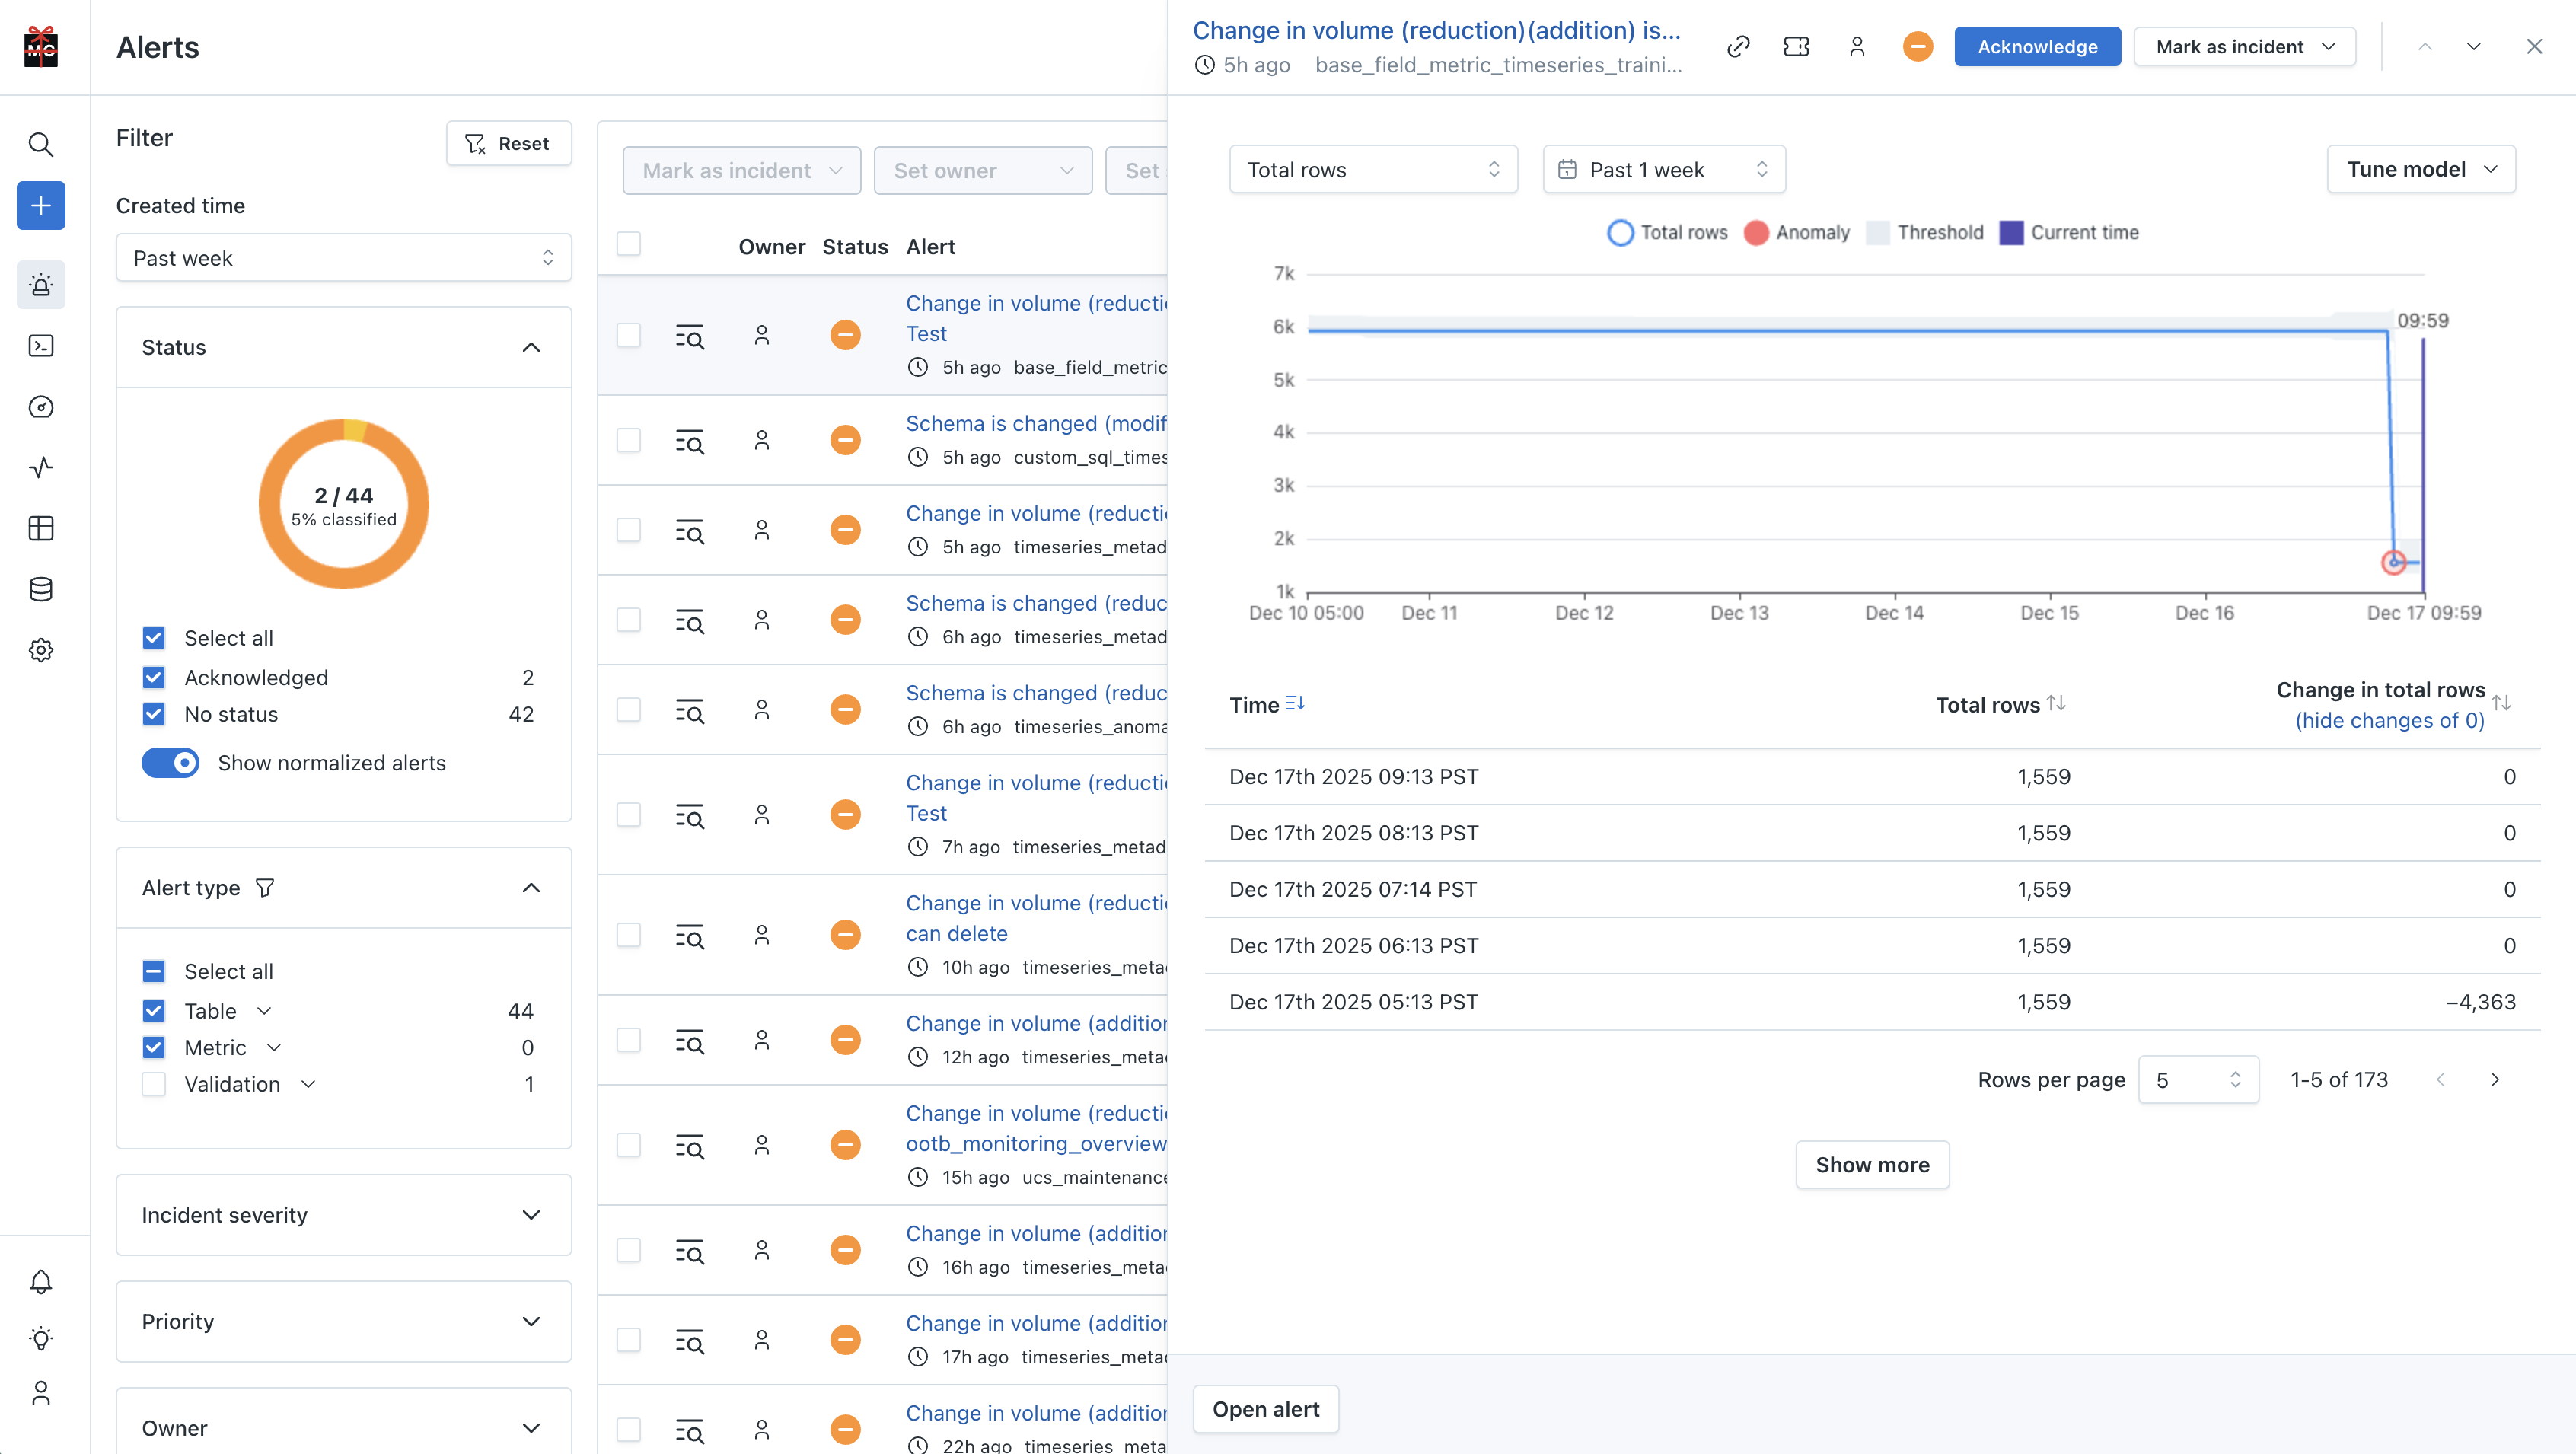
Alert feed with filters applied and preview drawer opened for the first alert
For information on the various types of alerts found in the Alert feed, refer to the Intro to monitors section.
Bulk updating alerts
Select multiple alerts by checking the box at the start of each row. This allows you to assign owner, severity, and status to multiple alerts at the same time.
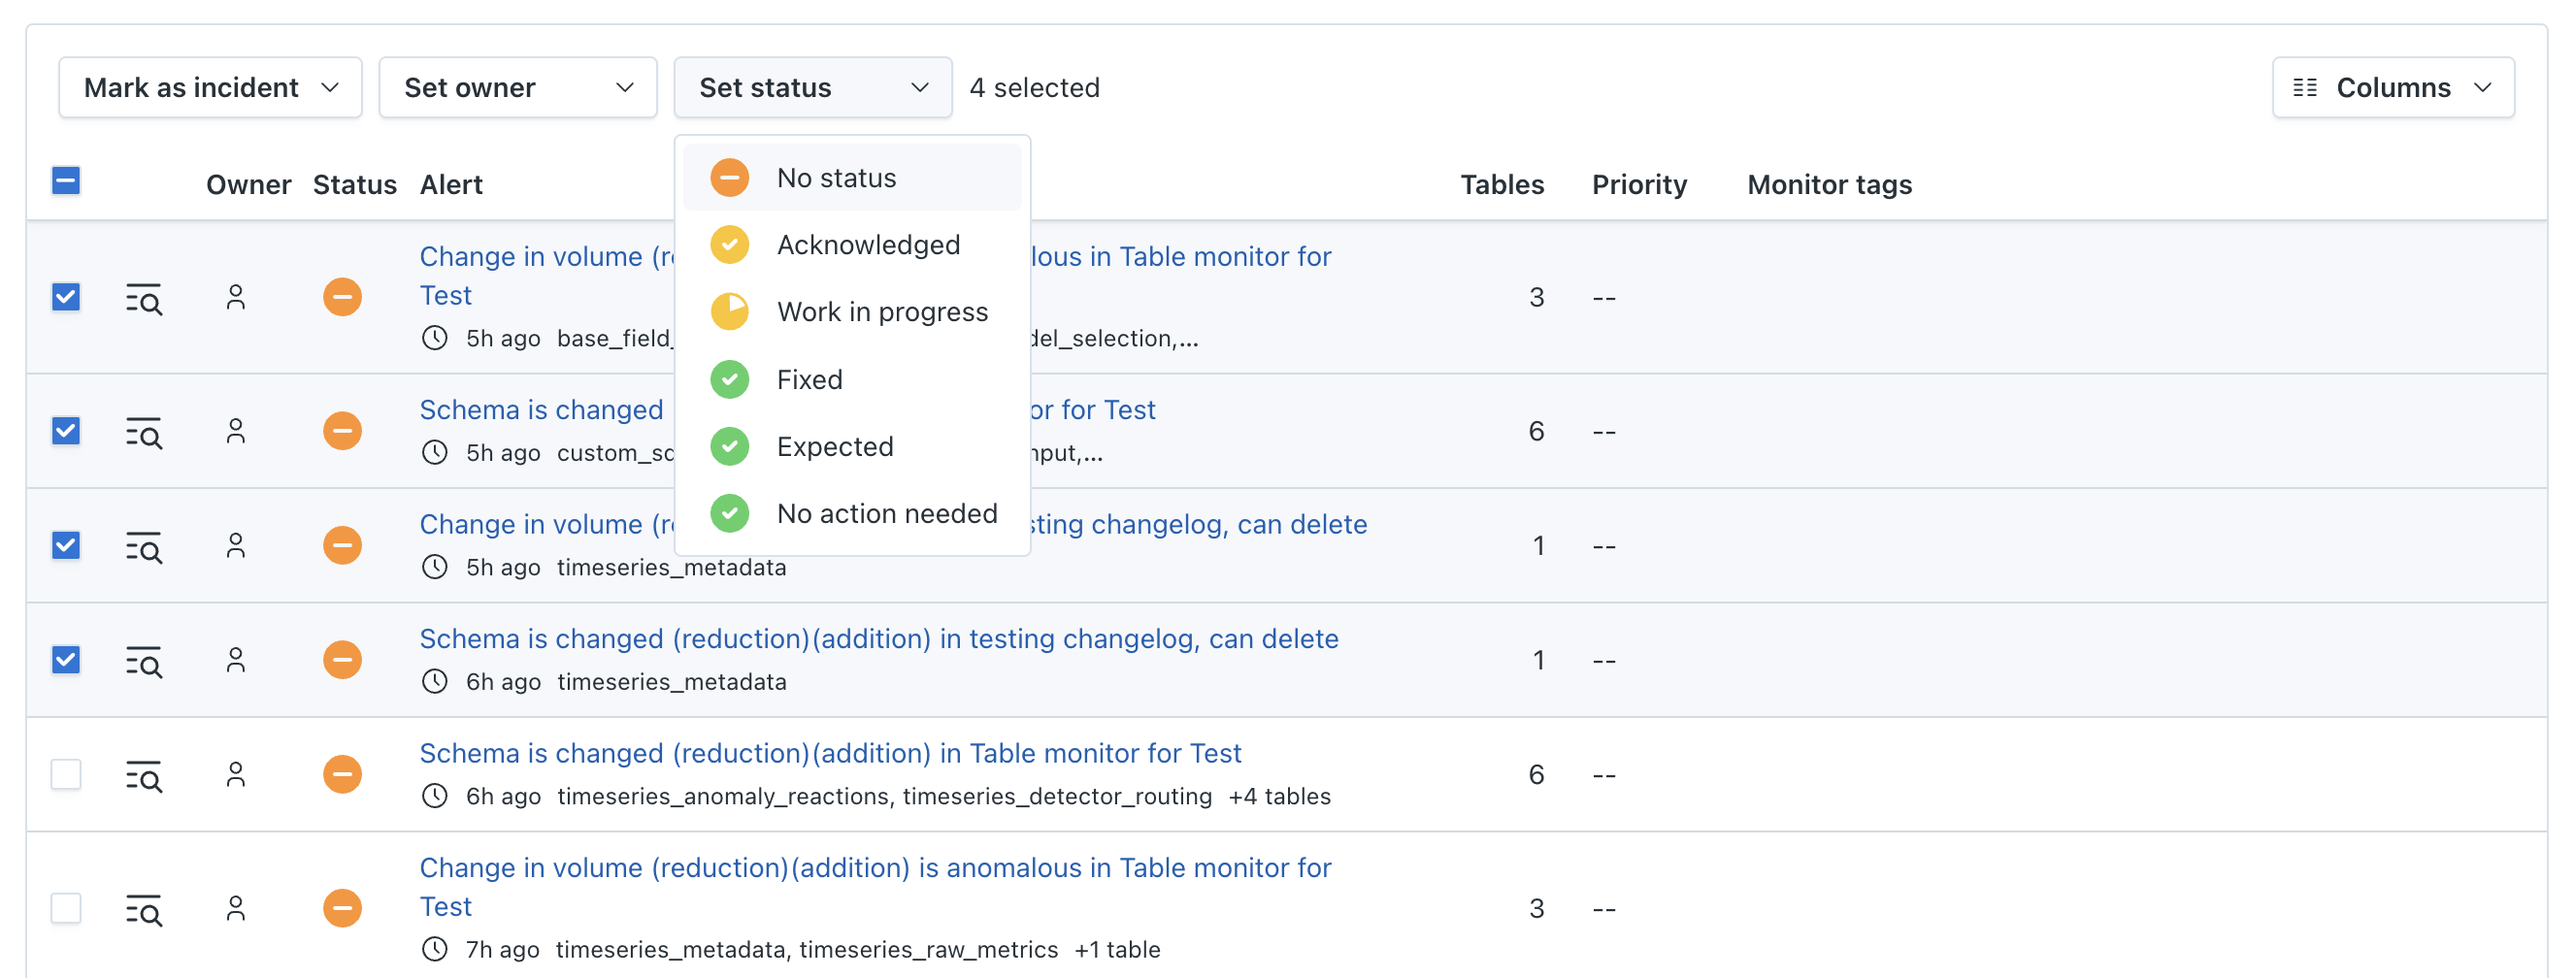
Alert feed with multiple alerts selected to apply bulk status update
Using Alert detail
The Alert detail page is accessible from the Alert feed by clicking the alert title.
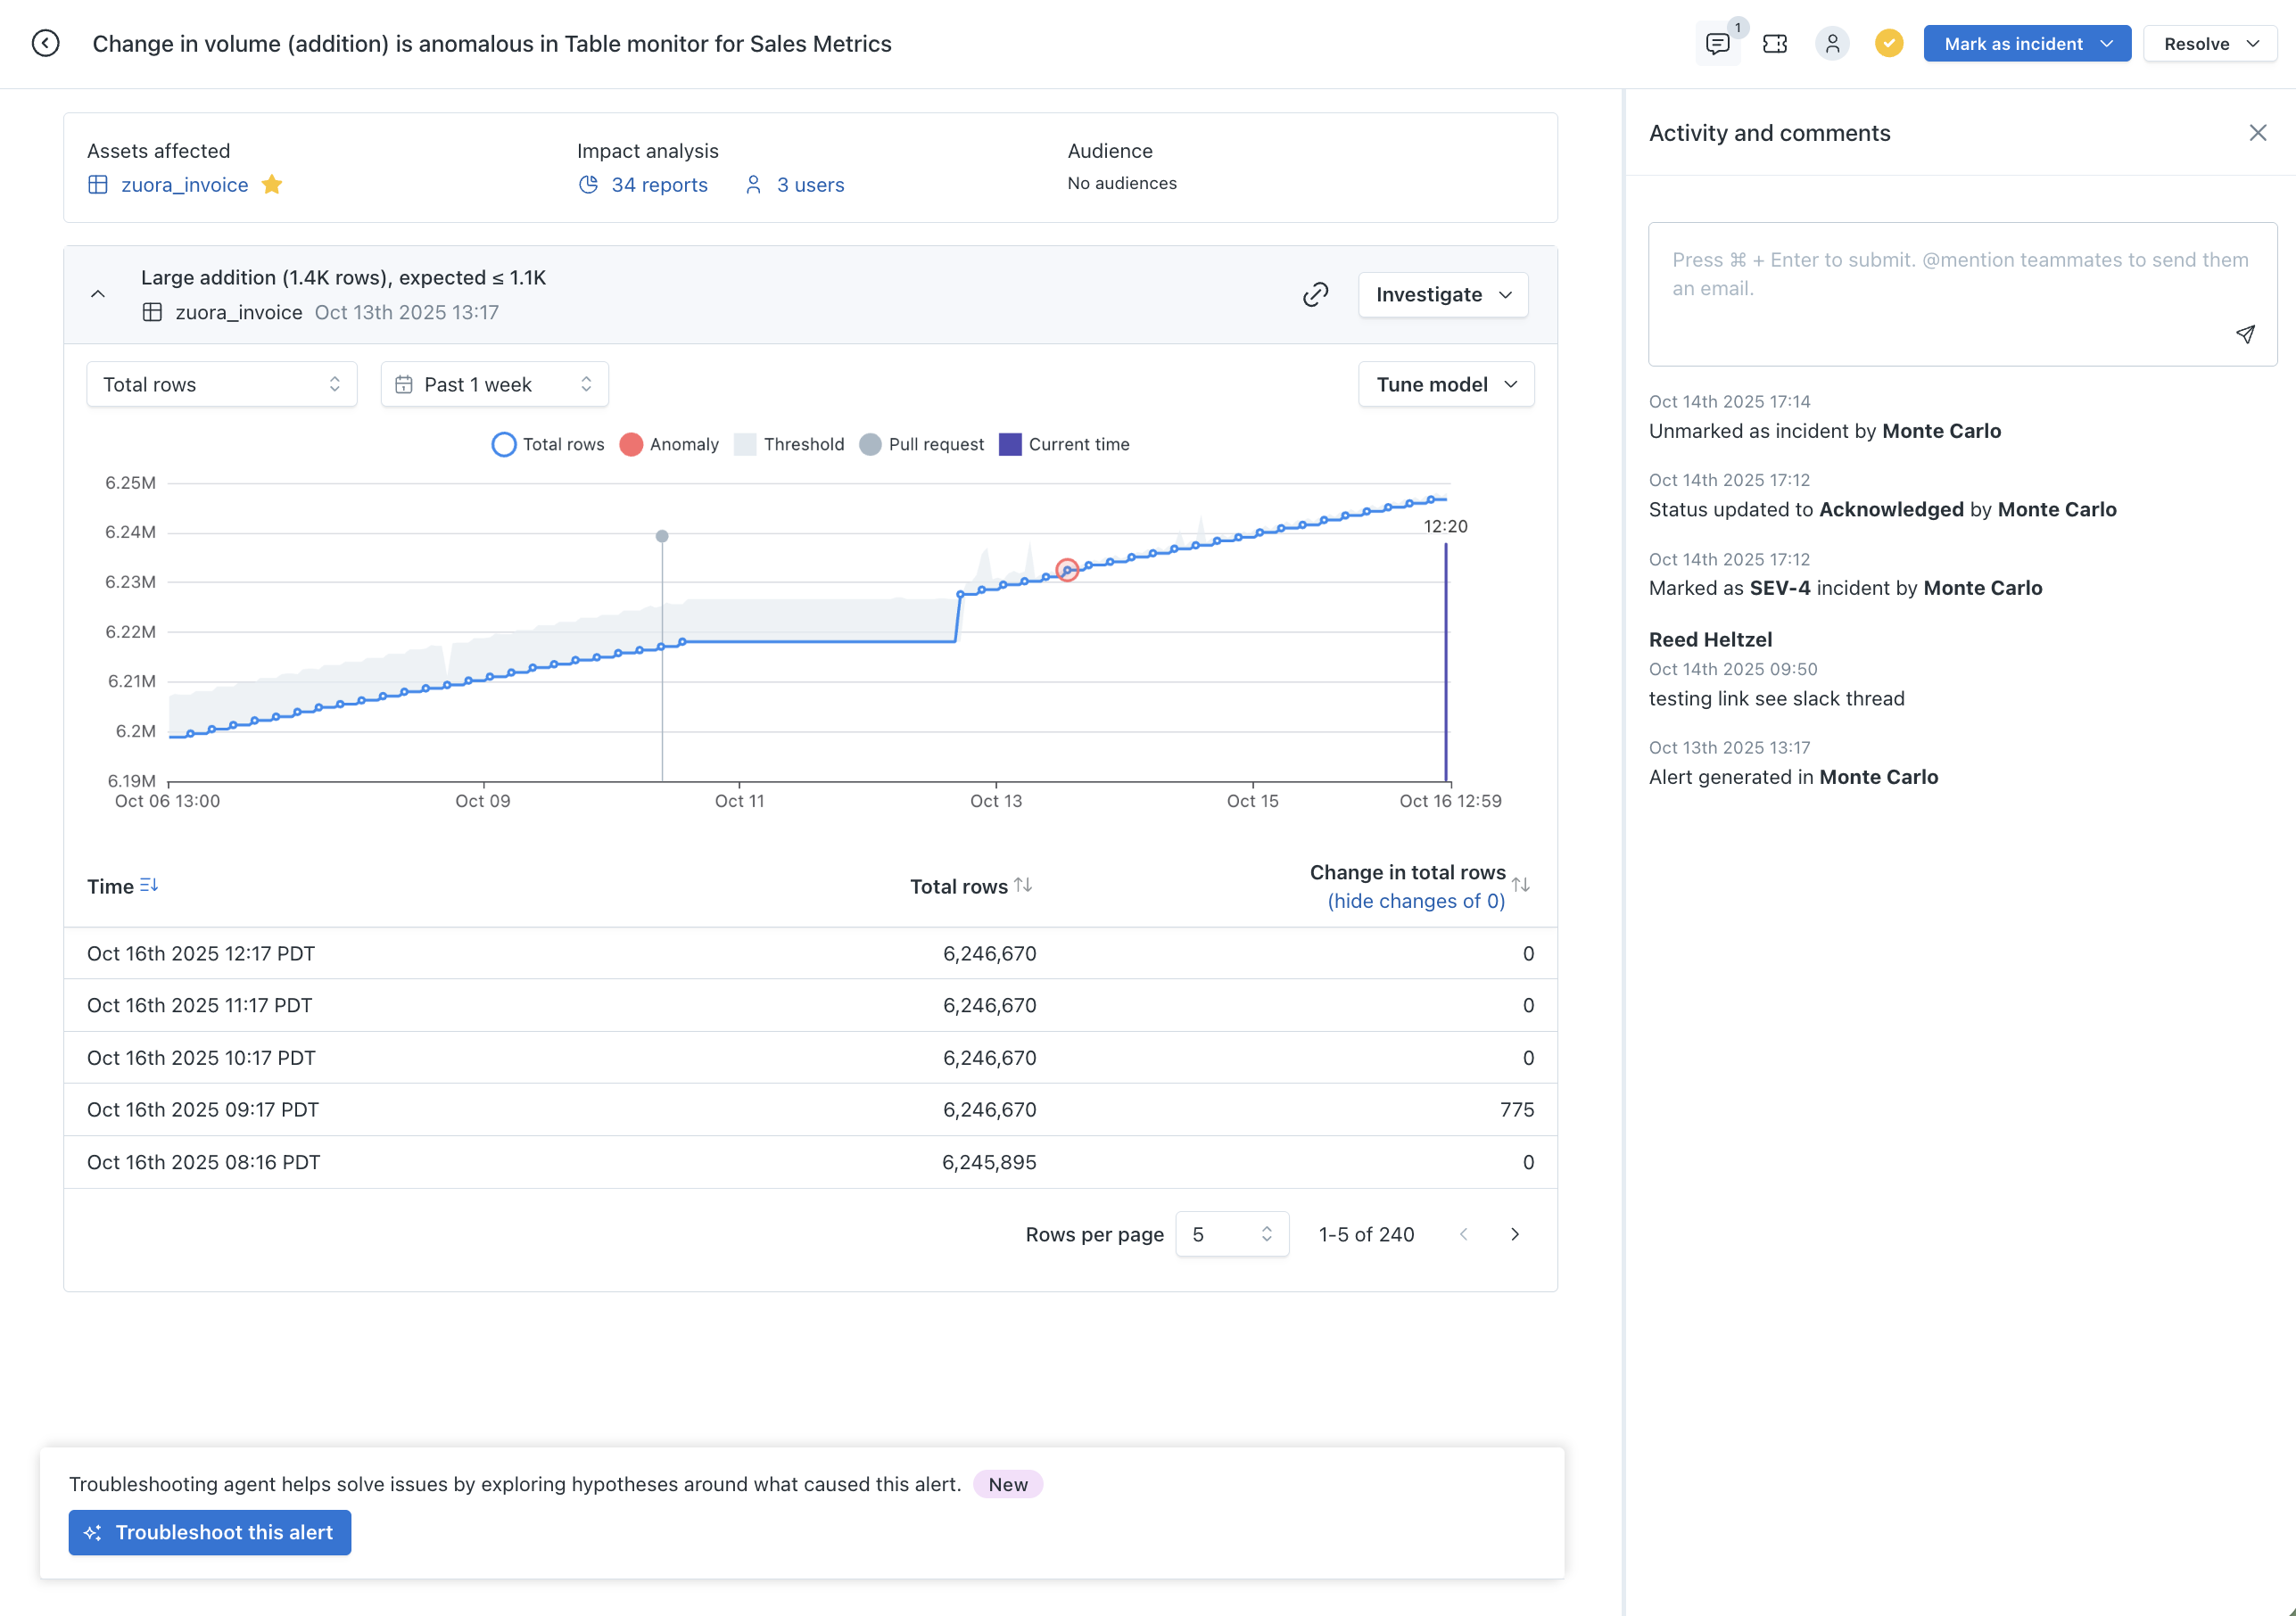
Alert detail page
Alerts are grouped together if they are potentially relevant, so you can see the full impact of an alert. These grouped alerts will show up as a card on this page, with each card containing the relevant information.
Alert Grouping
Table Monitors Alert Grouping
This grouping logic applies to the Table Monitor framework.
If your account has not yet been migrated to Table Monitors, refer to Legacy Alert Grouping.
Alerts from Table Monitors are grouped when:
- They are created by the same Table Monitor.
- They are in the same schema and occurred within a 5-hour window.
- Row count change, Time since last update, and Time since last row count change alerts are grouped together.
- Schema changes are only grouped with other schema change alerts.
Legacy Alert Grouping
Alerts from different tables are grouped:
- If they are in the same schema and occurred in a 5-hour window.
- If they are connected by lineage and occurred in a 5-hour window, even if they are across different schemas.
dbt Alert Grouping
Alerts from dbt are grouped:
- If you opted into grouping repetitive dbt model errors into the same alert.
- If you opted into grouping repetitive dbt test failures into the same alert.
- If you have not opted into repetitive dbt model/test failure grouping, those alerts will be grouped by dbt run.
Note that operational alerts are only grouped with operational alerts, and data alerts are only grouped with data alerts. Grouped operational alerts include freshness anomalies, volume not updating, dbt and airflow failures. Grouped data alerts include volume changes and field anomalies.
Summary
The Summary menu is the landing page of alert detail and contains a quick high-level view of the alert details.
Alert summary
Here, the following information is provided:
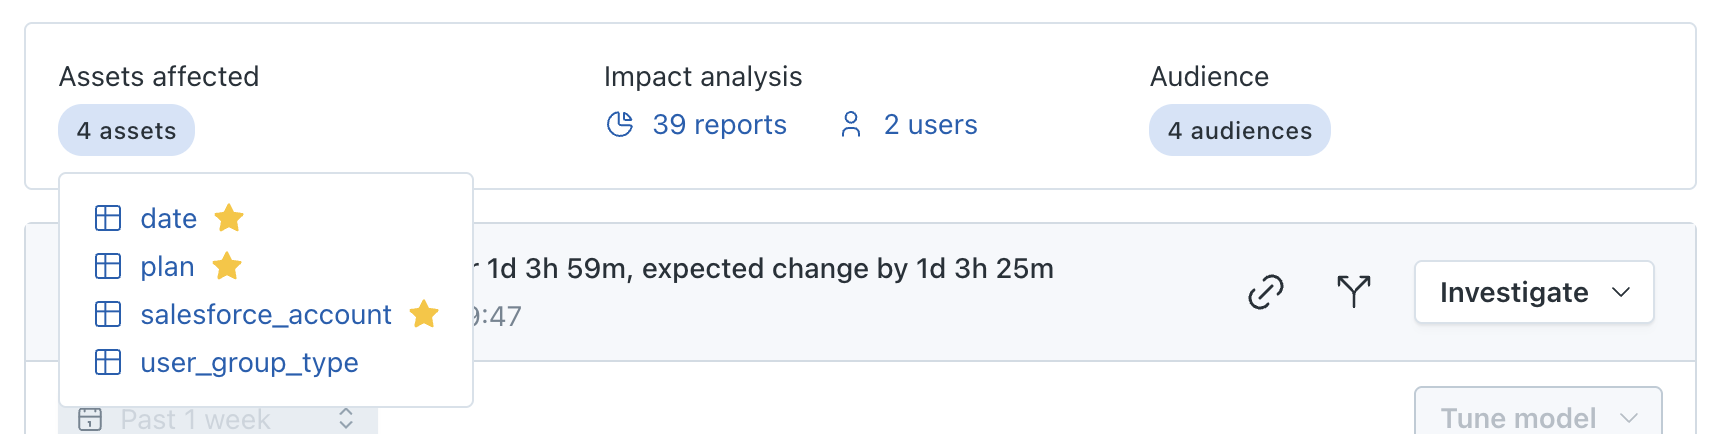
- Tables - a list of tables involved in the alert. Clicking on a table in this list will take you to the Asset page for that table.
- Impact analysis - list of potentially impacted downstream BI reports and their users.
- Audiences - a list of audiences which were alerted to this alert. Clicking on an audience will take you to that audience page.
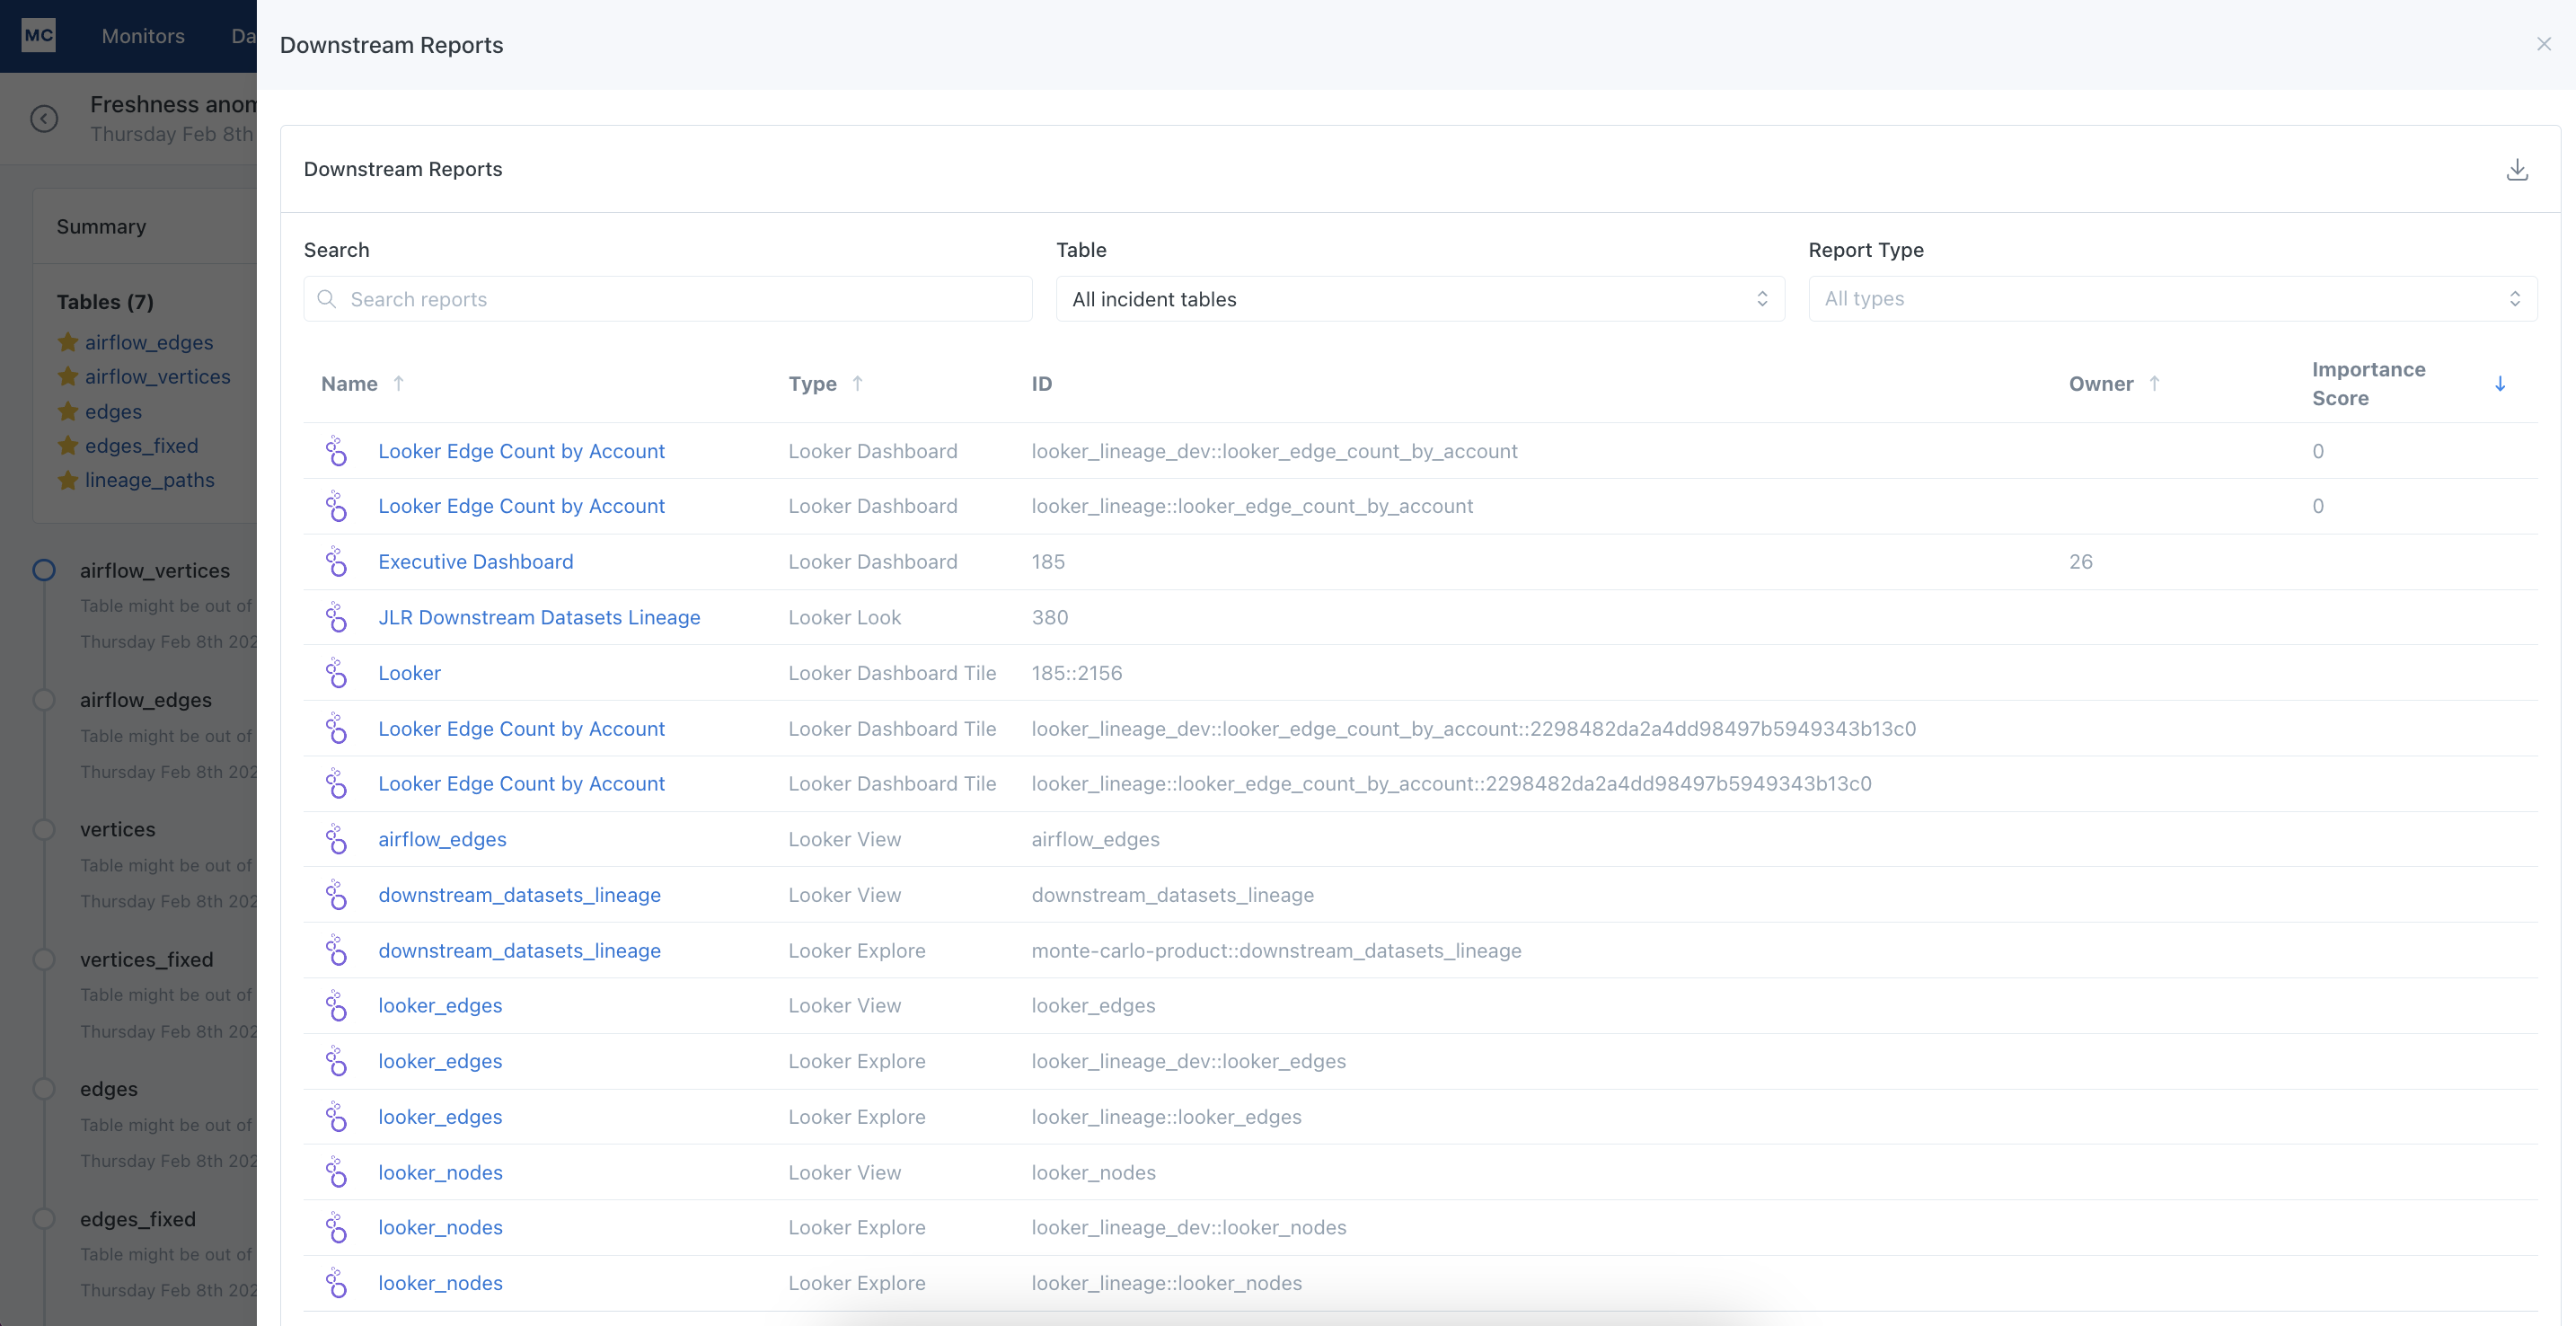
Potentially Impacted Reports
Alert Management
From an alert, there are several features available to aid in alert management.
Marking Alerts as Incidents
See more detail on Marking Alerts as Incidents.
Owner
Assign an owner to make clear who is responsible for investigating the alert, and a severity to classify the alert.
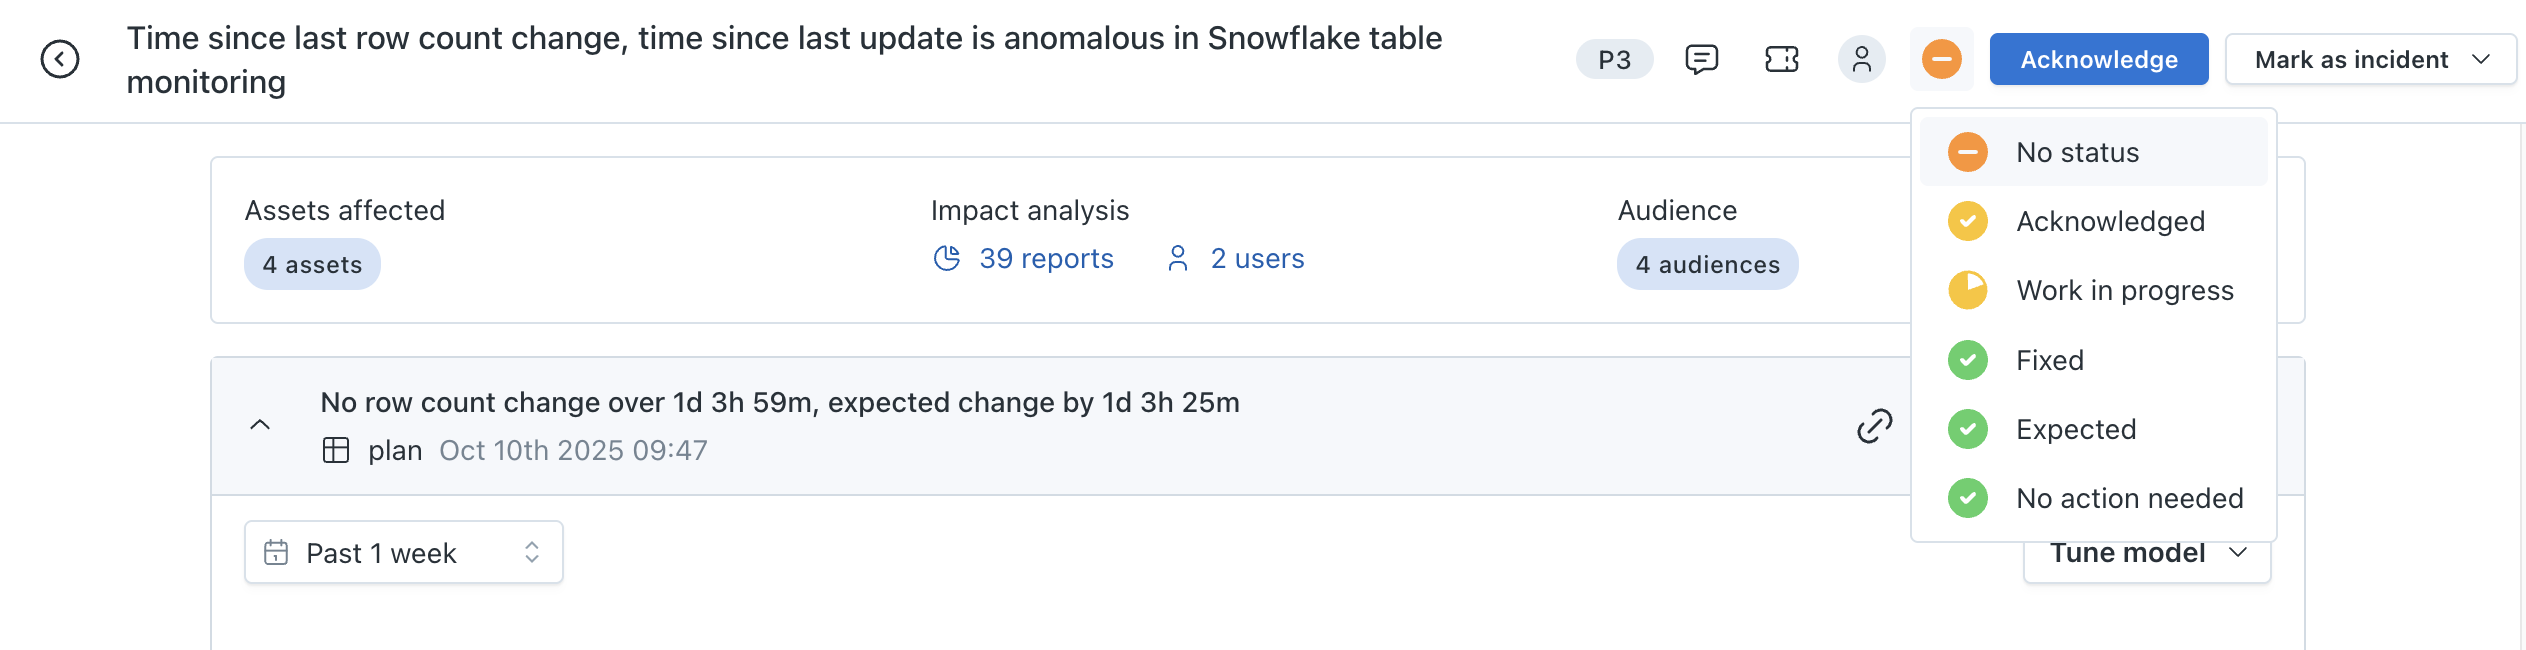
Status
Update the status of an alert to track progress of the alert. Updating status is also helpful for analytics and reporting and can aid in defining/meeting SLA's.
Alert status update
Comments & Activity Log
Add comments to the alert to track notes and findings. Any severity, status, or owner updates are logged here as well.
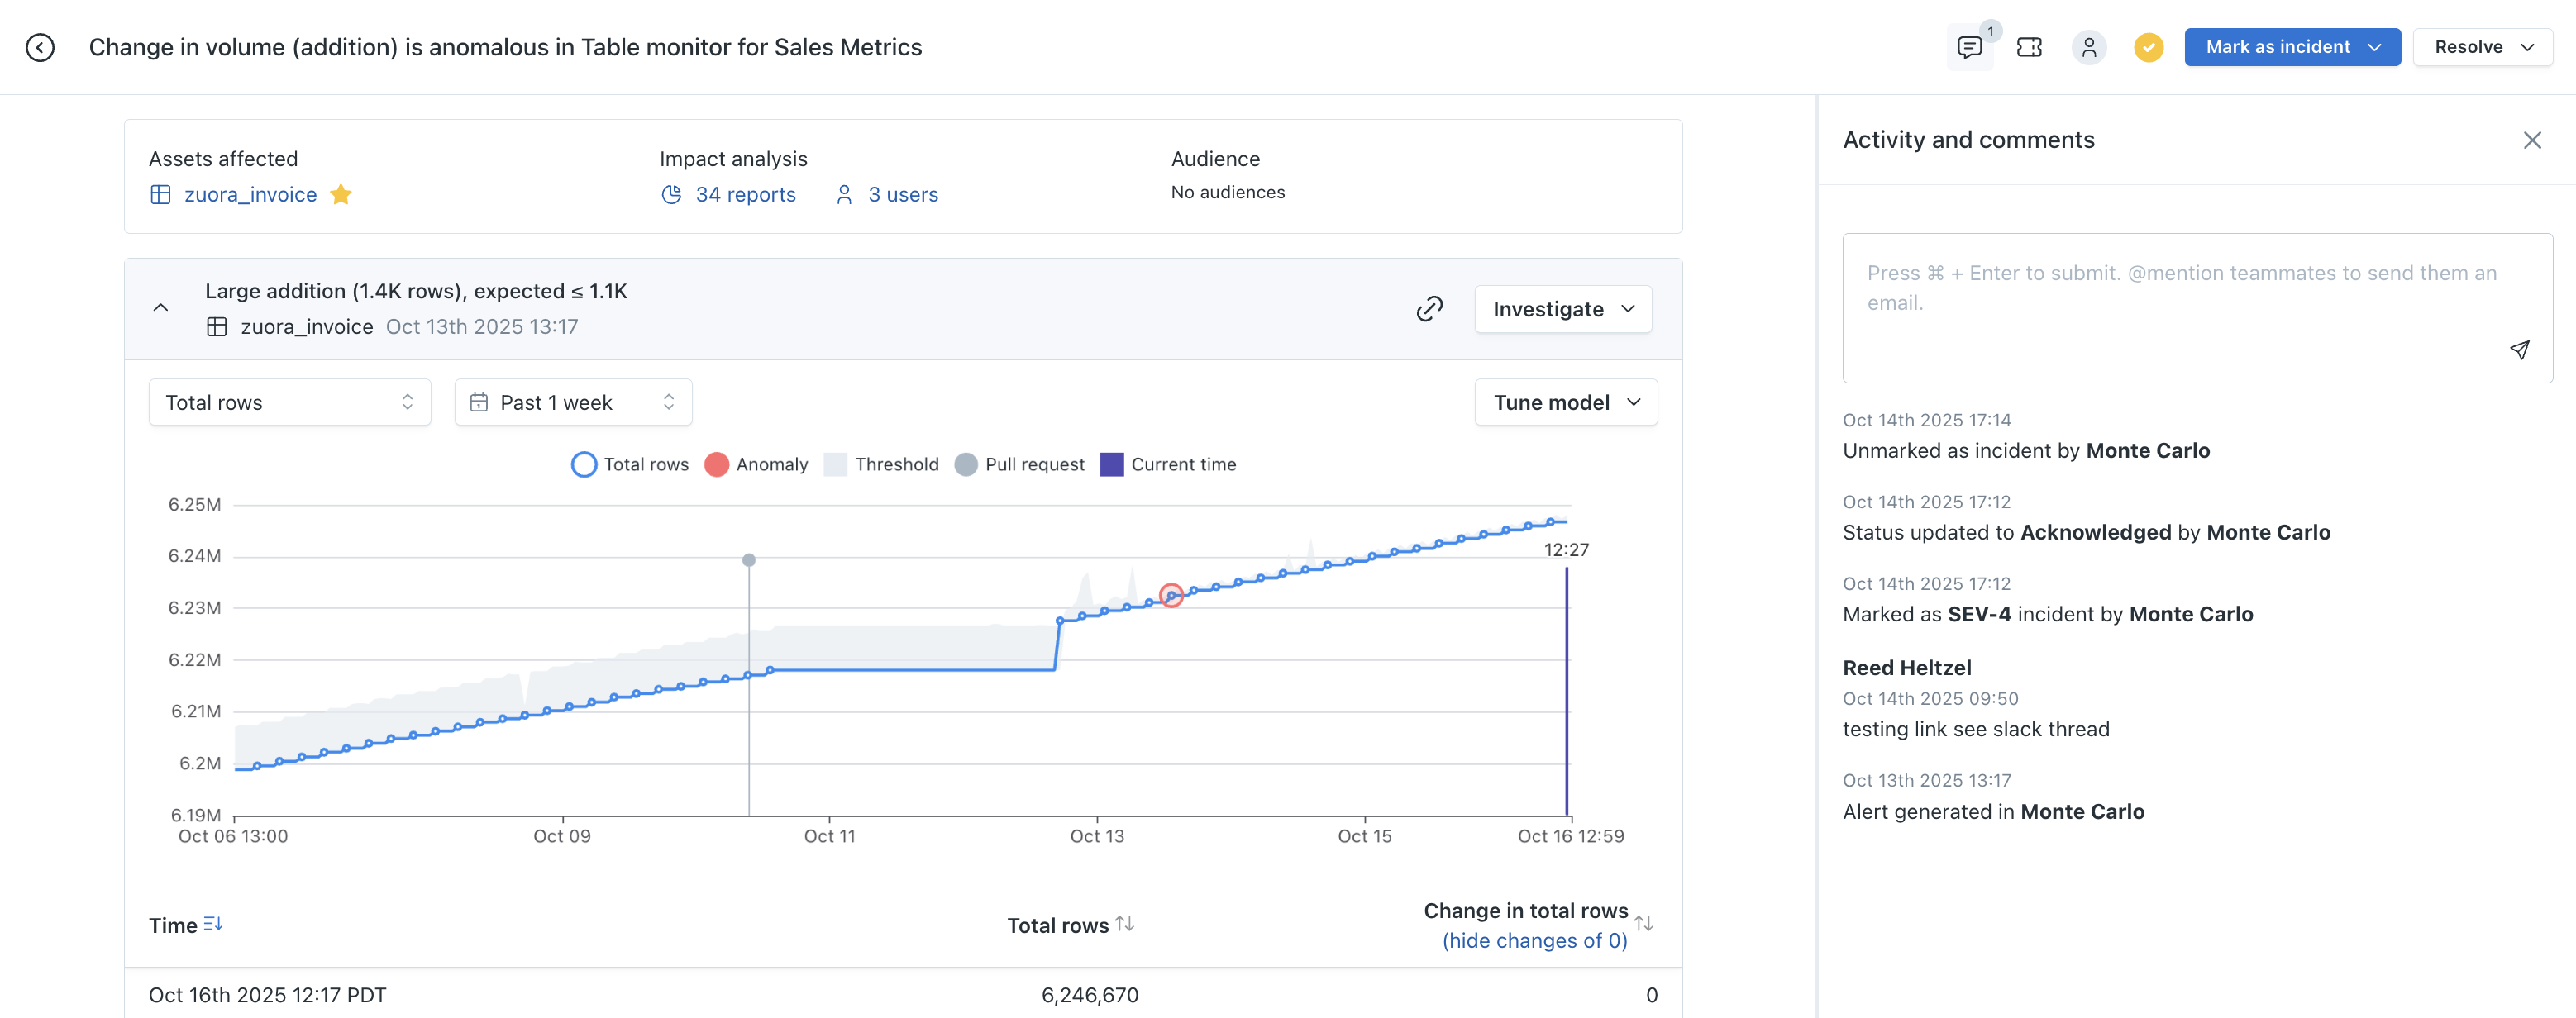
Activity and comments panel
Tuning alert thresholds
Learn more about how to tune thresholds produced by Monte Carlo's machine learning models.
Alert Chart
Under each event from the alert timeline is a graph that provides visual insight into why the alert was raised.
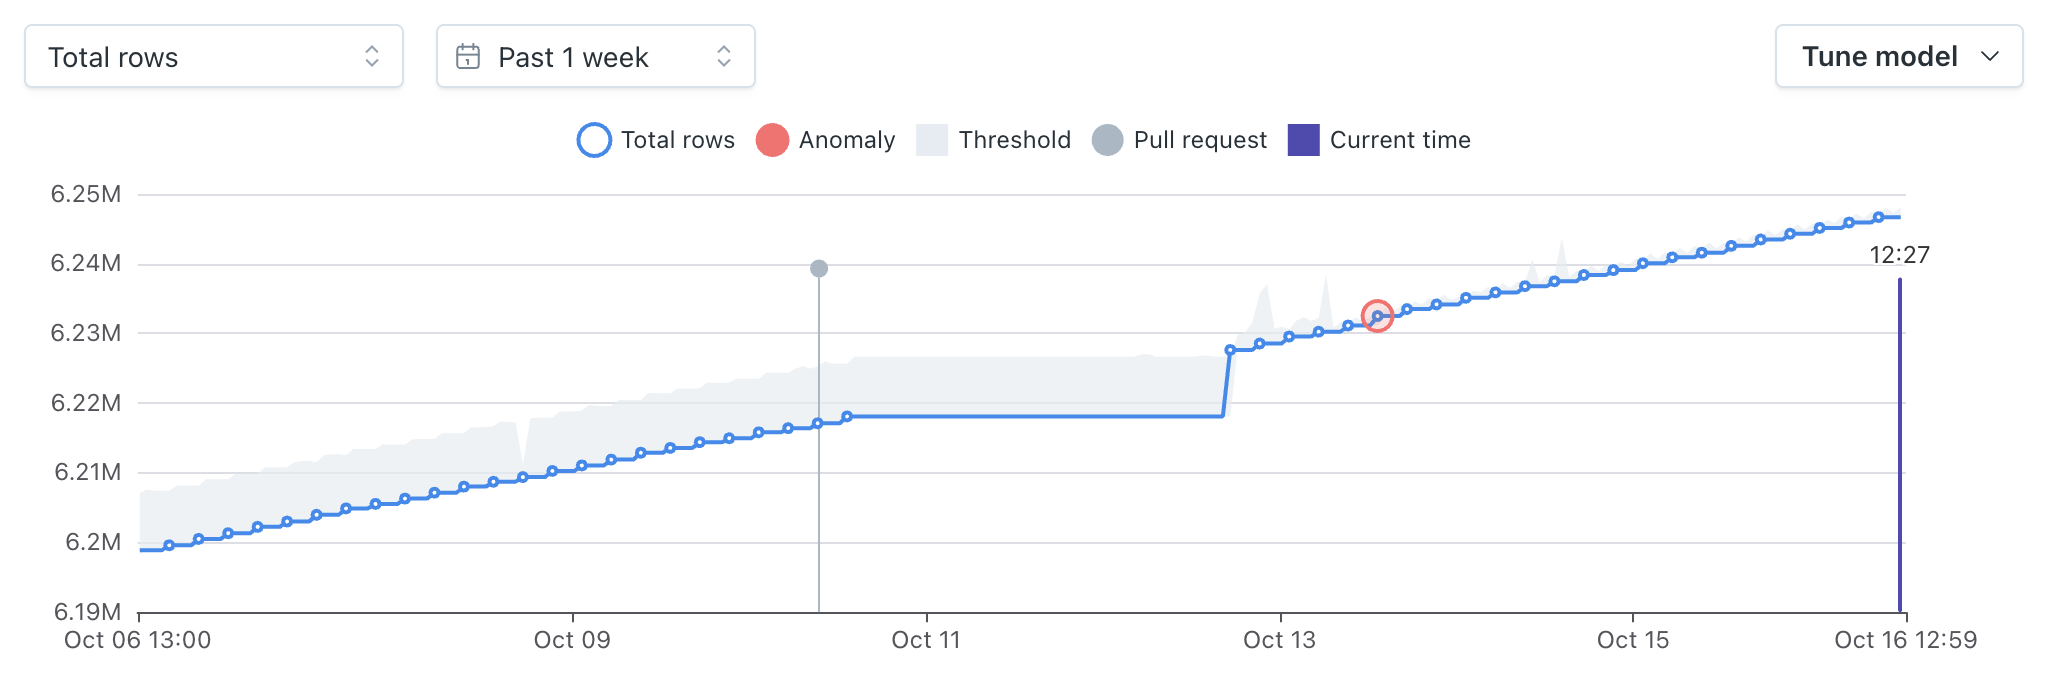
Chart of an anomaly where there was a large addition of rows to the table
In this example, the alert originated from an automated Table monitor which tracks patterns in Volume change -
- The blue line on the graph represents the change in Volume over the previous week.
- The section highlighted in red indicates a deviation from the normal pattern.
In this case, the deviation is a halt in Volume changes. In other words, the table has not changed in size as expected based on historical trends.
Frequently Asked Questions
We see flags on some of our alerts that reference correlation or query insights, what is this?
Correlation and query insights represent automated findings that Monte Carlo produced to facilitate the discovery of the root cause of a particular data alert. Click here to learn more about this great feature.
The dbt menu item was not mentioned here, what is that?
If you have a dbt integration set up, you can access information about the dbt model related to the affected table within the dbt menu. Click here to learn more about our dbt integration.
Updated 25 days ago