Metric Monitors
Metric Monitors detect anomalies for dozens of available metrics, or for custom metrics defined by the user. All metrics support machine learning thresholds and most support manual thresholds. Metric monitors will also backfill historical data in order to quickly generate a machine learning threshold. Backfill requires the "Group data" option to be used.
One monitor can track many different metrics across many different fields on a given table. Metric monitors can also be easily segmented, allowing the user to isolate anomalies that could otherwise be diluted and missed. A single metric monitor can track up to 10,000 combinations of metrics, fields, and segments (learn more), though this limit can be raised in select cases.
Creating Metric Monitors
Metric monitors can be created from the Create Monitor page or Assets page.
When creating a metric monitor, you can choose between monitoring a single table or multiple tables. The following configuration steps apply to metric monitors applied to a single table. To create a metric monitor across many tables, see Creating Multi-table Metric Monitors.
Configuration steps include:
Choose data
Select which table or view to monitor, and how to aggregate, filter, and segment the data. Instead of selecting a table, users can also define a source using SQL. Settings include:
Select table: picks which table or view to monitor. Alternatively, users can write custom SQL and monitor the output of the query.
WHERE condition: filters the entire selected table or the output from the custom SQL. For example, a specific segment of data you would like to monitor.
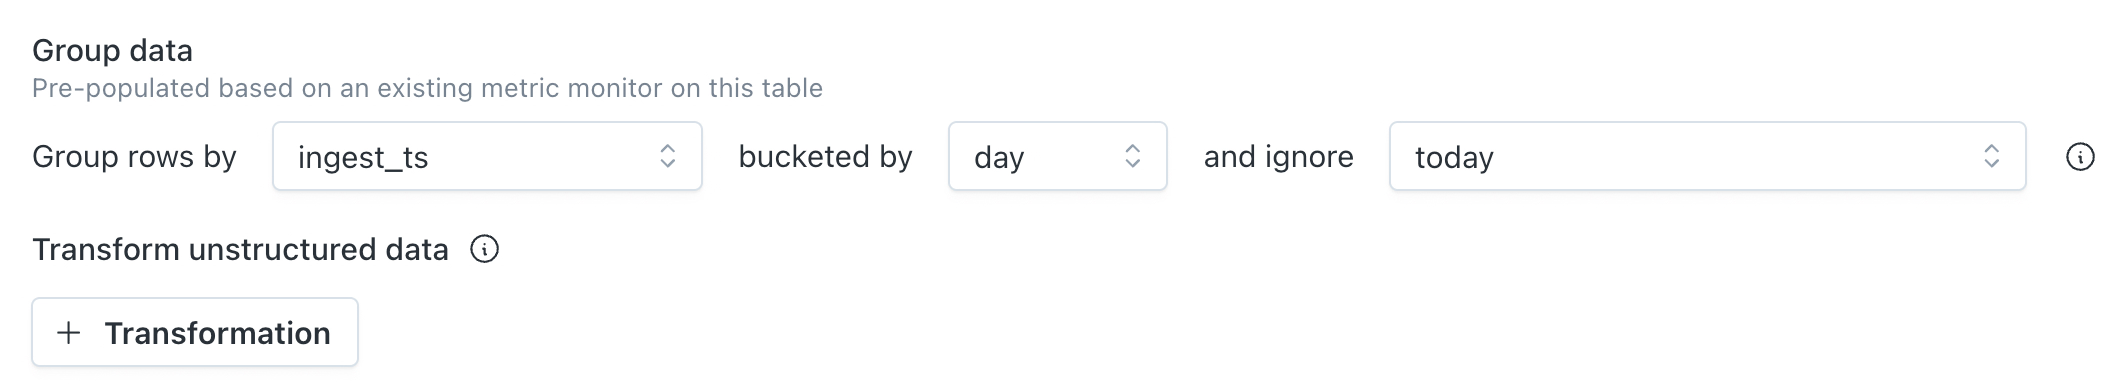
Group data: picks how to bucket the data and if any recent buckets should be ignored. Specifically:
- Which time field (if any) should be used to group the data into a time series. Custom SQL can also be used to compose a time field.
- If the rows should be bucketed by hour, day, week, or month.
- If any of the recent buckets of data should be ignored. Filtering out recent buckets ensures that the monitor does not query incomplete or immature buckets of data. If you have confidence that the data for the current bucket is already mature, you can choose to just filter out future buckets.
- For a timezone-naive time field (one that stores local time without explicit timezone information), use the time zone picker to tell Monte Carlo which zone the data is in. Monte Carlo then aligns the buckets to that zone, so the monitoring window lands on the actual data instead of being silently treated as UTC. The picker supports both fixed offsets and regional zones, and defaults to UTC when left unset.
- Timestamps that already include a time zone are interpreted accordingly. Monitor results are displayed in the user’s local time zone in the UI.
Transform unstructured data: available for Snowflake, Databricks and BigQuery using native AI functions in each platform. You can choose to apply a transformation to eligible text fields—such as extracting sentiment, classifying by category, or asking a custom prompt—and give the output field a name (e.g., review_sentiment or ticket_urgency). Once transformed, the result can be used like any other column. Read more about monitoring unstructured data.
Segment data: select up to 5 fields to segment the data by, or compose one with a SQL expression. Common fields to segment by include products, regions, event types, versions, and merchants. Read more about segmentation.
- Minimum segment size (optional): Set a floor below which segments are excluded from threshold generation and alerting. Configure as an absolute row count or a percentage of total rows. Segments below the minimum are still collected and visible in the monitor, but will not produce anomaly alerts.
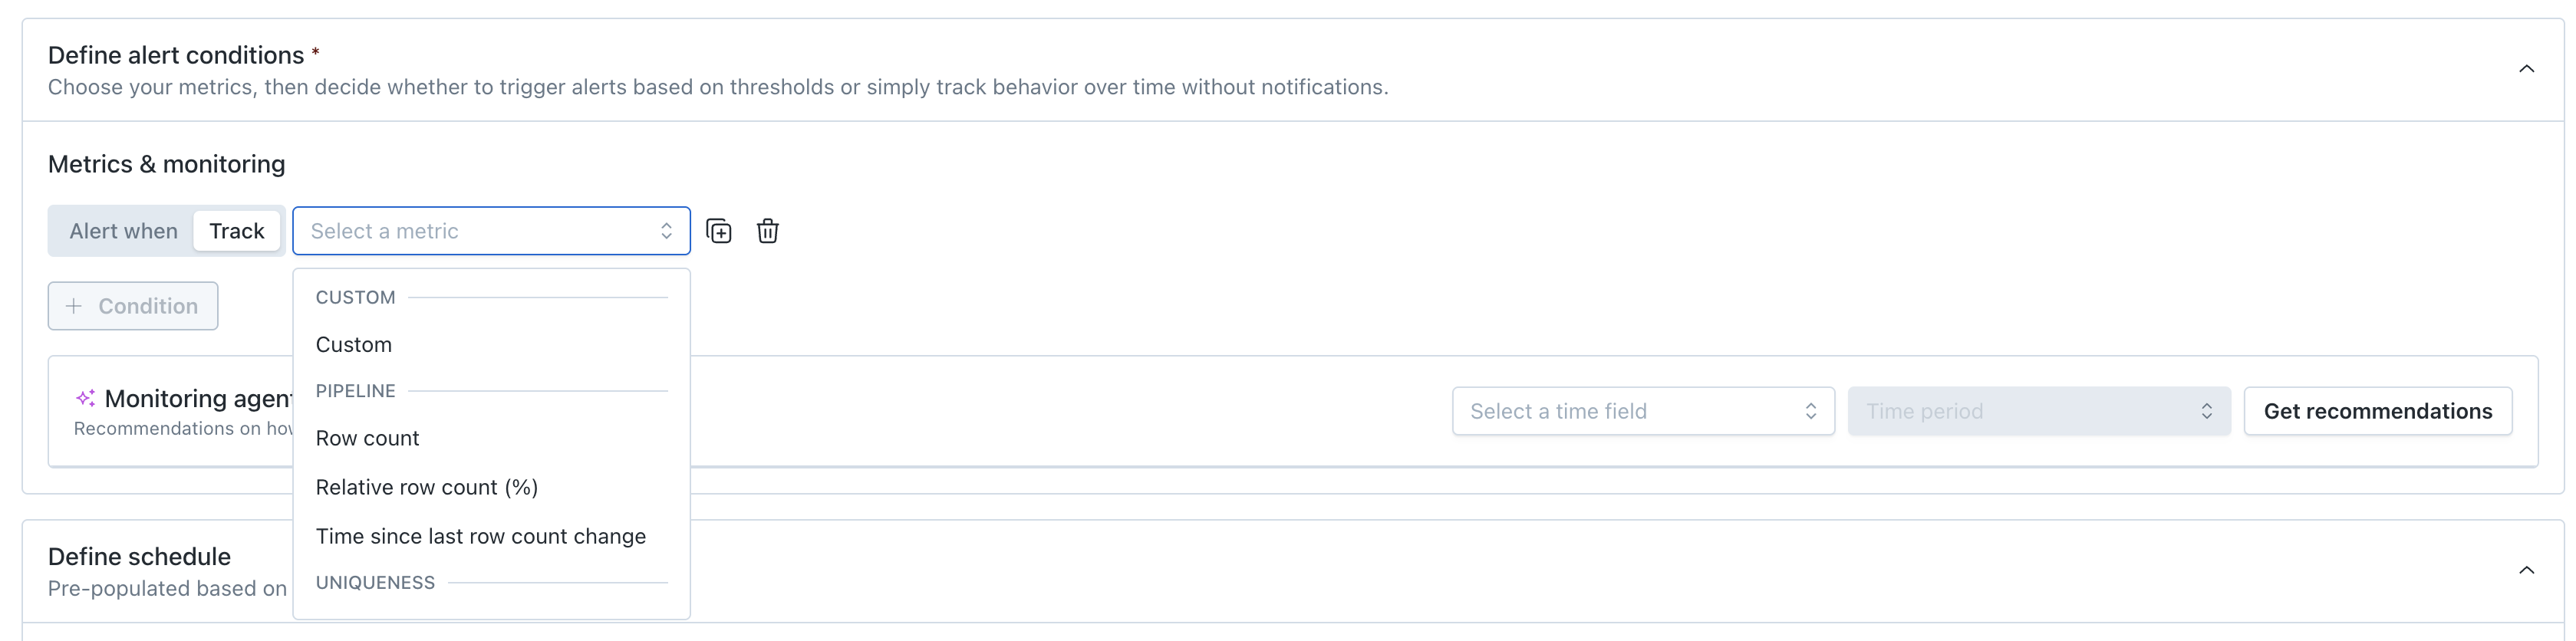
Define alert conditions
Users define alert conditions by adding their own conditions or by getting recommended conditions from the Monitoring agent.
To add your own condition, select the metrics and fields to monitor, and the threshold to generate an incident. See the full list of available metrics or create your own custom metric.
Once you select a metric, you can then select specific fields or All supported fields. If All supported fields is selected, then only automated thresholds are available.
The operators for alert conditions are self-explanatory, with the exceptions of:
- Not between: this is exclusive of the bounds. For example, "Alert when mean for sale_price is not between 500 and 1,000" could be rephrased as "Alert when mean for sale_price is <500 or >1,000."
- Between: this is inclusive of the bounds. For example, "Alert when mean for sale_price is between 500 and 1,000" could be rephrased as "Alert when mean for sale_price is >=500 and <=1,000."
Track only: When defining alert conditions, you can choose just "Track" so you run the monitor and collect the metric over time without setting thresholds or audience. Track mode lets you observe a metric's behavior and build confidence in its patterns before committing to alert conditions. When you're ready, you can edit the monitor and promote it to an alerting configuration.
Monitoring agent recommendations
The Monitoring agent recommends alert conditions by sampling data of up to 10k rows based on the user-selected time field and time range. Learn more about Monitoring agent recommendations.
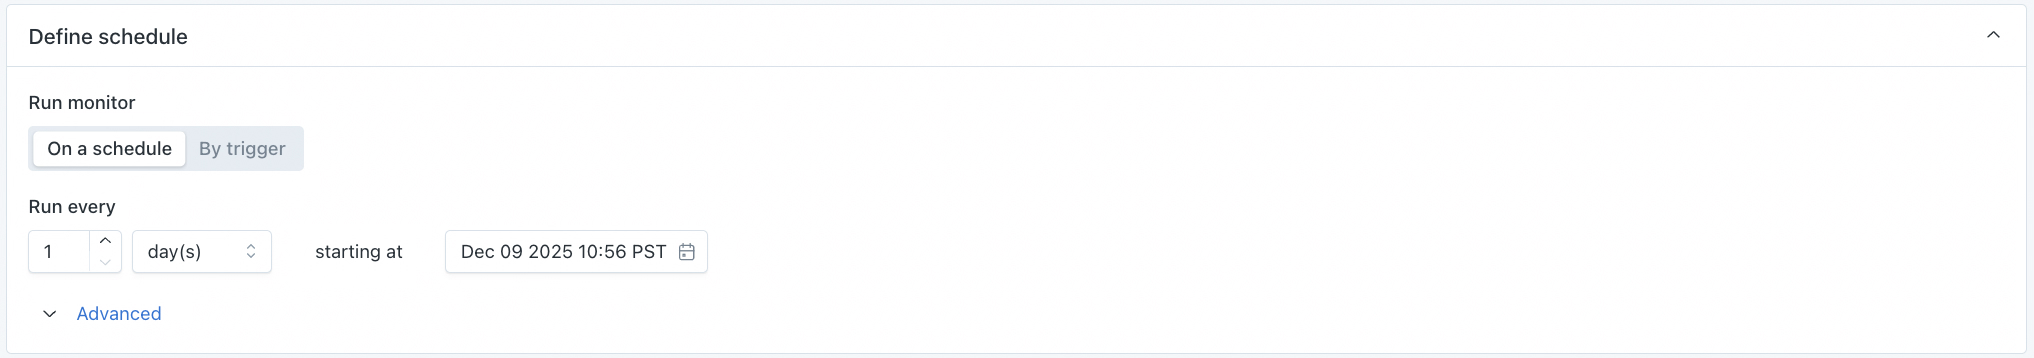
Define schedule
Select when the monitor should run. Metric monitors run according to the schedule or trigger defined below and cannot be snoozed once enabled. There are several options:
- On a schedule: input a regular, periodic schedule. Options for handling daylight savings are available in the advanced dropdown.
- By trigger:
- Manual trigger: the monitor is run manually from the monitor details page using the
Runbutton, or programmatically via the runMonitor API call. A metric monitor that is run manually will only ingest the result of the first run within the monitors defined bucket. - When a table is updated: the monitor will run when Monte Carlo sees that the table has been updated. This logic uses the history of table updates that Monte Carlo gets through its hourly collection of metadata. The run will occur up to 30 minutes after an update, but not more than once every 2 hours (12 hours for high-segment monitors), or once per day for daily-bucketed monitors. Use the Run periodically if trigger doesn't fire toggle to control whether the monitor also runs on a fallback schedule (every 48 hours by default, or the bucket interval for weekly/monthly monitors) when no table update is detected.
- When a job or task completes: the monitor will run when Monte Carlo detects a successful job or task execution, but not more frequently than every 2 hours (or every 12 hours for high-segment monitors). Use the Run periodically if trigger doesn't fire toggle to control whether the monitor also runs on a fallback schedule (every 48 hours by default) when no job or task executions are detected.
- Manual trigger: the monitor is run manually from the monitor details page using the
When is the manualRunbutton available for metric monitors?The
Runbutton on the monitor details page is shown for a metric monitor only when it uses a Manual trigger schedule, or a fixed schedule with no automatic (machine learning) thresholds. Metric monitors on a regular schedule that use automatic thresholds do not expose a manualRunbutton — a manual run only ingests the result of the first run within the monitor's defined bucket, which does not fit the bucketed, ML-based time series. To trigger these monitors ad hoc, use the runMonitor API. This differs from rule-based monitors (such as Validation and SQL rule monitors), which always expose theRunbutton.
Creating Multi-table Metric Monitors
Multi-table metric monitors apply the same metric logic across many tables at once, making it easy to enforce consistent data quality standards at scale. They're dynamic—automatically including new tables that match your criteria as they're created.
Choose data
Start by selecting Multi-table , and selecting a warehouse
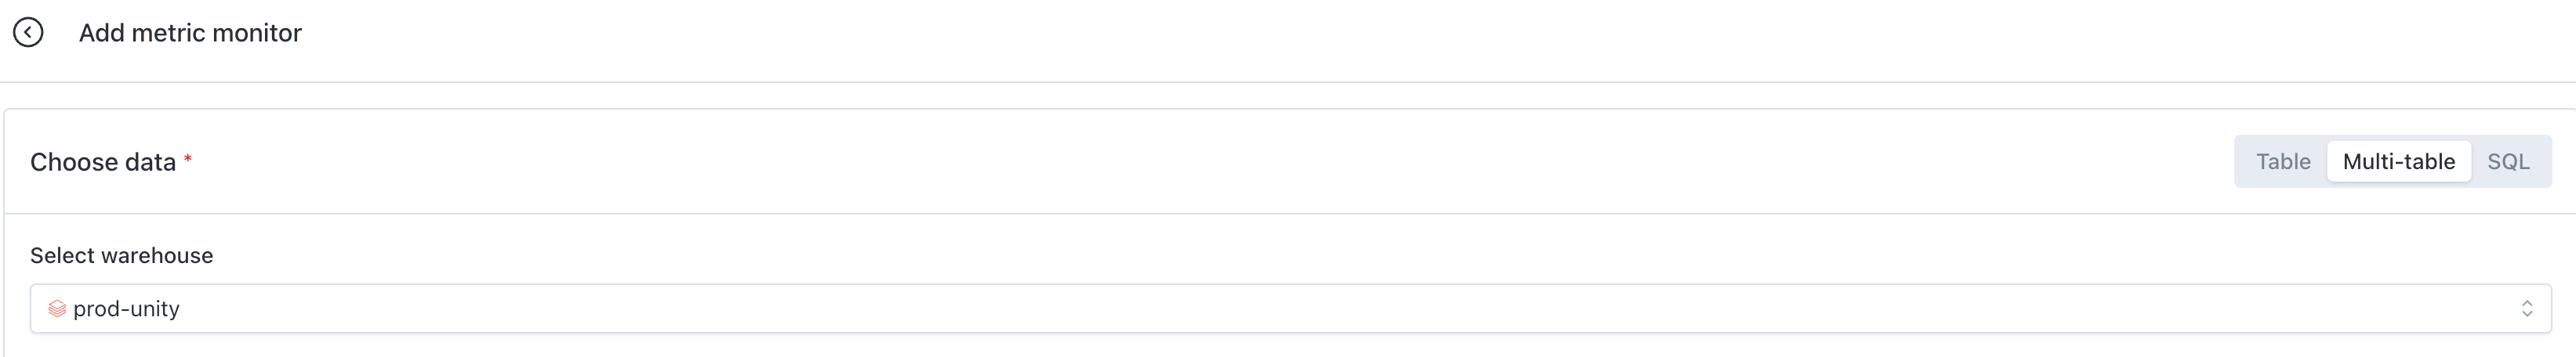
Multi-table monitors may contain up to 1,000 tables.
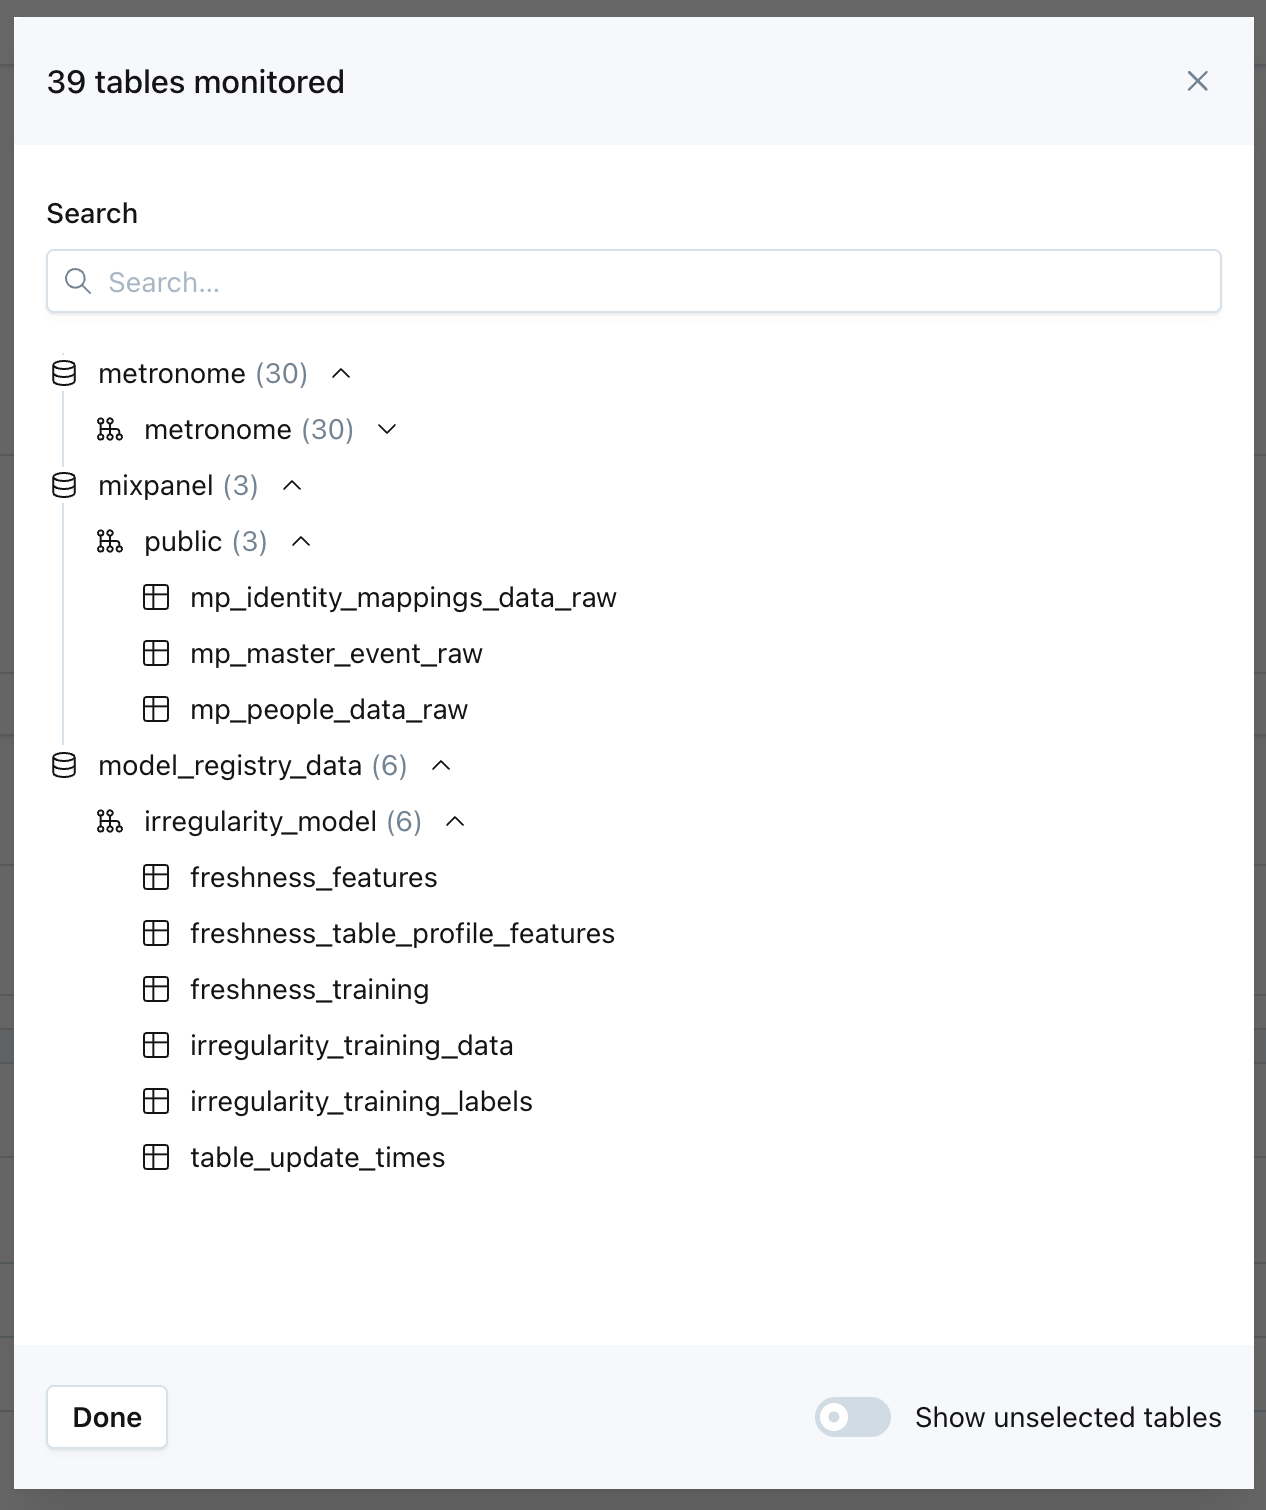
Choose tables: Select which assets to include—the entire warehouse, specific databases or schemas, individual tables, or use the following filters for inclusion or exclusion:
- Table name. Operators include: starts with, ends with, contains, matches pattern.
- Table tags. Operators include: is one of, has all.
- Useful to filter for specific Data Products or Domains. Assets are automatically tagged with the Data Products and Domains they are a part of.
- Table type. For example, if you would like to exclude Views.
- Read activity. For example, if you would like to filter just for assets with read queries in the past 14 days.
- Write activity. For example, if you would like to filter just for assets with write queries in the past 14 days.
- Read or write activity. For example, if you would like to filter just for assets with read or write queries in the past 14 days
- Row count change. For example, if you would like to filter just for assets with changes in row count in the past 31 days.
A preview of the assets that match your criteria is available at the bottom of this section. The list refreshes with each monitor run, automatically including new tables that match your criteria. If the 1,000 table limit is reached, a notification will be sent to the attached audience(s).
Group data (optional): Pick how to bucket the data and if any recent buckets should be ignored:
- Which time field (if any) should be used to group the data into a time series (time field must exist identically across all assets in scope to group data)
- If the rows should be bucketed by hour, day, week, or month.
- If any of the recent buckets of data should be ignored. Filtering out recent buckets ensures that the monitor does not query incomplete or immature buckets of data. If you have confidence that the data for the current bucket is already mature, you can choose to just filter out future buckets.
- For a timezone-naive time field (one that stores local time without explicit timezone information), use the time zone picker to tell Monte Carlo which zone the data is in, so buckets align to the actual data instead of defaulting to UTC. The picker supports fixed offsets and regional zones, and defaults to UTC when left unset.
- Timestamps that already include a time zone are interpreted accordingly. Monitor results are displayed in the user’s local time zone in the UI.
Define alert conditions
Users define alert conditions by adding their own conditions. To add your own condition, select the metrics and fields to monitor via pattern matching, and the threshold to generate an alert.
- Select a metric: Multi-table monitors support all field-level metrics. See the full list of available metrics—note that Pipeline metrics are not currently available for multi-table metric monitors.
- Select field(s): Select the field data type and use pattern matching to select which fields across your tables should be monitored. This accommodates naming and type variations across tables. For example, monitor all
stringfields ending in_idfornull %.- Pattern matching options:
- Fields
ending with - Fields
starting with - Fields
containing - Fields
matching(accepts exact naming or wildcards)
- Fields
- Pattern matching options:
- Set a threshold: Choose automated (machine learning) thresholds or set manual thresholds using operators.
Define schedule
Select when the multi-table metric monitor should run. There are two options:
- On a schedule: Input a regular, periodic schedule. Options for handling daylight savings are available in the advanced dropdown. Multi-table monitors on a schedule run across all tables using staggered execution to balance warehouse performance.
- By trigger [When a table updates]: The monitor runs only on a table when that table has an update, within 30 minutes of the update, but not more often than every 2 hours per table. Tables without updates run at least once every 48 hours.
By trigger [When a table updates]: The monitor runs only on the specific table that updated, not all tables in the monitor. Runs occur within 30 minutes of an update, but not more often than every 2 hours per table. Tables without updates run at least once every 48 hours.
Send notifications
Select which audiences should receive notifications when an anomaly is detected.
Text in the Notes section will be included directly in Alert notifications. The "Show notes tips" dropdown includes details on how to @mention an individual or team if you are sending notifications to Slack.
Notes support rich-text formatting, including bold, italic, underline, strike-through, lists, links, and code blocks. Rich-text channels display these styles, while text-only channels show a plain-text equivalent.
Monitor properties can be dynamically inserted into Notes through variables. Supported variables include Created by, Last updated at, Last updated by, Priority, and Tags.
Additional settings exist for customizing the description of the monitor, pre-setting a priority on any incidents generated by the monitor, or for turning off failure notifications.
Learn more about setting Monitor tags.
Monitoring unstructured data with LLM-powered transformations
Monte Carlo supports monitoring unstructured text columns directly within metric monitors, powered by LLM-based transformations. This allows you to apply sentiment analysis, text classification, or custom prompt-based structuring to freeform text data—without needing to pre-transform your data or write SQL.
Unstructured data monitoring is available for Snowflake, Databricks and BigQuery using native AI functions in each platform. After selecting your table and data source, Monte Carlo will surface all eligible text fields. You can choose to apply a transformation—such as extracting sentiment, classifying by category, or running a custom prompt evaluation—and give the output field a name (e.g., review_sentiment or ticket_urgency).
Once transformed, the result can be used like any other metric dimension or condition. For example:
- Alert when the number of negative product reviews increases day-over-day
- Classify support messages as “urgent” vs. “not urgent” and monitor volume
- Extract estimated NPS from feedback responses and track it over time
Transformations overview
You can apply up to two transformations per monitor, each on a separate column. Monte Carlo supports the following transformation types:
- Sentiment: Returns positive/neutral/negative (Databricks) or a sentiment score (Snowflake)
- Classification: Classifies text into user-defined categories
- Prompt: Applies a custom prompt transformation to extract structured data or evaluate AI-generated fields against source data.
Transformed fields can be segmented, grouped, or used in alert conditions just like other columns.
Getting started with Transformations
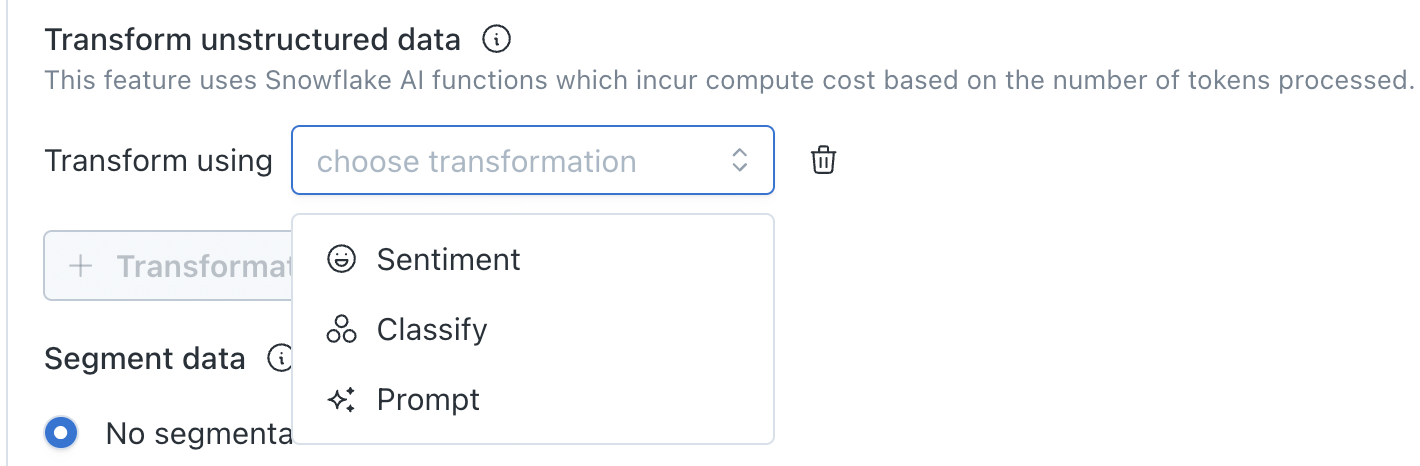
Transformations are configured within a metric monitor and require grouping. When grouping is set, the Transform unstructured data option will appear:
Click + Transformation and select a transformation type: Sentiment, Classify, or Prompt
Configuring a Sentiment transformation
Sentiment transformations automatically score the tone of any text field, returning positive, neutral, or negative (Databricks) or a numeric sentiment score (Snowflake). To create a Sentiment transformation:
Select Sentiment as your transformation type, then choose the field you want to track sentiment on.
Configuring a Classification transformation
Classification transformations categorize text fields into user-defined categories, giving you a structured way to monitor and alert on the distribution of your data. To create a Classification transformation:
Select Classify as your transformation type, then choose the field to classify. You'll be prompted to define your categories by configuring:
- Display name — the name of the output field
- Categories — define each category with:
- Label — the name of the category
- Description — optional, 1–2 sentences (Should be no longer than 25 words)
- Examples — provide at least 5 per category for best results (max 20)
Configuring a Prompt transformation
Prompt transformations allow you to define exactly how your data is assessed—whether you're extracting structured signals from raw text, scoring AI-generated outputs, or validating fields against source data. To configure:
- Write your prompt: Use the starter template in the prompt editor to help structure your transformation. Reference up to two table fields using double-curly-brace variable syntax—for example,
{{TRANSCRIPTION}}and{{SUMMARY}}to evaluate whether a summary accurately reflects the original conversation - Name your output field: Give the field a label that will store the evaluation result (e.g.,
accuracy_score) - Select an output field data type: Choose the type that matches what your prompt returns. The metrics available for your monitor will be filtered to those compatible with the data type you select:
- Numeric — for scores, counts, or any numeric output
- String — for categorical or free-text outputs
- Boolean — for true/false outputs
- Select a model: Choose which LLM performs the evaluation. The models available are those supported by the warehouse where the table is located (e.g., Snowflake, Databricks, or BigQuery)
Configure Sampling
Sampling is applied before transformations run, giving full control over the number of rows evaluated while still getting useful coverage, which is particularly important for LLM-based checks.
The sample size can be configured in one of two ways:
- Set a hard cap – Limit the maximum number of rows evaluated per time bucket (e.g., up to 10,000 rows per run)
- Set a percentage with a cap – Evaluate a percentage of all rows with an upper limit (e.g., 10% of rows, capped at 10,000 per run)
Using BigQuery
-
Make sure the Vertex AI API is enabled here:
https://console.developers.google.com/apis/api/aiplatform.googleapis.com/overview?project=project_name -
Update
project_namein the URL. -
Follow the steps here to create a Connection ID.
-
Grant
BigQuery Connection Userpermissions to the Service Account. -
Follow steps here to update the permissions.
Note: The model used for queries is gemini-2.5-flash.
Notes about automated thresholds
The automated thresholds for some metrics, such as Null (%) and Unique (%), are optimized for the extremes. In other words, if a column rarely or never sees nulls, then the threshold becomes very very sensitive. But if there is a lot of volatility (e.g. where we see 30-50% null rate), and especially if that volatility is away from the extremes (e.g. 40-60% vs 0-1%), then it becomes insensitive. This is to prevent lots of false positives and noise.
"Metric - legacy" monitors
Metric monitors combine the functionality from two deprecated monitor types: Field Health and Field Quality Rules. In April 2024, their functionality was brought together in Metric monitors.
Some customers have Metric - legacy monitors in their environment, which are historical Field Quality Rules. These still function, and are simply renamed for design consistency. They were not automatically converted to Metric monitors because they have certain backend differences that result in slightly different behavior.
Metric Monitor FAQs:
To configure metric monitors as code, see the Metric Monitor MaC reference.
What changes will require my Metric Monitor to retrain its thresholds?
- Changes to the SQL WHERE clause filter and which rows are included, affecting the data distribution used for training.
- Changing fields changes what is measured, requiring model retraining.
- Changing segmentation changes how data is grouped, affecting anomaly detection.
- Changing metrics changes what is measured, requiring retraining.
- Changing aggregation changes how data is grouped over time:
- timeAxis (field or SQL expression)
- by (aggregation interval: Hour, Day, etc.)
- Changing the source table changes the underlying data, requiring retraining.
- Changing the metric in the alert conditions can require retraining if it changes what is monitored.
Updated 8 days ago