Quick Start Guide
This guide is intended for new users to quickly acclimate themselves to your existing Monte Carlo instance.
If you'd like to learn more about Monte Carlo in general, please visit Monte Carlo University.
In your Monte Carlo instance, you'll see the sections details below. Click on each to find out more about the features included in each.
- Assets - Single pane of glass for your data ecosystem
- Alerts - Command center for data alerts
- Monitors - Configuration for custom data monitoring
- Dashboards - Insights and reporting on your Monte Carlo instance
- Settings - Platform configurations (including notification setup)
1. Assets
Click here to go to your Assets page
Monte Carlo's Assets provides users with a single pane of glass to see all of the data assets that are connected to your Monte Carlo instance. All metadata about assets in the warehouse/lake as well as your BI tool are collated in Assets.
To start using Assets, try typing in a data asset you are interested in (Note: a data asset can be an external table, a table or a view). In this case, we are searching for a table called subscription in the staging schema. The catalog's search functionality allows you to search for keywords as well as filter by tags.
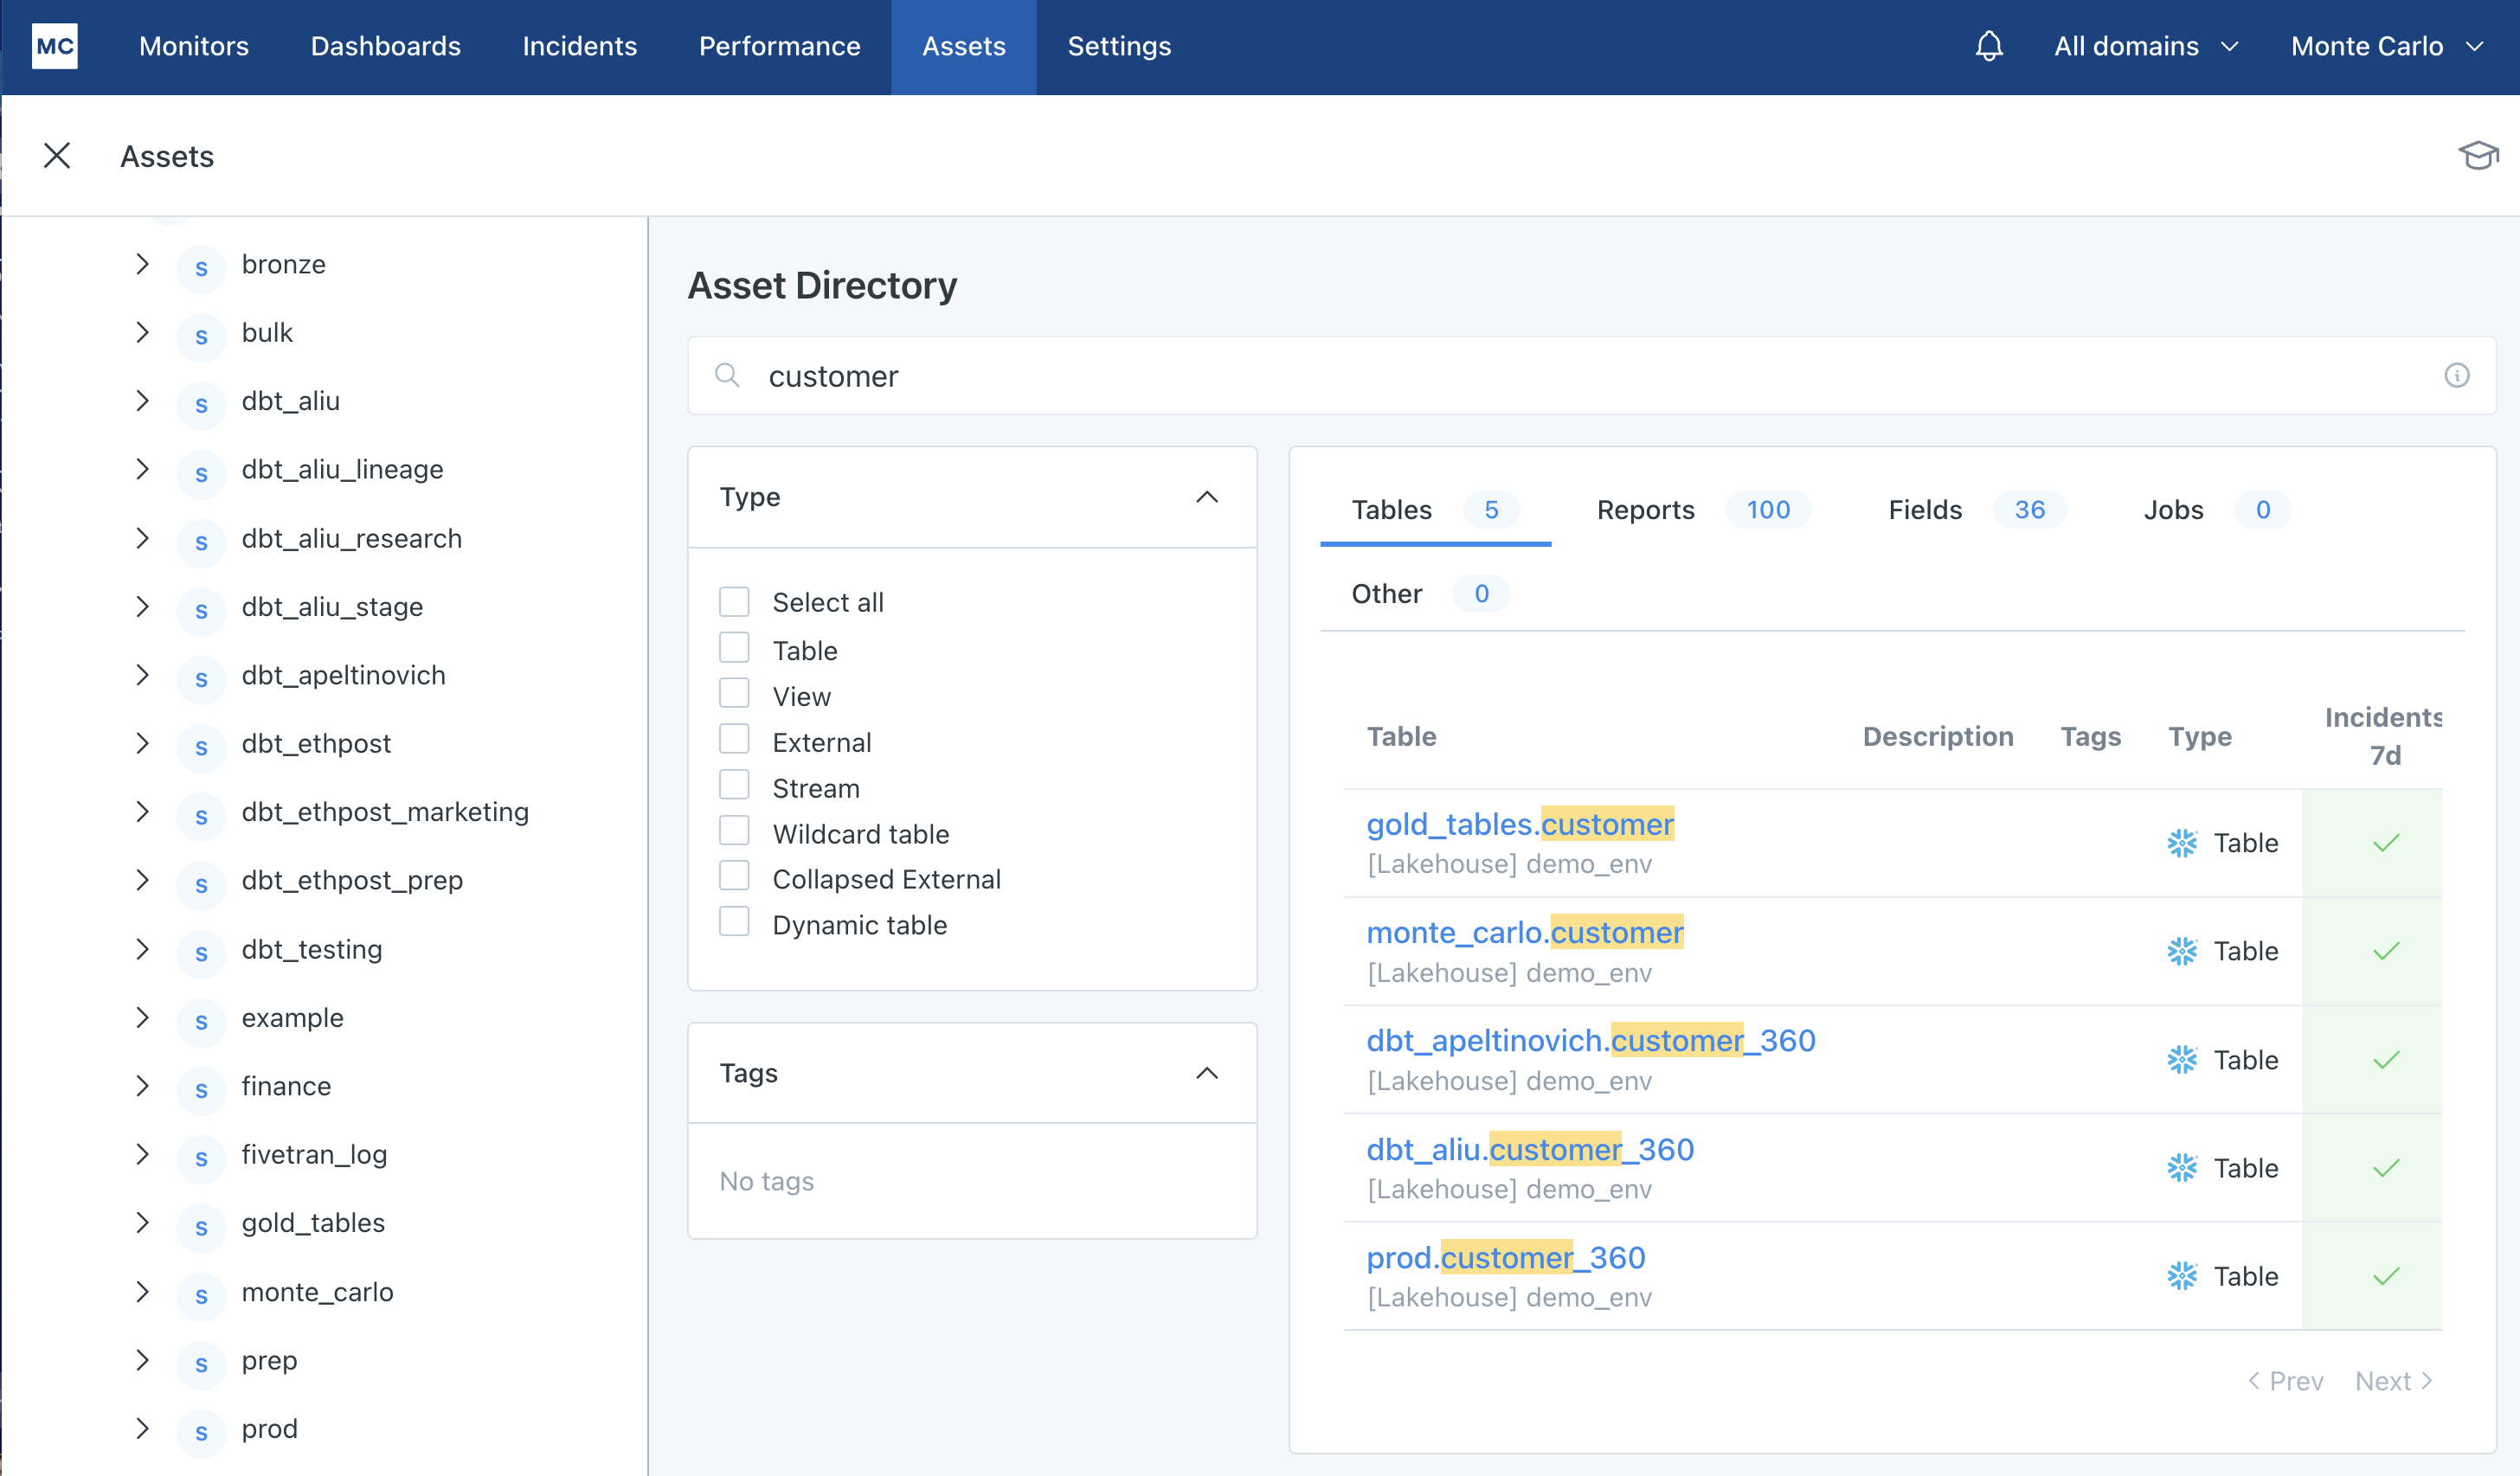
Navigation functionality on the Assets landing page
Clicking on the table we are interested in, we land on the summary page for that data asset. Here you will be able to see some general information on how often the table is updated and how many rows the table has.
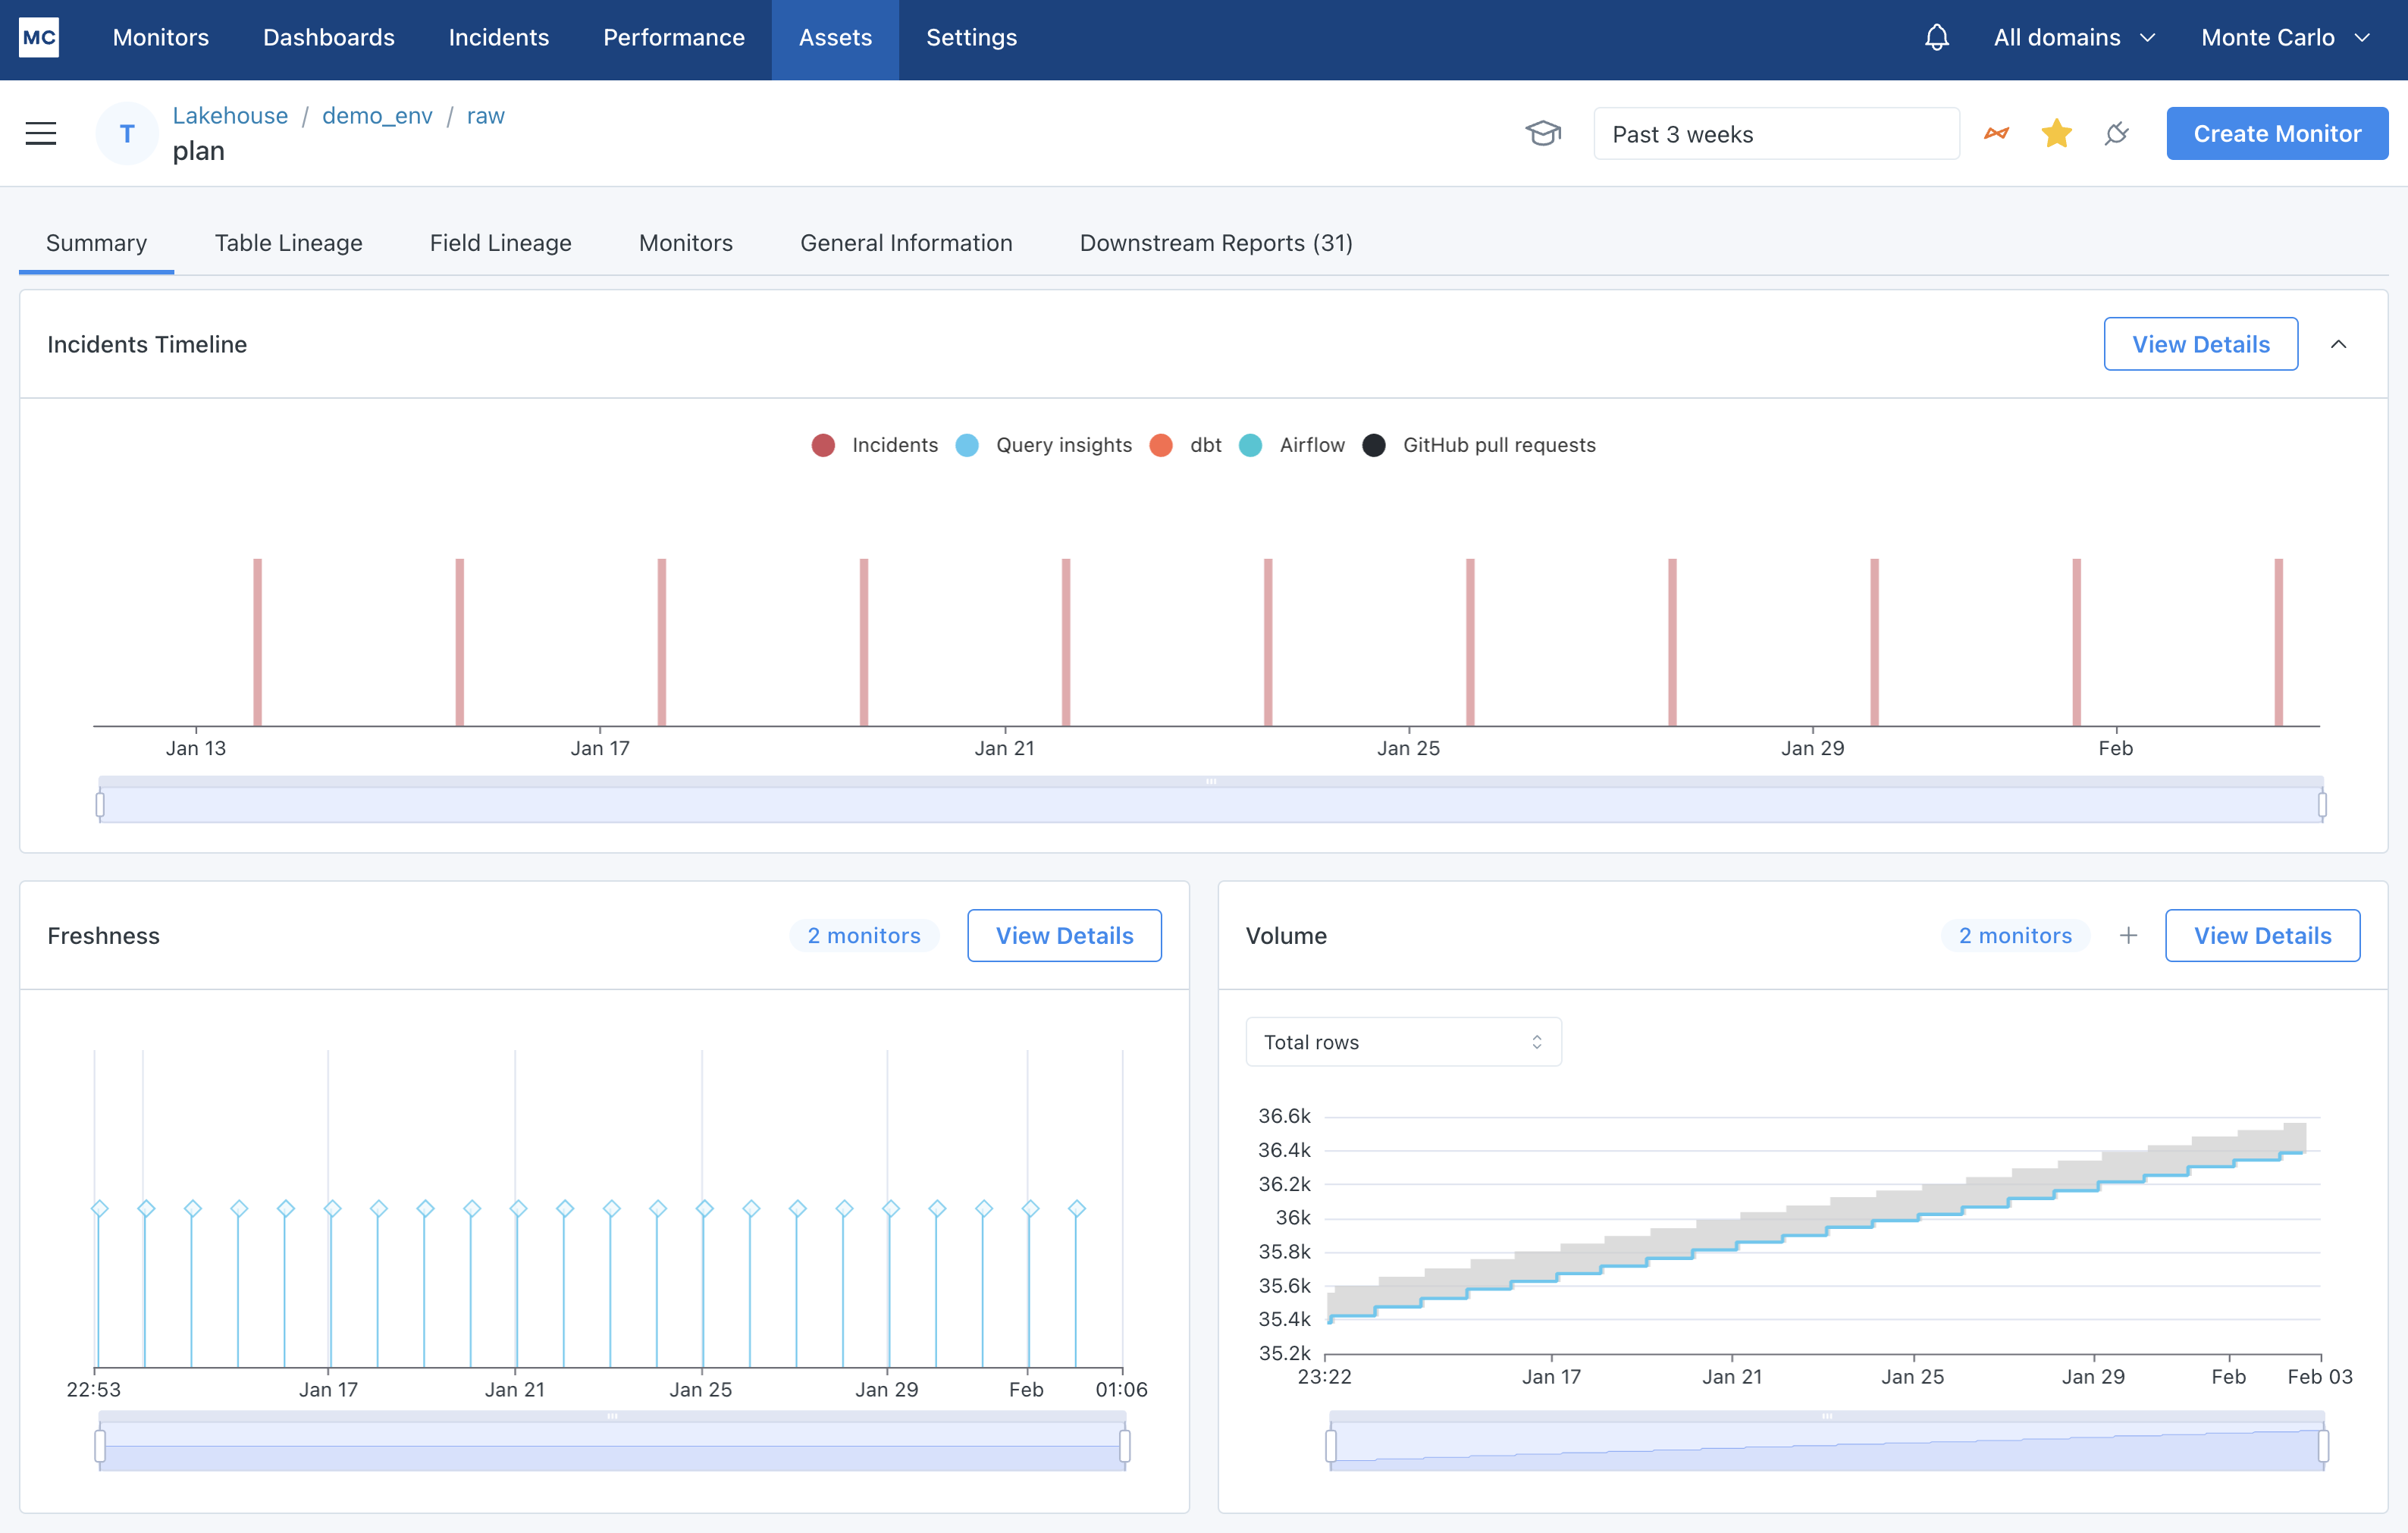
Summary tab of an asset detail page
With this view, you can see all metadata Monte Carlo has collected and created about a data asset. You can answer questions like:
- What data assets are upstream or downstream of this table? (See
Table Lineagetab) - How are the fields in this table used upstream and downstream? (See
Field Lineagetab) - What queries are being run on this table? (See
Query Logsgraph on Summary tab) - What does the freshness and update pattern look like on this data asset? (See
FreshnessandVolumegraphs on Summary tab) - What alerts have occurred on this table? (See
View Detailson Alerts Timeline graph) - What BI reports are connected to this table? (See
Downstream Reportstab) - What additional monitoring does this table have? (See
Monitorstab)
2. Alerts
Click here to go to your Alerts page
Alerts are data anomalies caught by Monte Carlo. You can learn more about the types of monitoring capabilities Monte Carlo has here.
Monte Carlo's Alerts section is your command center for understanding what is happening in your data ecosystem as well as providing tools to perform root cause analysis and manage the alert to resolution.
The landing page is a feed of all alerts. You can see some filters on the side filter down to specific types of alerts. Each row on this page is a summary of the alert with a few quick access alert management tools. Clicking on the alert link will take you to the detail page for a particular alert.
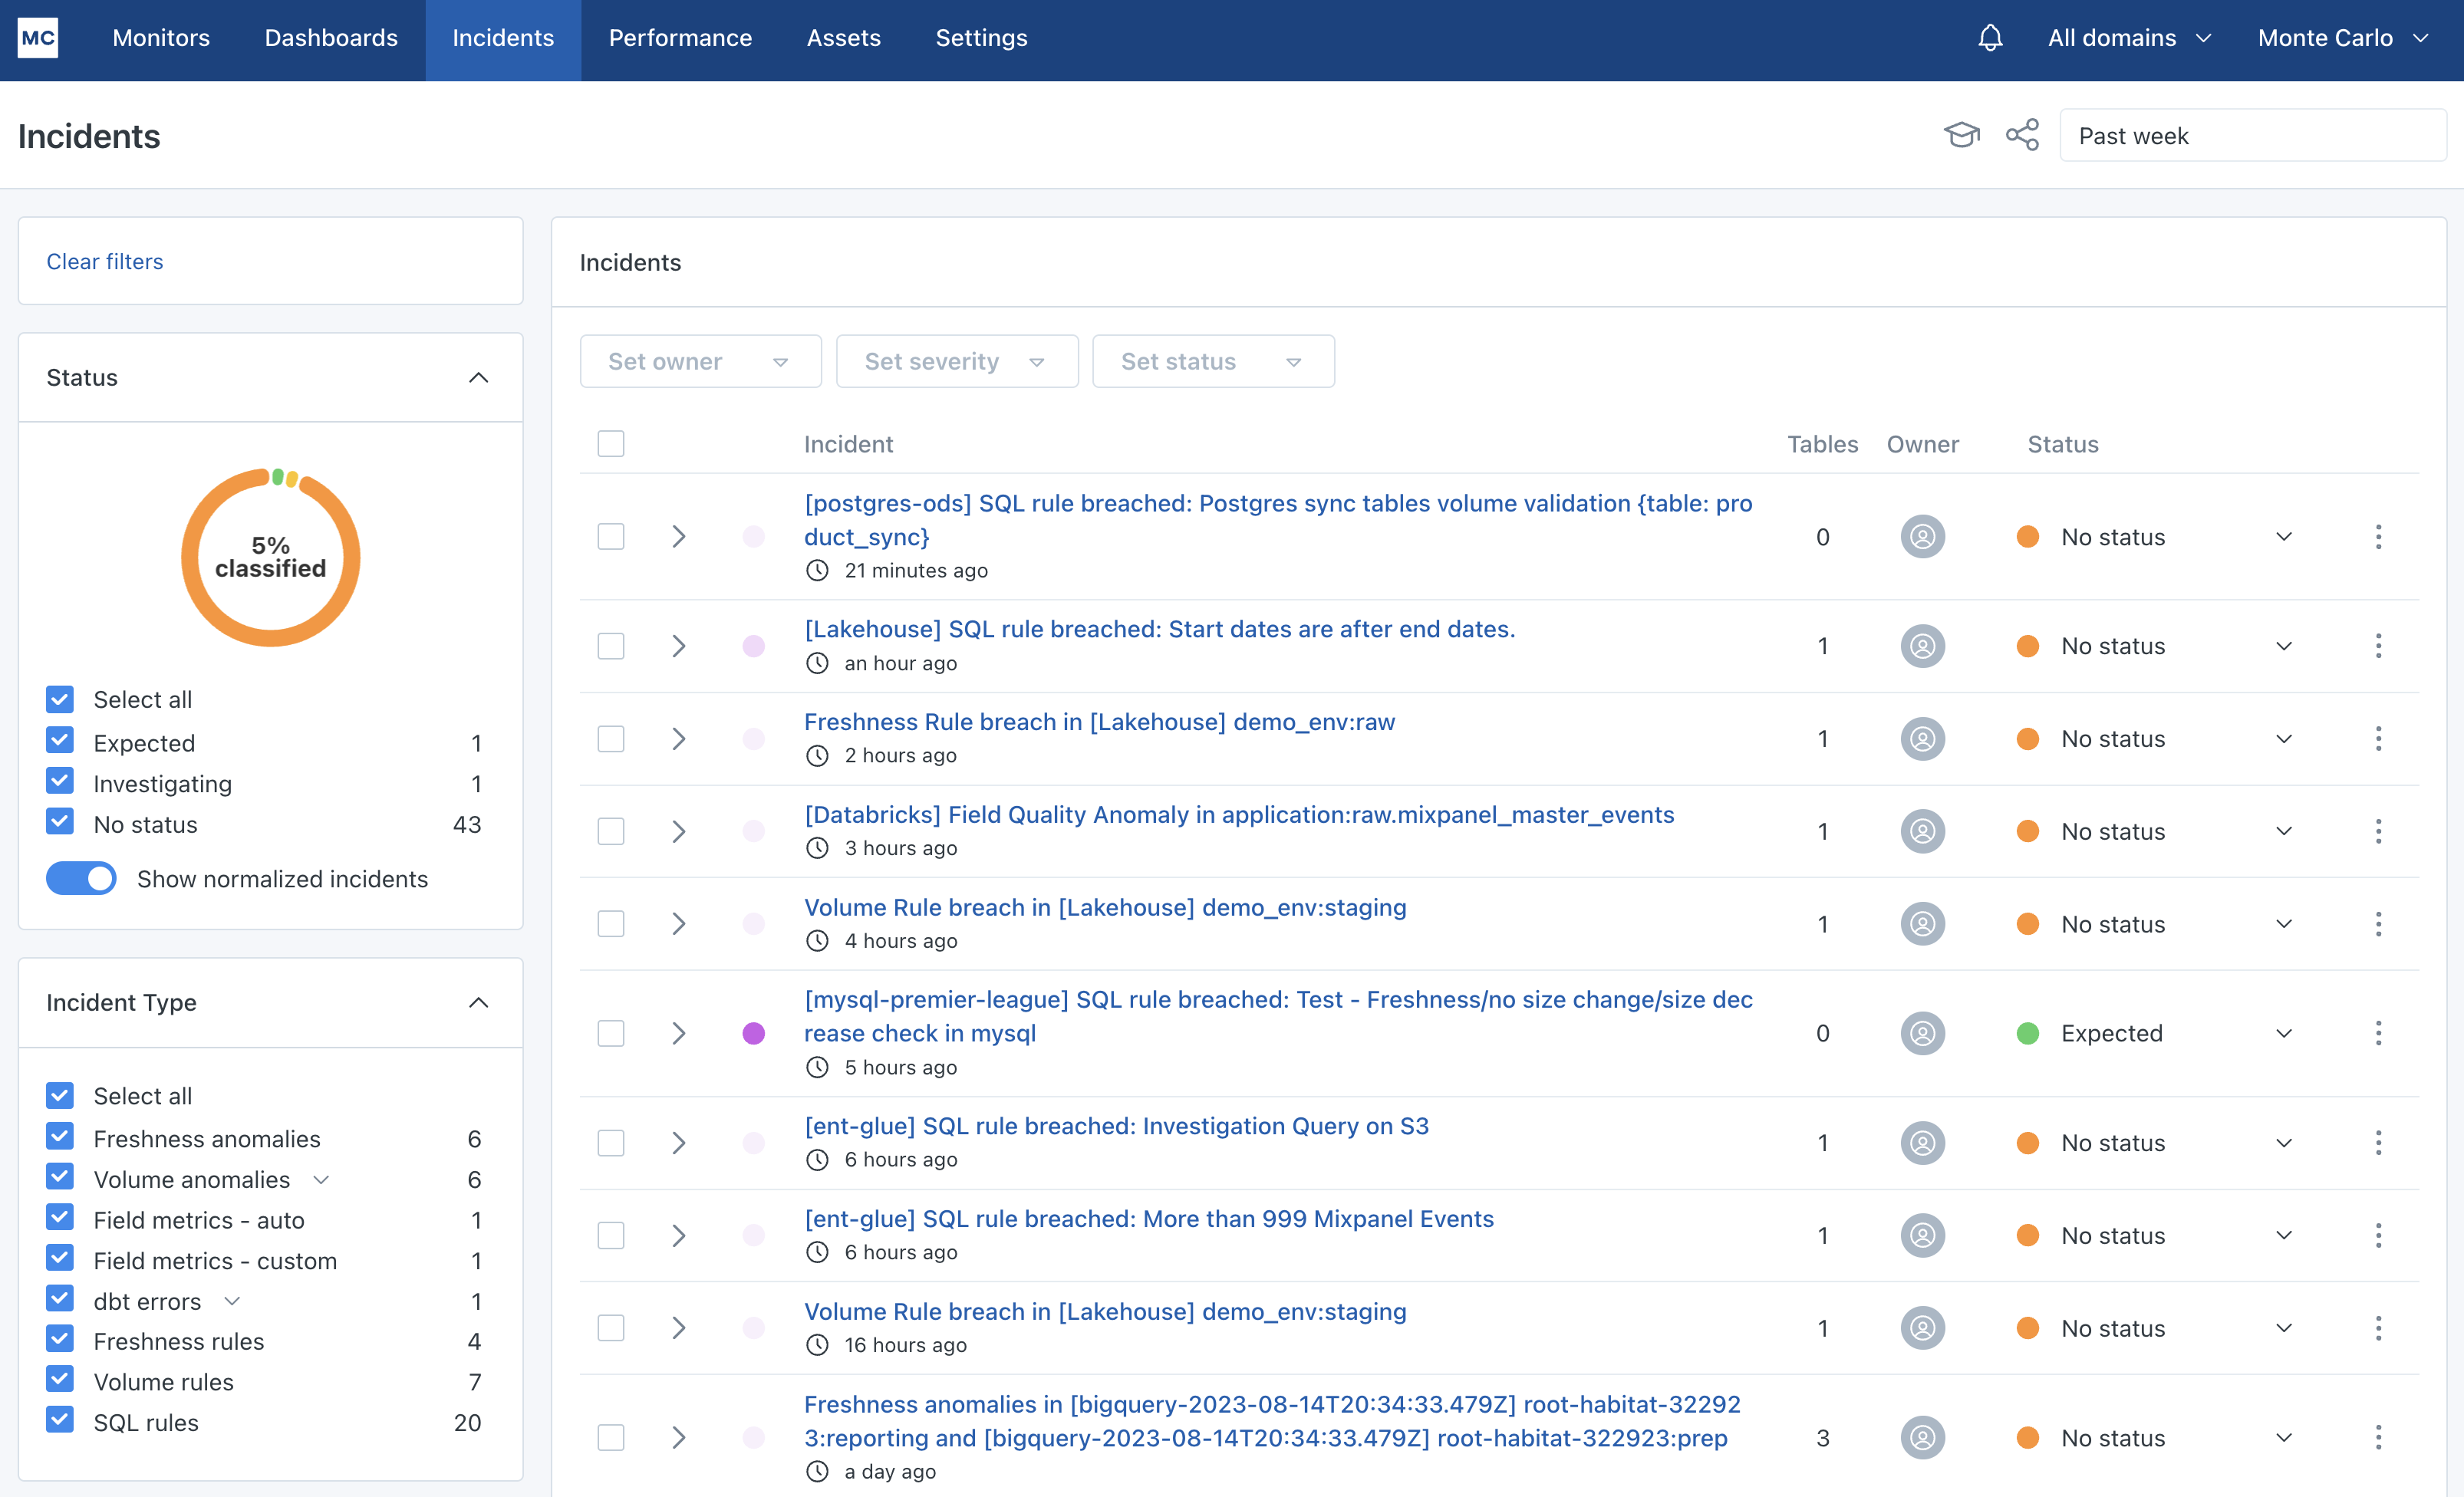
Alerts feed
The summary tab of the Alerts IQ page for a particular alert will let you know what issues were found and what the impact of the alert is. This should be the starting point for you to perform root cause analysis. You can answer questions like:
- What data assets are upstream and downstream of these alert tables?
- What queries have been run on the alert tables?
- What specific BI reports could be impacted by this alert?
- Is this alert similar to past alerts that have occurred on this table?
To answer these questions and more, be sure to click on the Investigate Asset button to understand the normal patterns for a particular table.
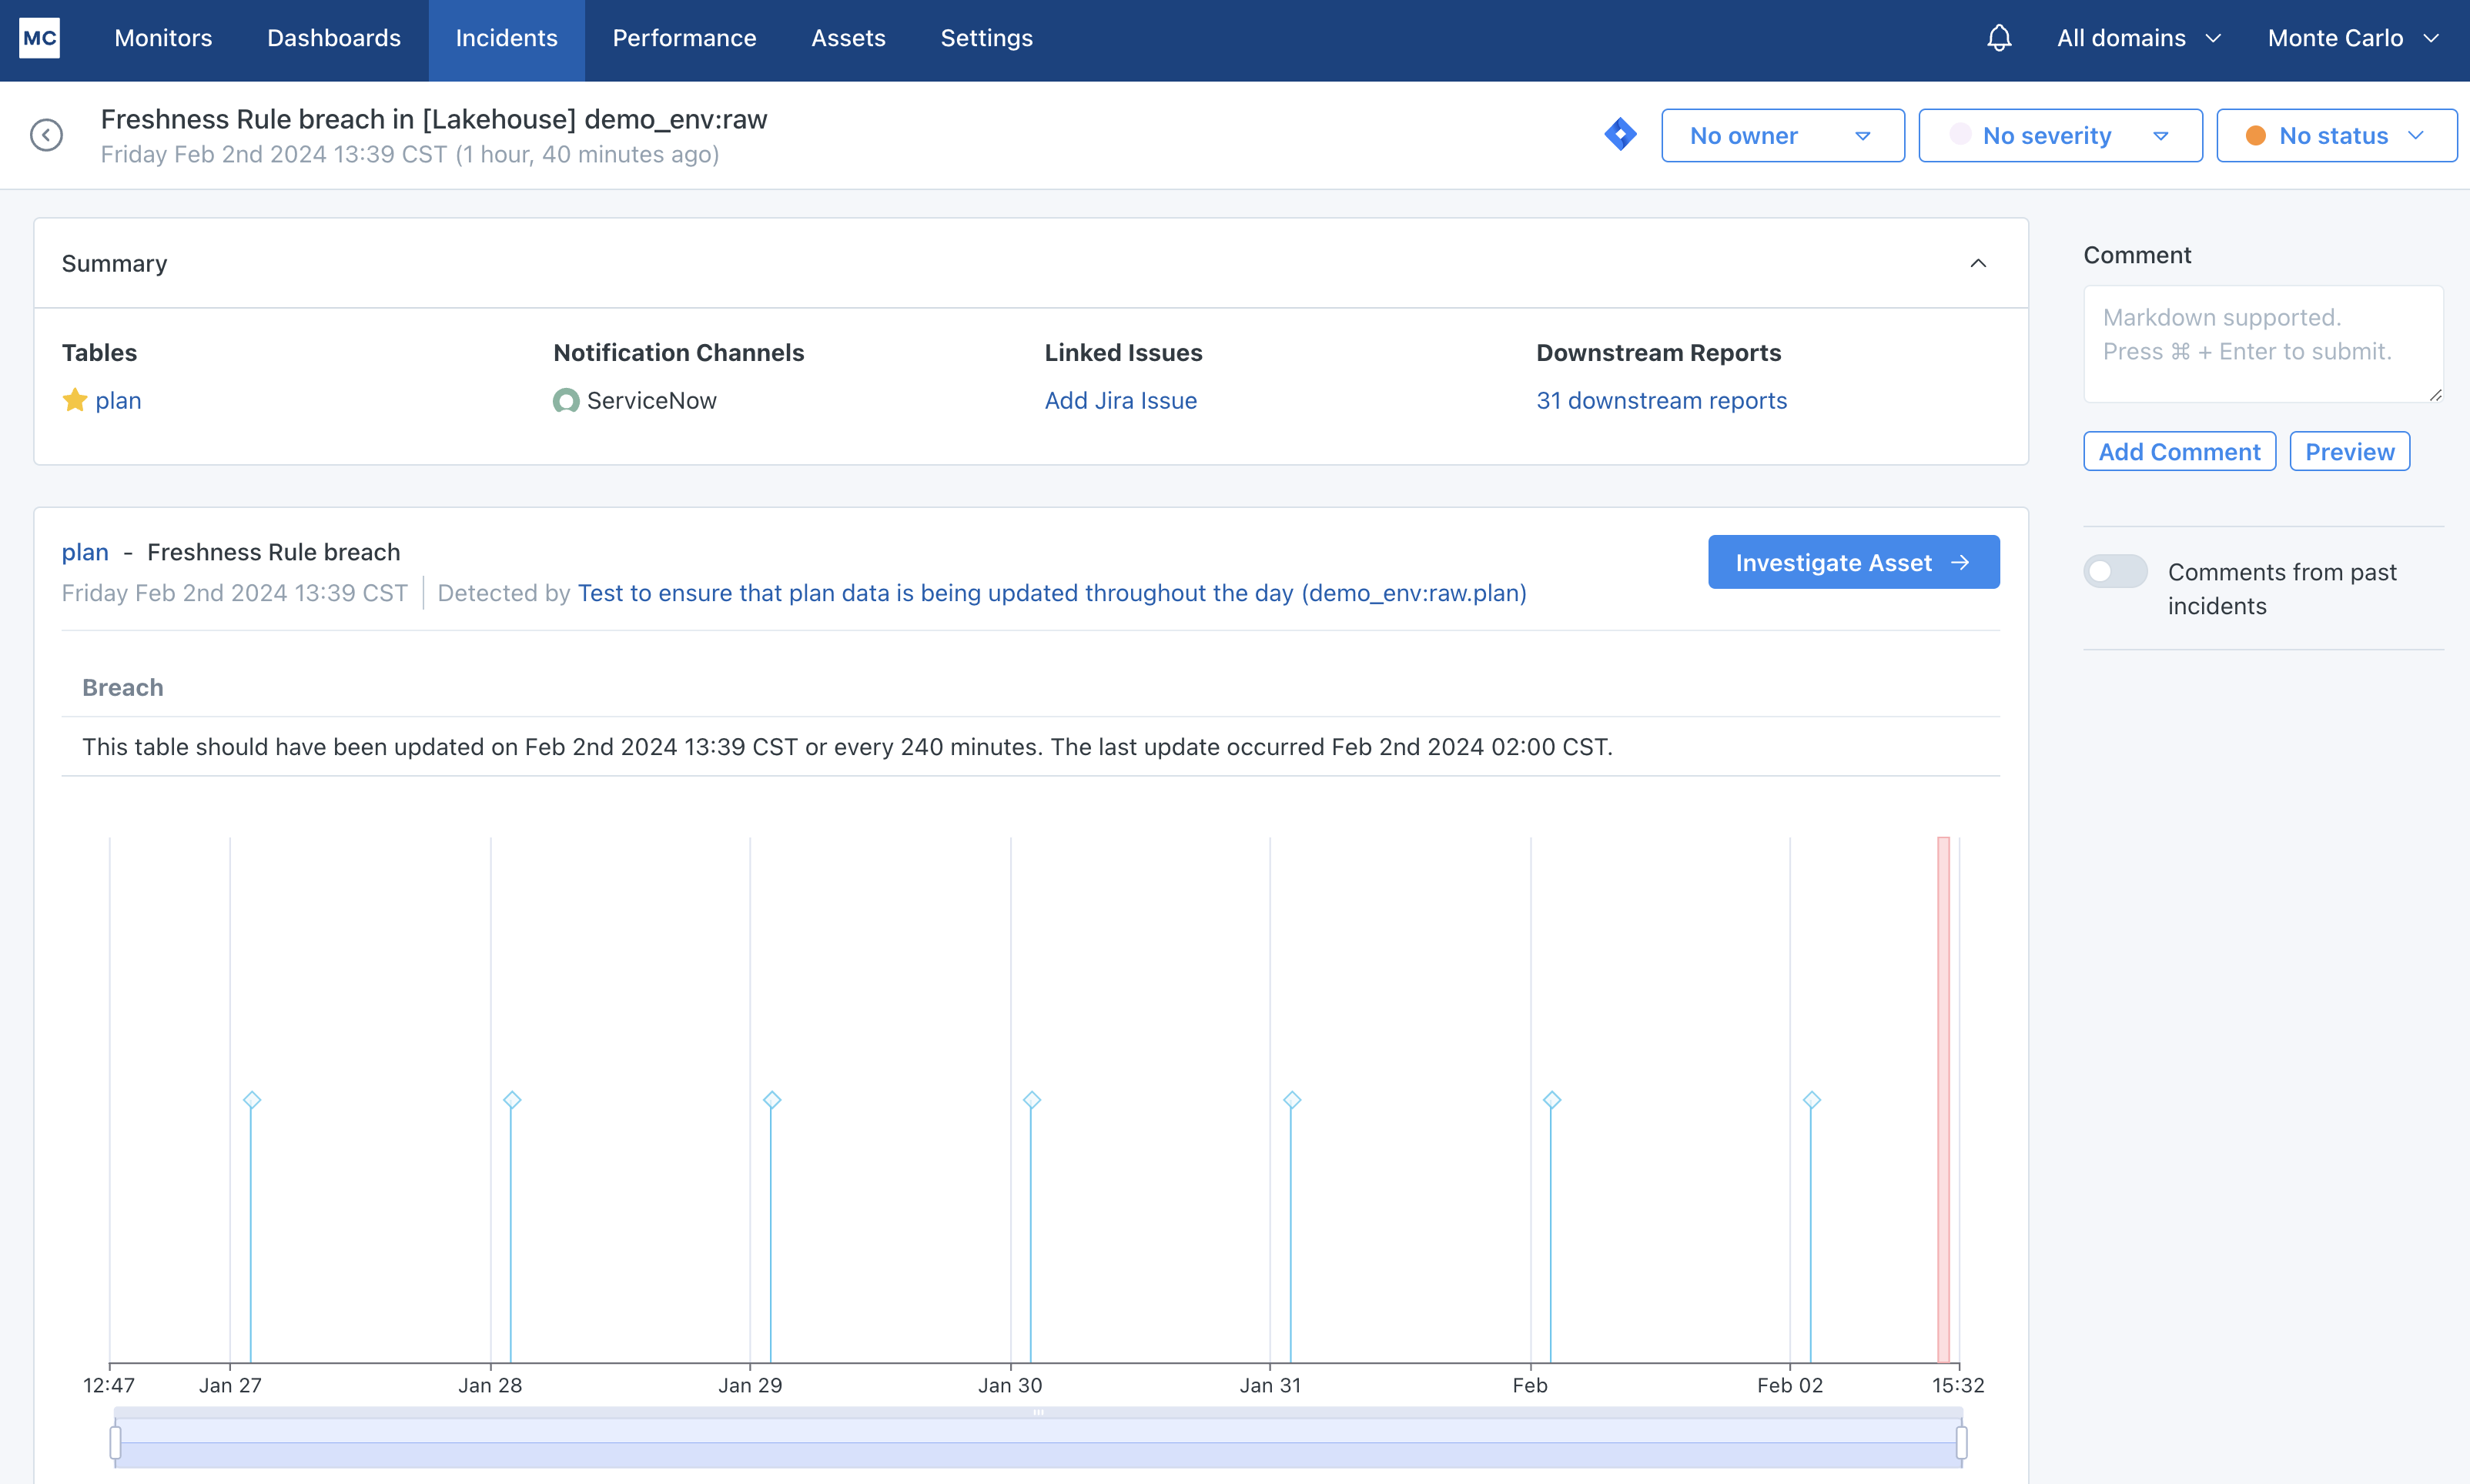
Alert IQ
3. Monitors
Click here to go to your Monitors page
Monitoring is the Data + AI Observability layer of your data ecosystem. Monte Carlo provides base level monitoring by default, and also gives you the ability to opt into deeper coverage ML-based monitoring as well as the flexibility to set up monitoring based on your own custom rules. You can find out more about monitors here.
In the Monitors section, you'll see a summary of your monitoring at the top of the page including what automated monitors you have active, and in the bottom half of the page, you will see a list of all custom monitors that you have in place in addition to the automated monitoring.
Within Monitors, you will be able to perform the following actions:
- View and search through your existing custom monitoring estate
- Click into an existing monitor to see how it is configured, how it is running and what alerts it has generated
- Create new custom monitoring
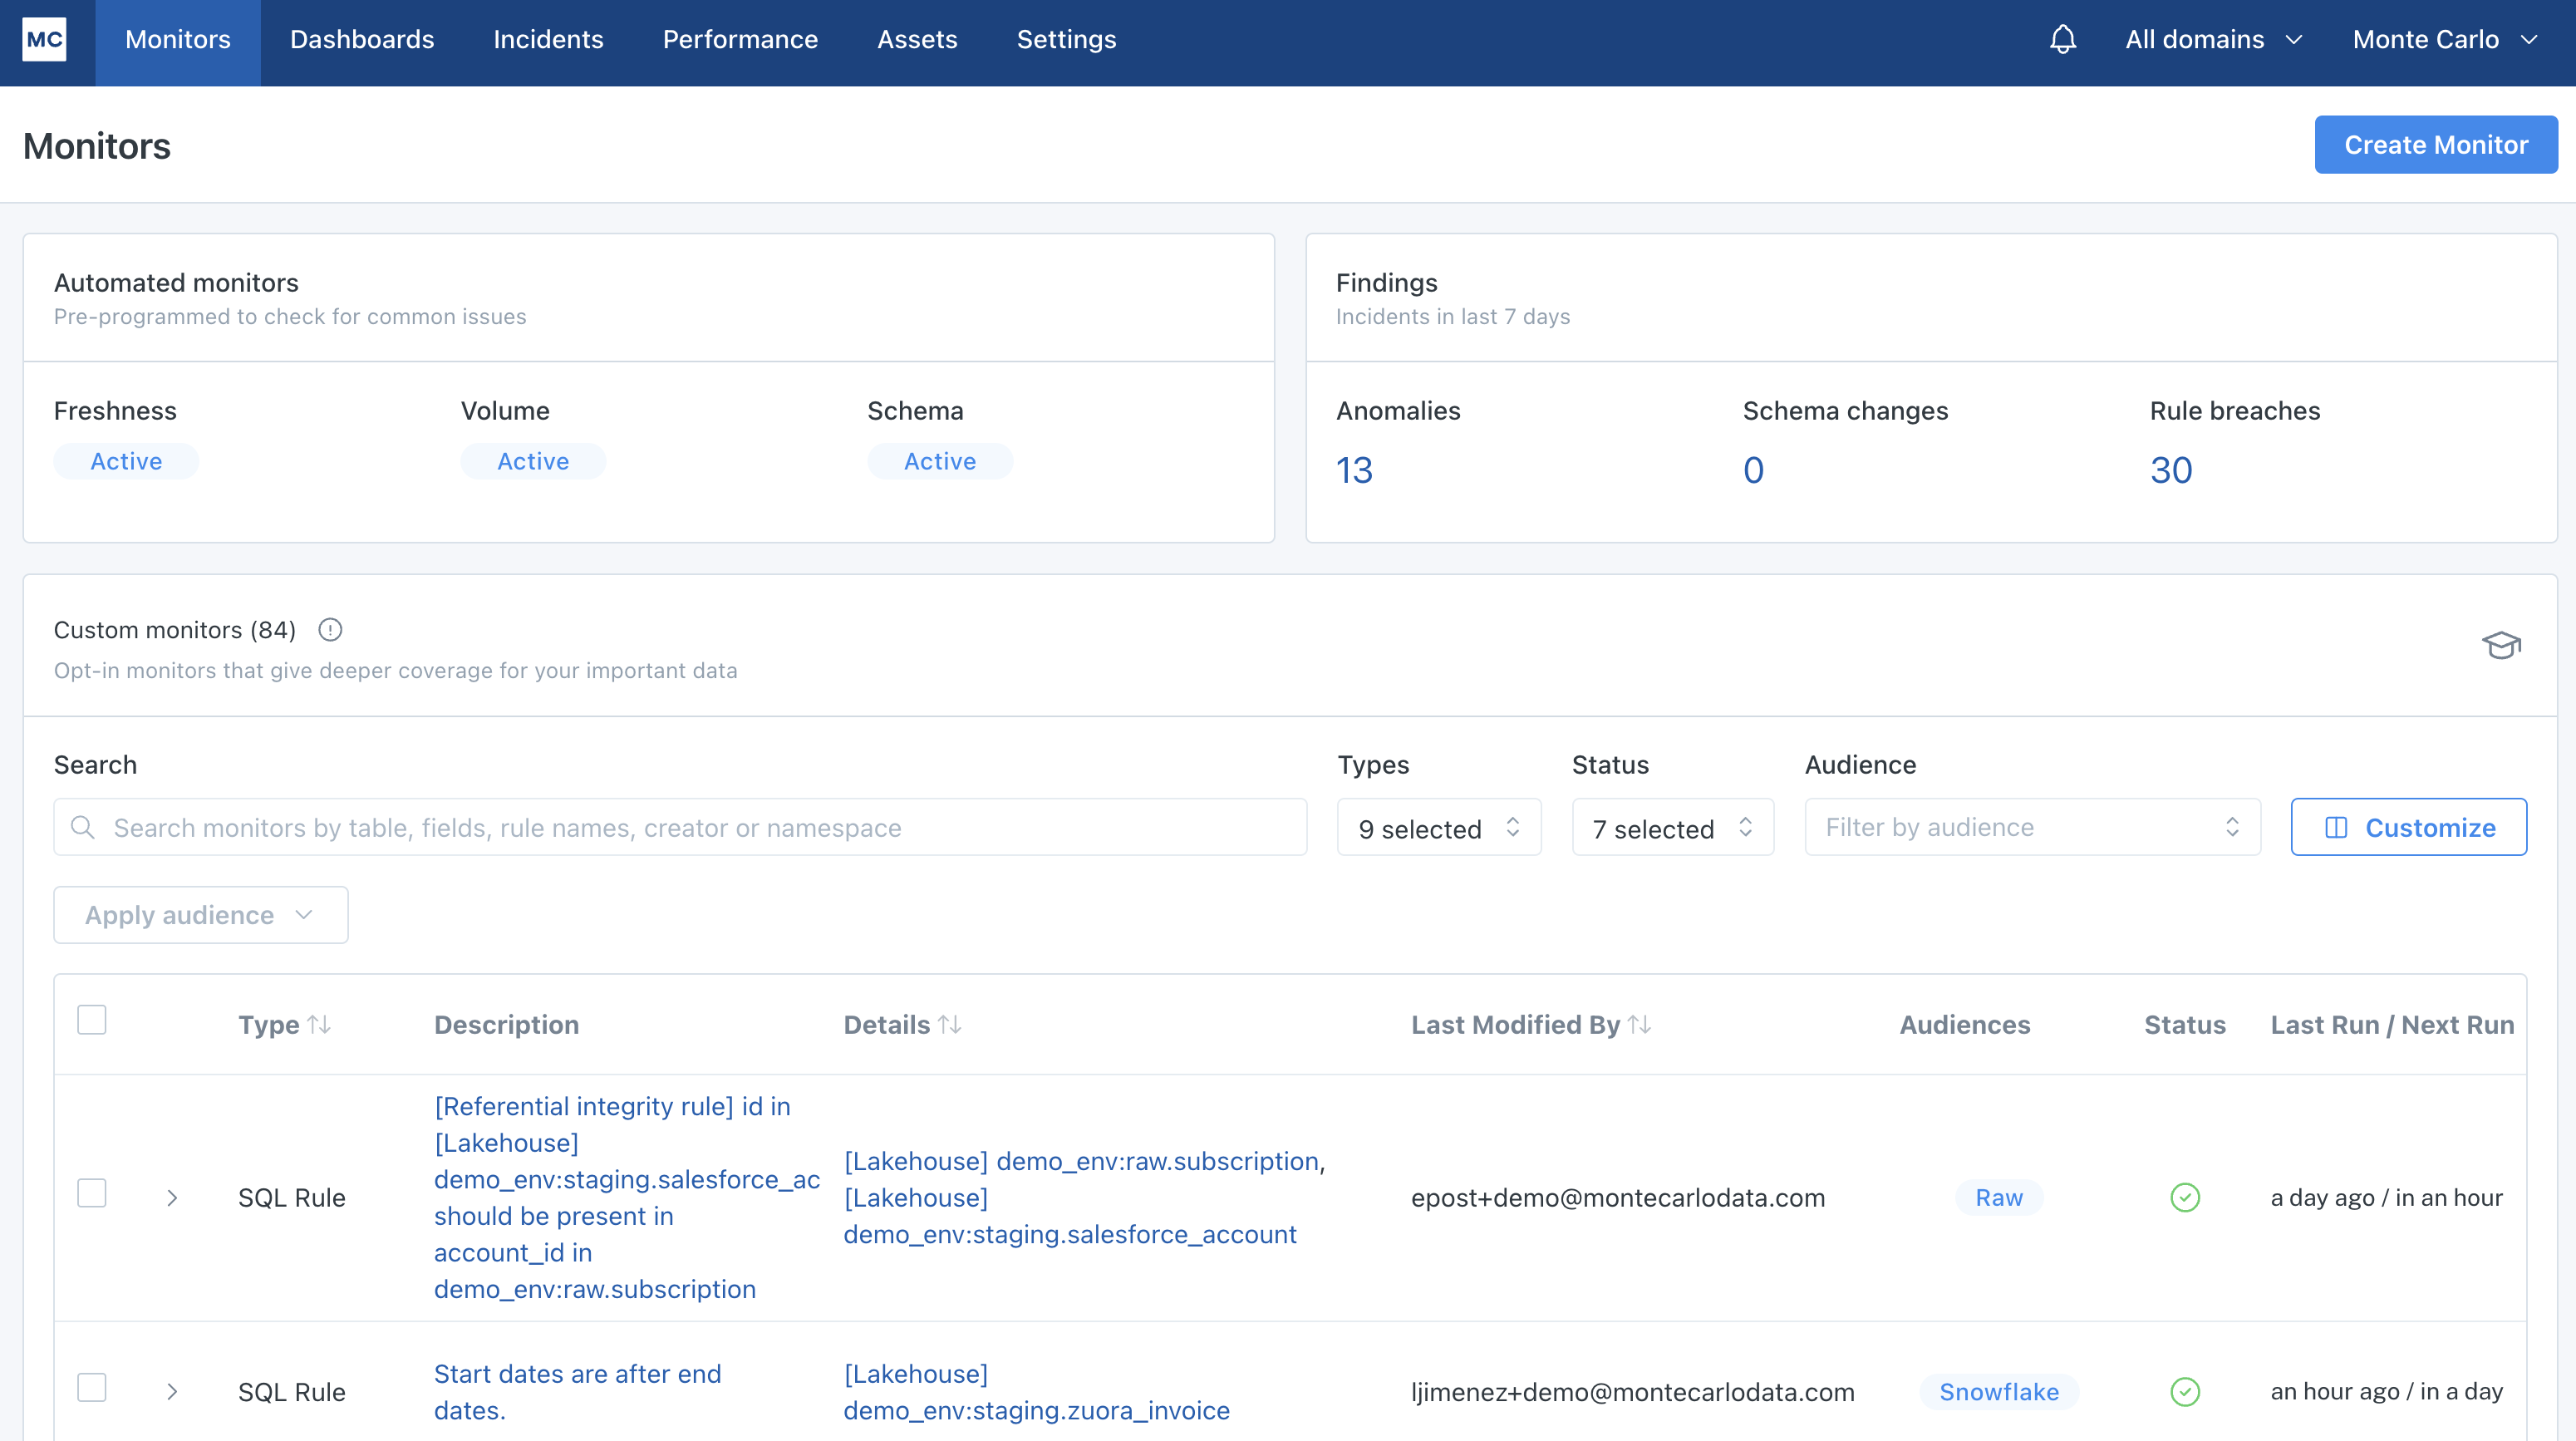
Monitors landing page
In the custom monitors list, you can use the carrots on either side of the monitor to click into the detail page for that monitor.
Clicking the Create Monitor button at the top right takes you to a workflow for setting up each monitor type. To learn more about setting up these monitors, see the Monitors overview section in our docs.
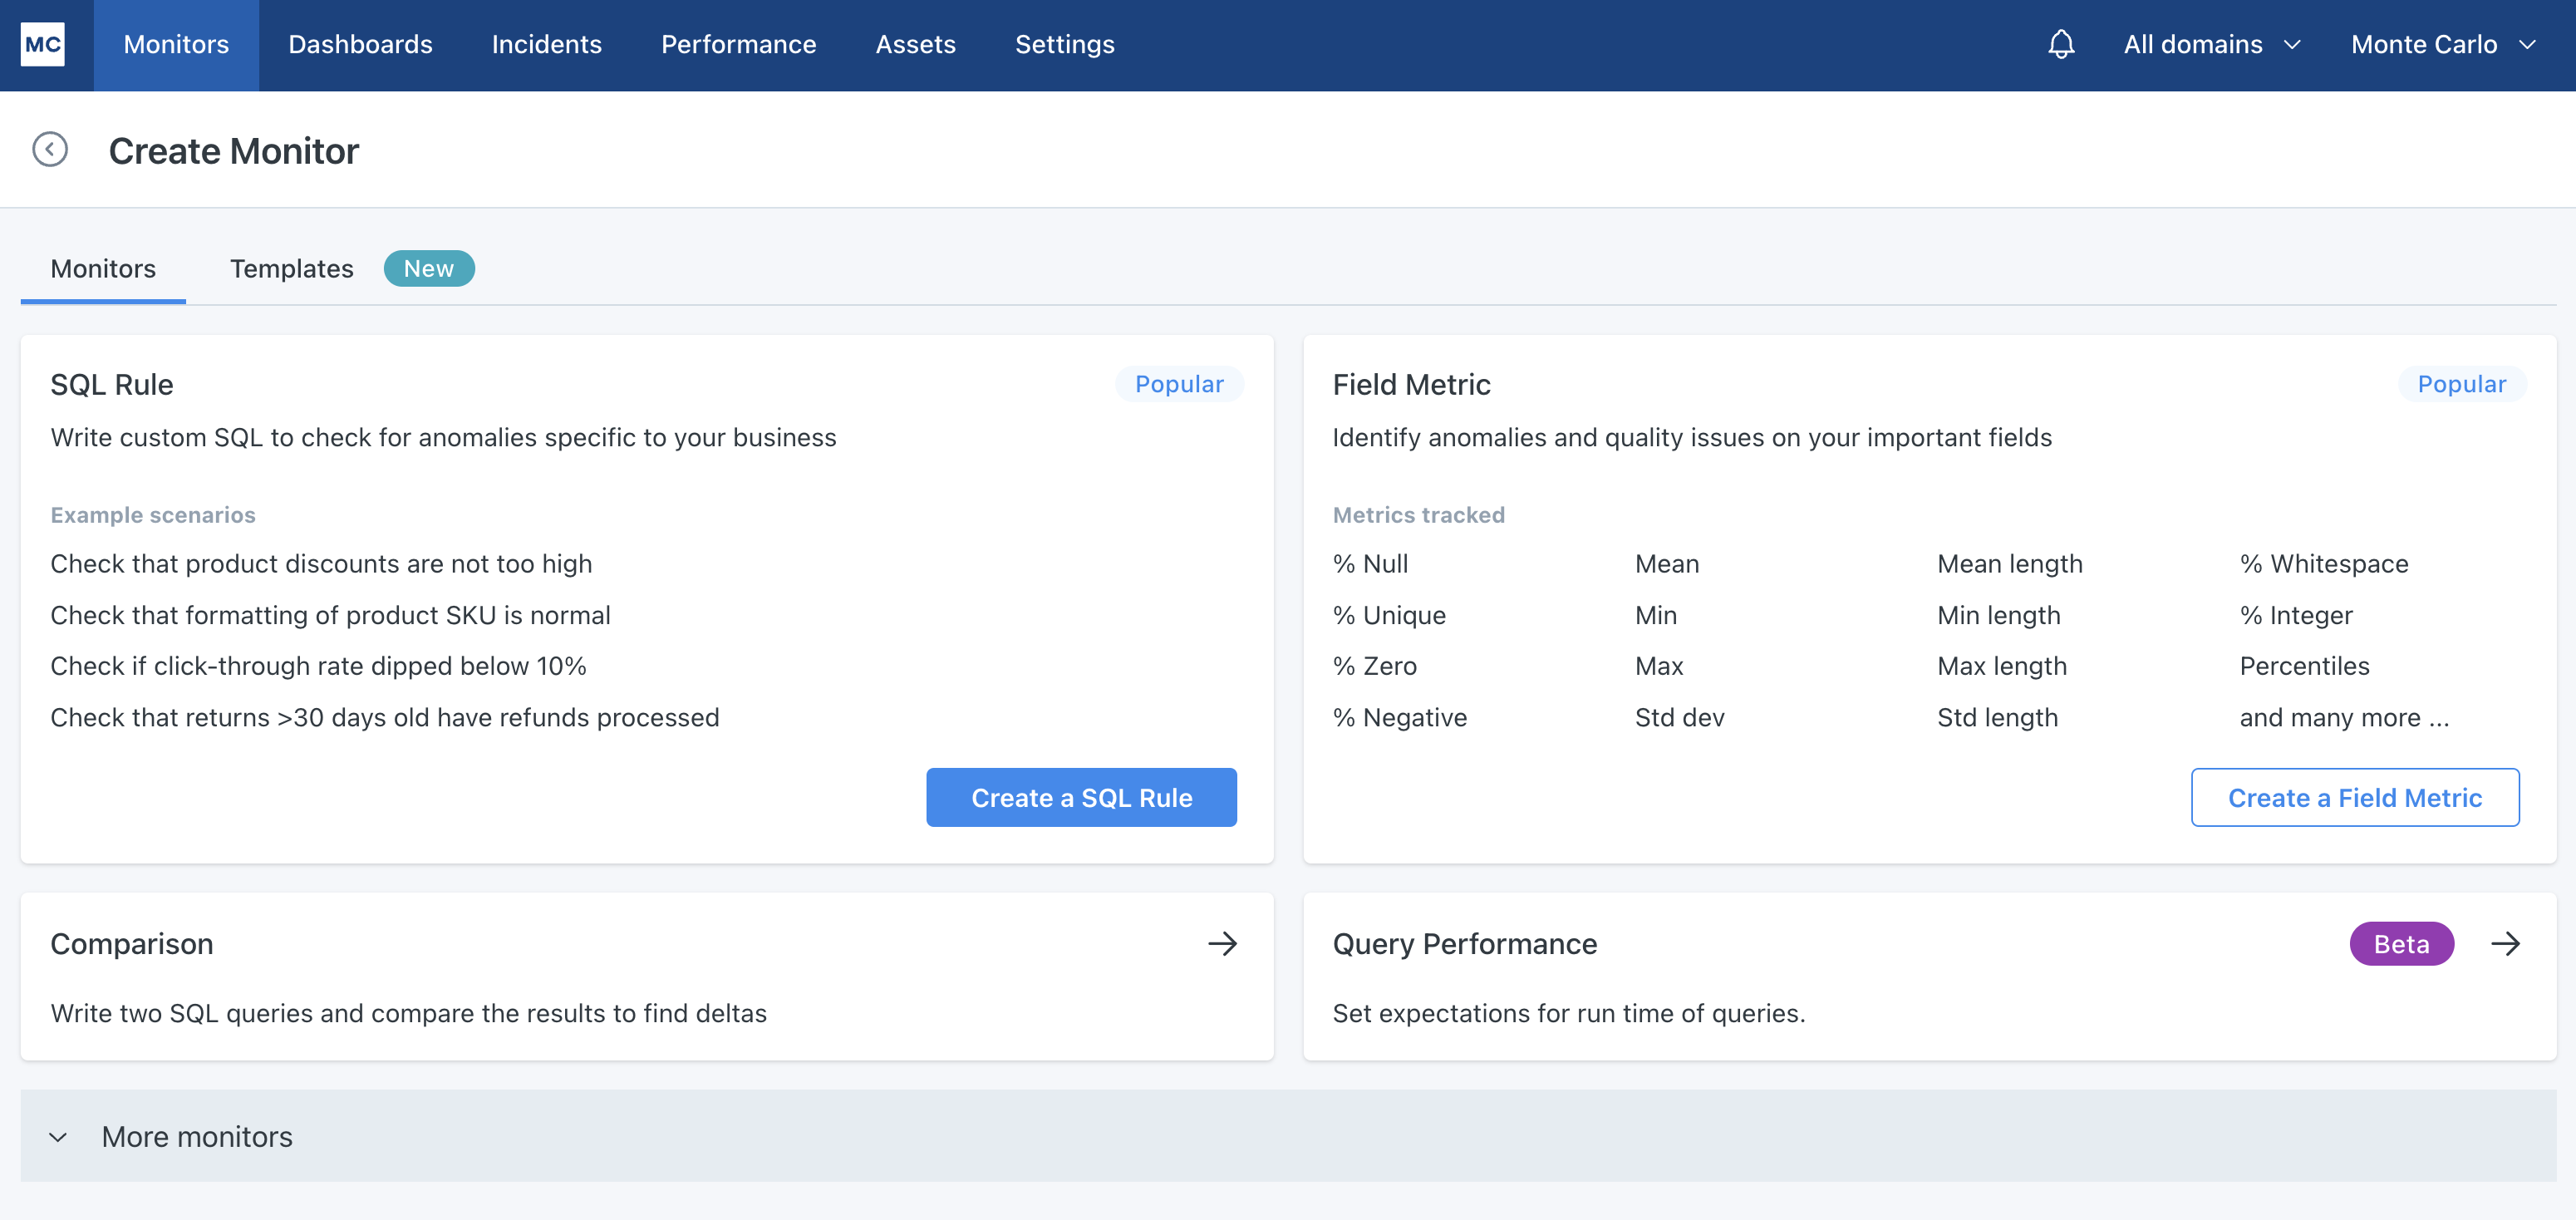
Monitor creation landing page
4. Dashboards
Click here to go to your Dashboards page
Monte Carlo provides you with a suite or reporting and insights that you can use to understand your data reliability metrics, data ecosystem health and closely govern your data warehouse usage.
Learn more about all of the dashboarding and insight functionality we have here.
Data reliability dashboard
When you go to the Dashboards section, you will land on your Data Reliability dashboard. This is a high level view of your data ecosystem, including data uptime calculations that we create on your behalf. You can find out more about the reporting in this dashboard here. We recommend using this reporting to track progress towards your data quality strategy. This dashboard can answer questions like:
- How often is my team responding to alerts?
- How long does it take my team to respond to alerts?
- How long does it take my team to resolve alerts?
- What percentage of my tables are alert free?
- How many alerts are my custom monitors generating?
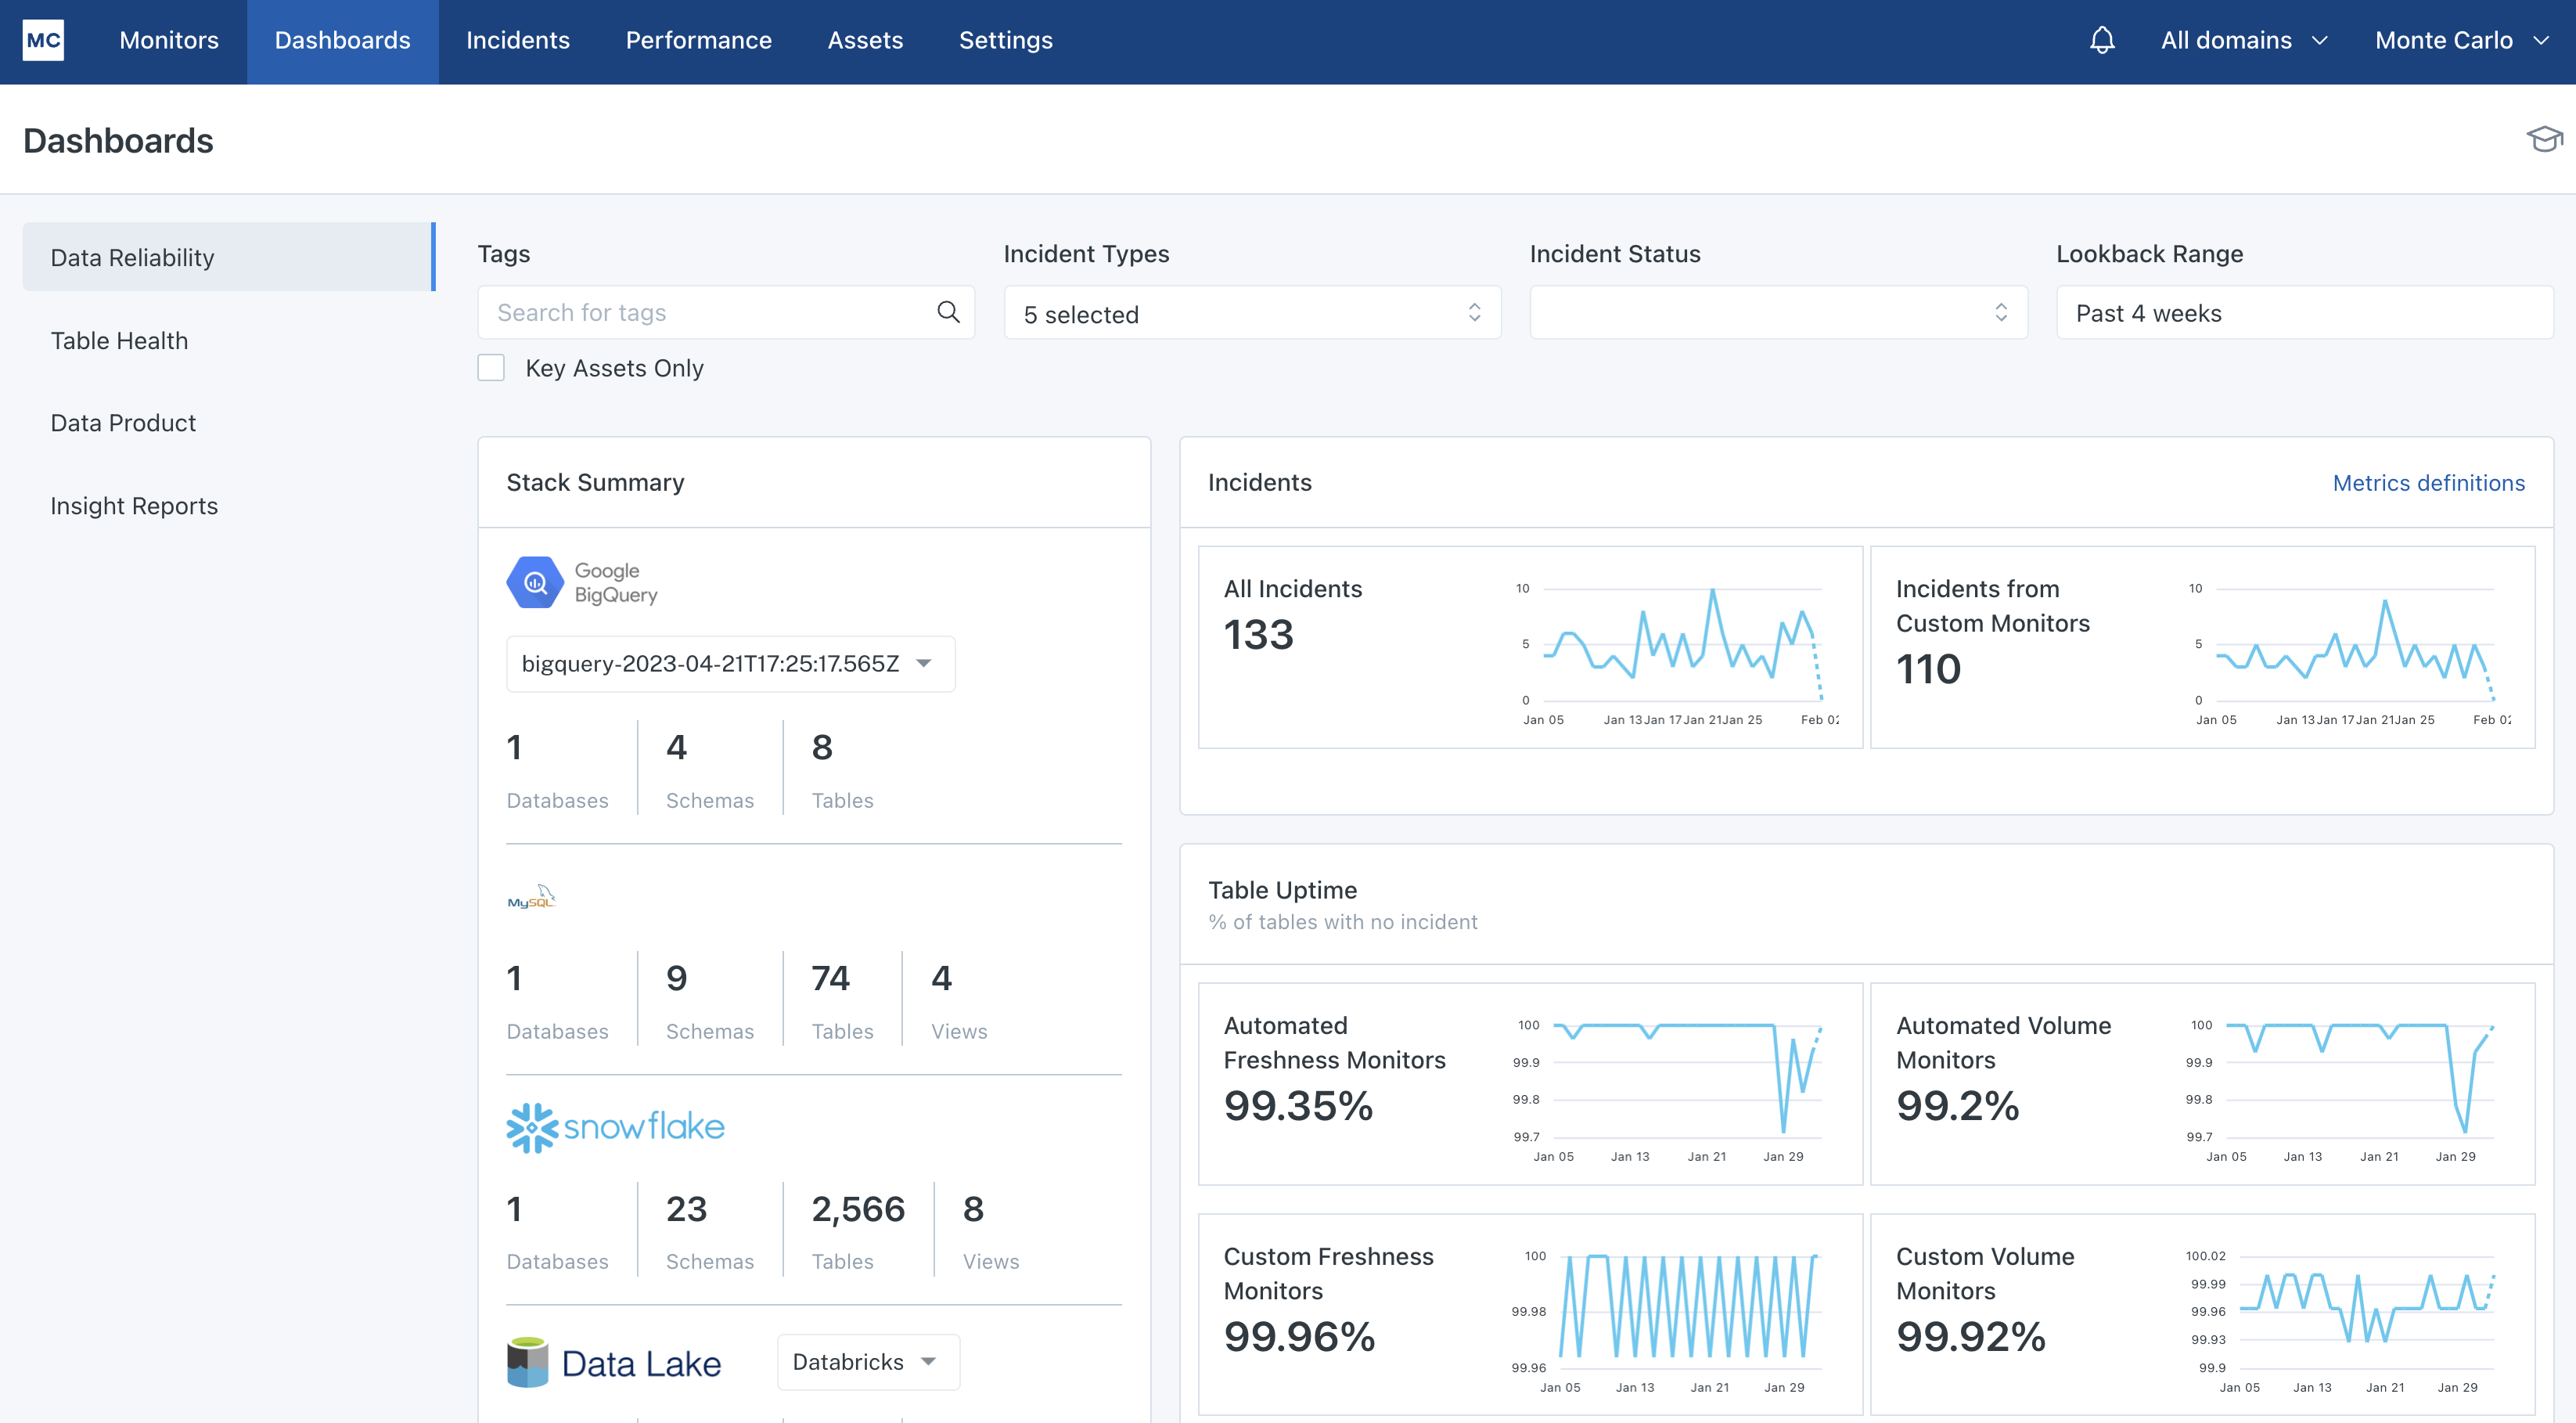
Data Reliability Dashboard
5. Settings
Click here to go to your Settings page
Our Settings section houses most configuration options available to you in terms of how your platform works. The following actions can be performed in this section:
- Manage users, auth groups and SSO setup (See
Users,Authorization Groups,Single Sign Ontabs) - Manage the connections for integrations in your data warehouse, BI tool, data orchestrator and notification mediums (See
Integrationstab) - Create and manage API keys and run API calls (See
API AccessandAPI Explorertabs) - Create and manage domains, which are logical groupings of data assets (See
Domainstab) - Mute noisy or unimportant datasets and tables (See
Muted Data and Filterstab) - Use regex to remove unimportant nodes in your table lineage (See
Muted Data and Filters>Lineagetab)
Updated 20 days ago
What’s Next
Now that you're familiar with the platform, try setting up some custom monitors