Volume
Use Cases
Volume Monitors are useful in identifying anomalous changes in row count or byte count. For example:
- Alert if a size change for a table is unusually large or small. For example, if a table normally adds 3,000 - 5,000 rows per day, but suddenly adds 20,000.
- Alert if the row count decreases, for a table where decreases are rare.
Users can select from automatic thresholds that are determined by machine learning, or configure their own explicit threshold.
Interacting with Volume Monitors
Volume monitors are managed from Assets. From the Volume section on the Assets > Summary page, users can see the current threshold, adjust the sensitivity, switch to a manual threshold, or disable volume monitoring from the Volume widget.
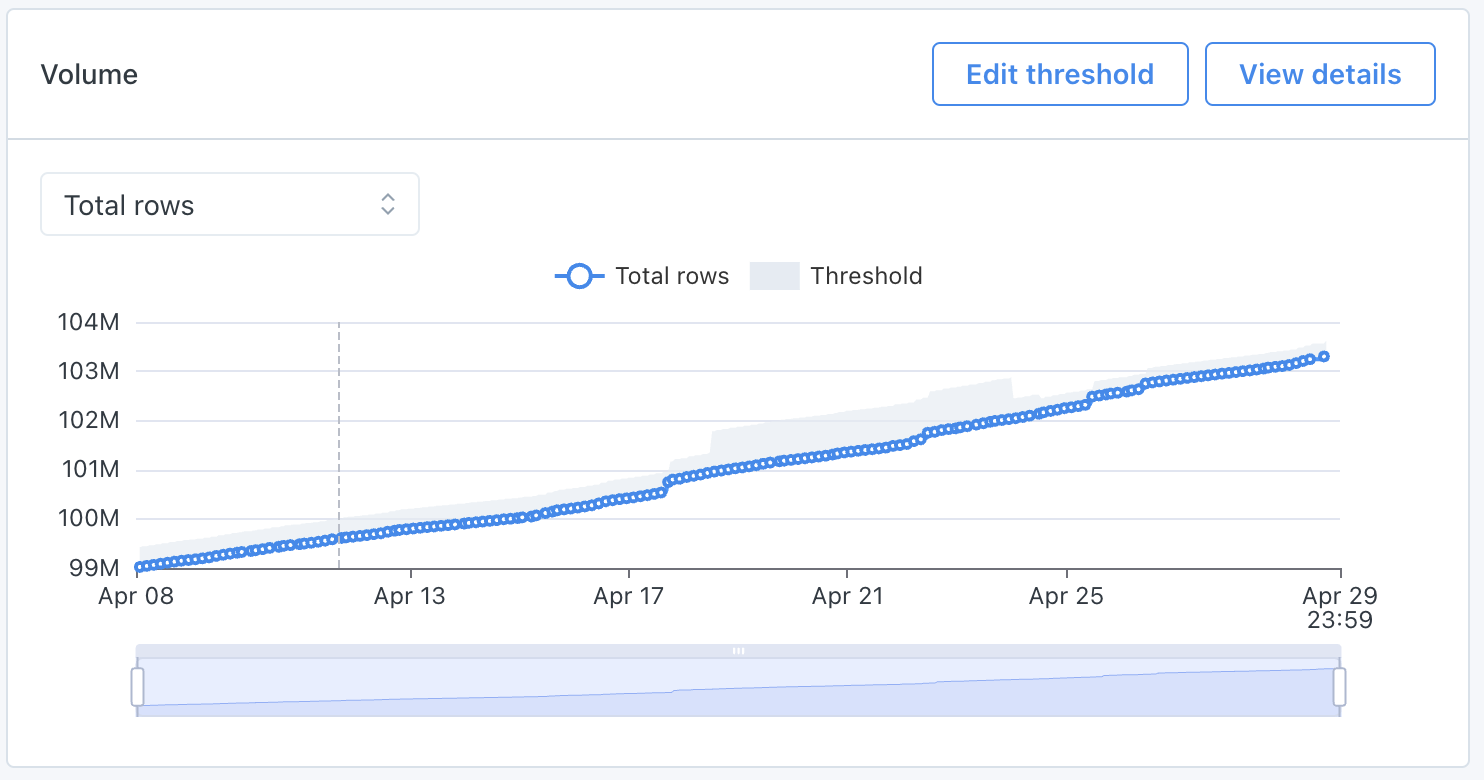
The Volume section on Assets > Summary
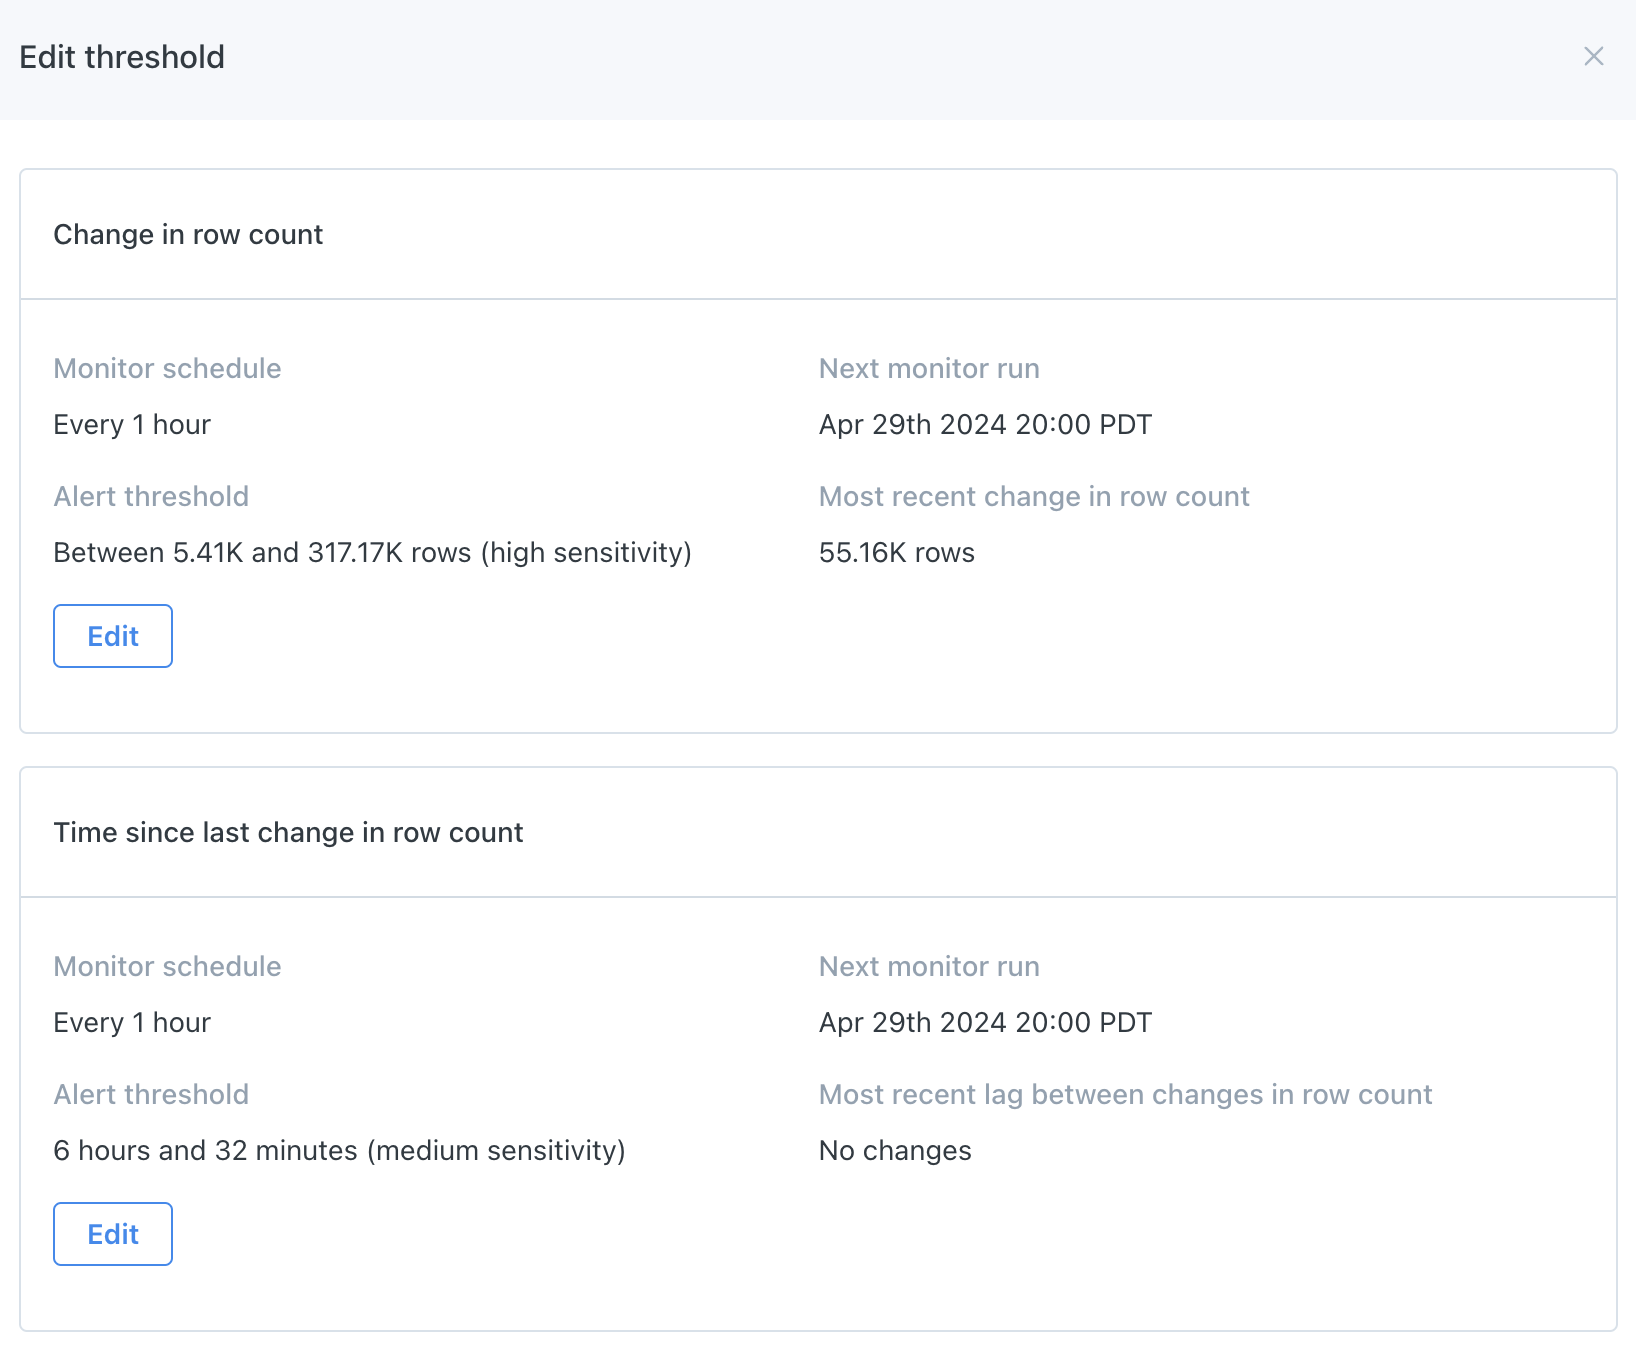
Click Edit threshold to adjust the alert threshold:
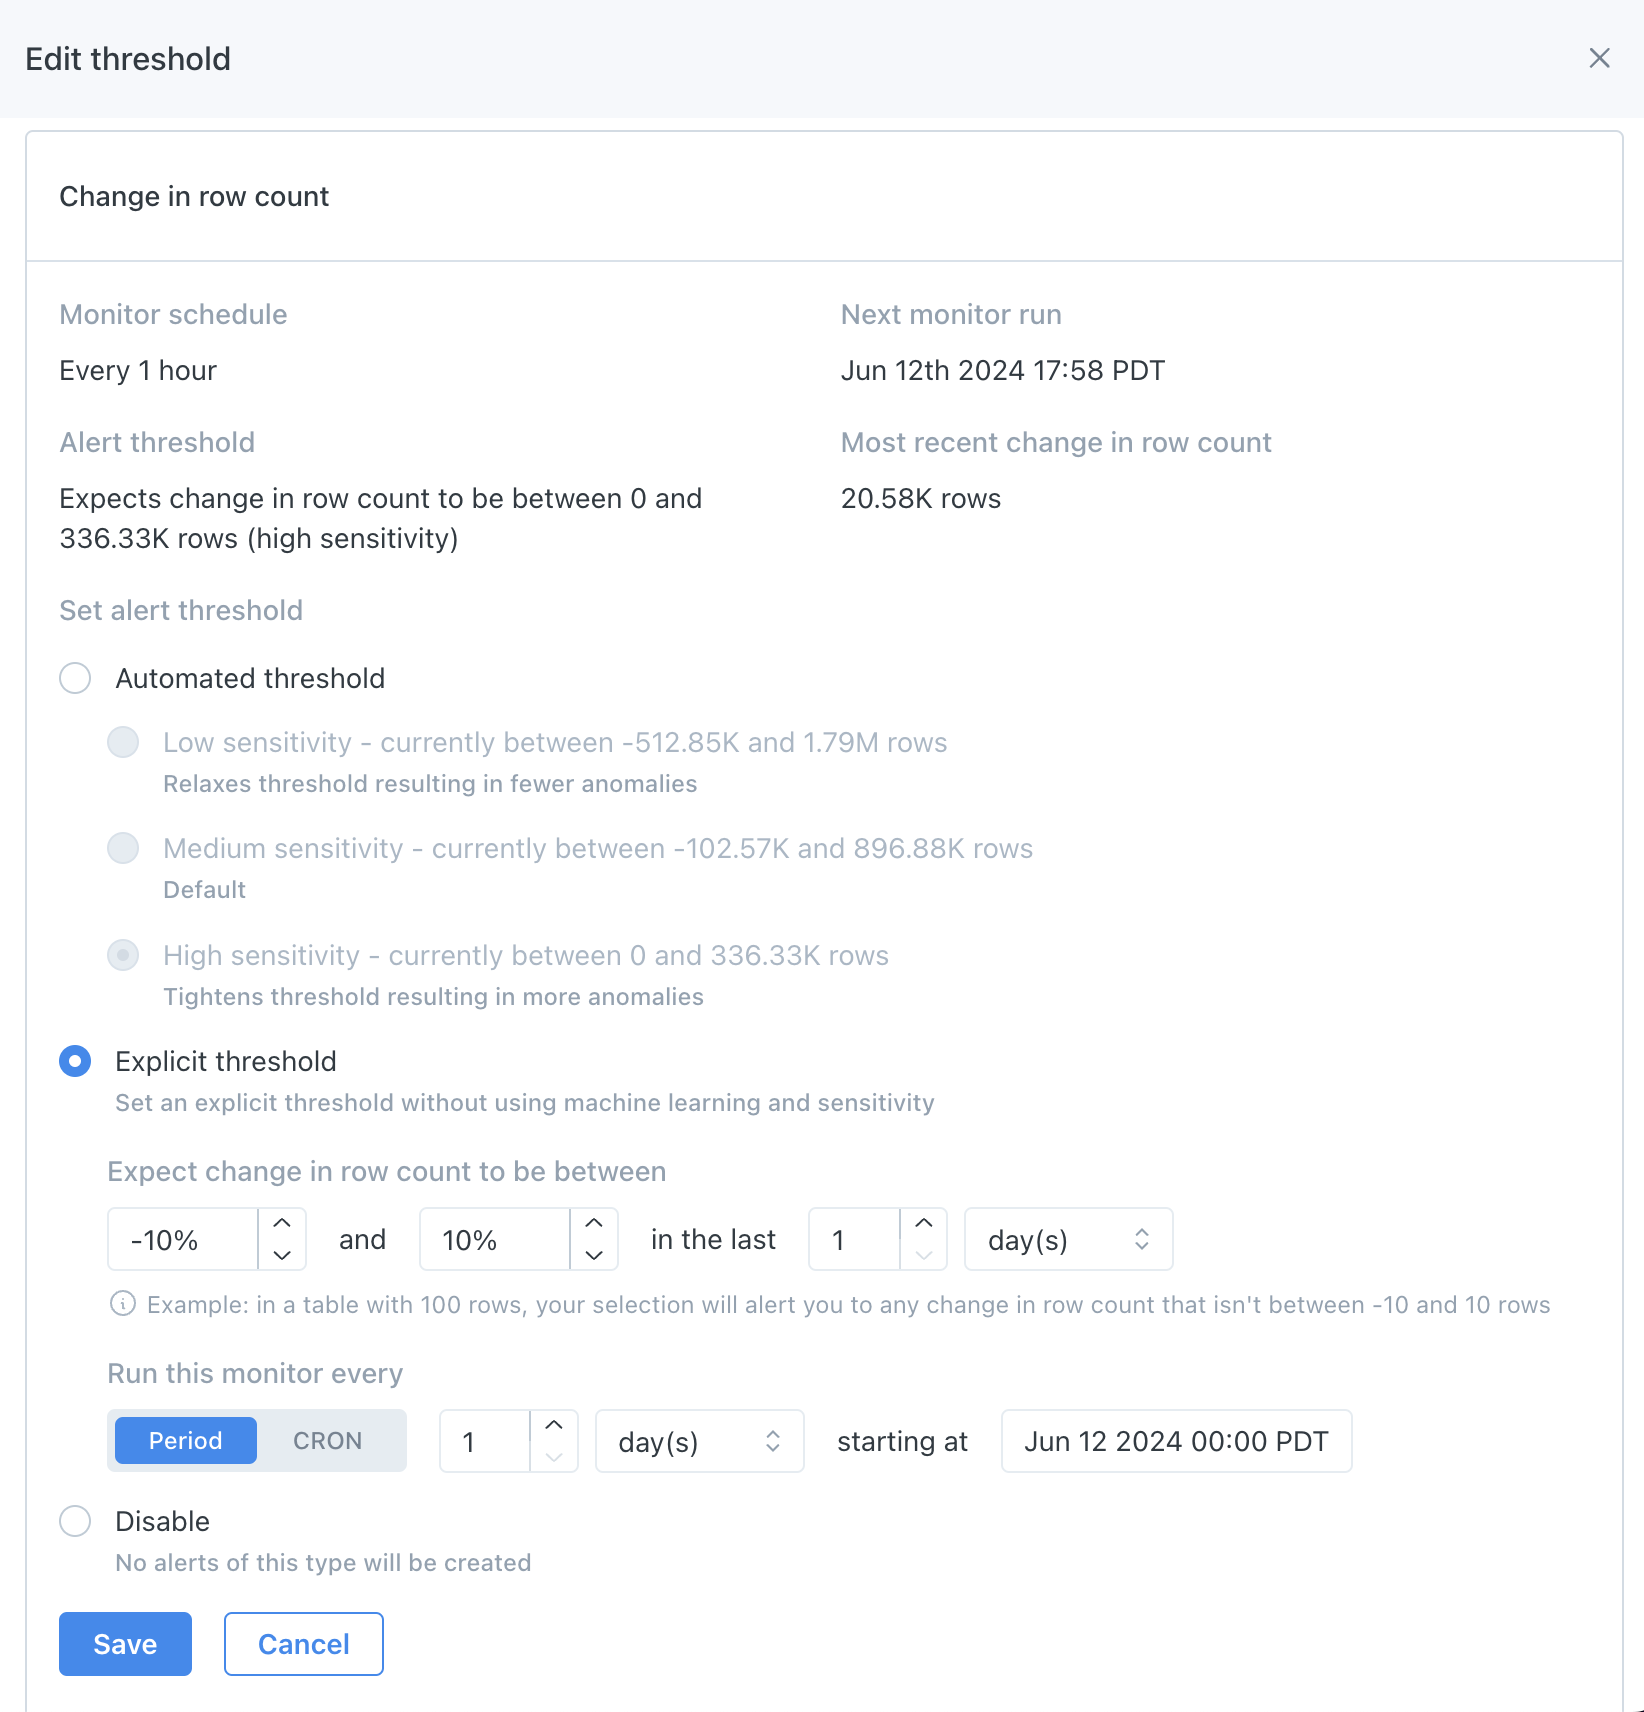
Users can select between automated or explicit (manual) thresholds, or choose to disable volume monitoring. For automated thresholds, users can select between low, medium, and high sensitivity.
For explicit thresholds, users must indicate an alert condition and how often the check should run.
Notifications
For purposes of routing notifications, the alerts from Volume monitors are volume anomalies, of which there are three subcategories:
- Size increase and size decrease: these are generated by the Change in row count monitor
- Unchanged size: these are generated by the Time since last change in row count monitor
To configure notifications for volume anomalies:
- Go to Settings > Notifications
- Create or find the audience you'd like to send notifications to, and click the (+) in the Other notifications column
- Under Alert types, select the desired alert types
- Filter for the desired data using the Affected data and Table importance sections
Updated 29 days ago