Query Performance
Transcript
Background: Query Performance Monitors allow you to measure the runtime performance a subset of queries across your warehouses. With these monitors you can accomplish use cases like:
- Getting alerted if any query from a warehouse/user/database has a runtime that is X% longer than normal
- Getting alerted if any query from a warehouse/user/database has a runtime that is longer than an absolute threshold
- Getting alerted if an important query failed
Let's go over a scenario of how to take advantage of Performance Monitors at Monte Carlo: Let's say that I'm interested in the loading warehouse and all queries run by the Airflow Loader user, and I want to make sure that I'm notified if there are any query runs that are running longer than expected. I can achieve this by going to the Create Monitor button , and will immediately be kicked into the query performance monitor flow.
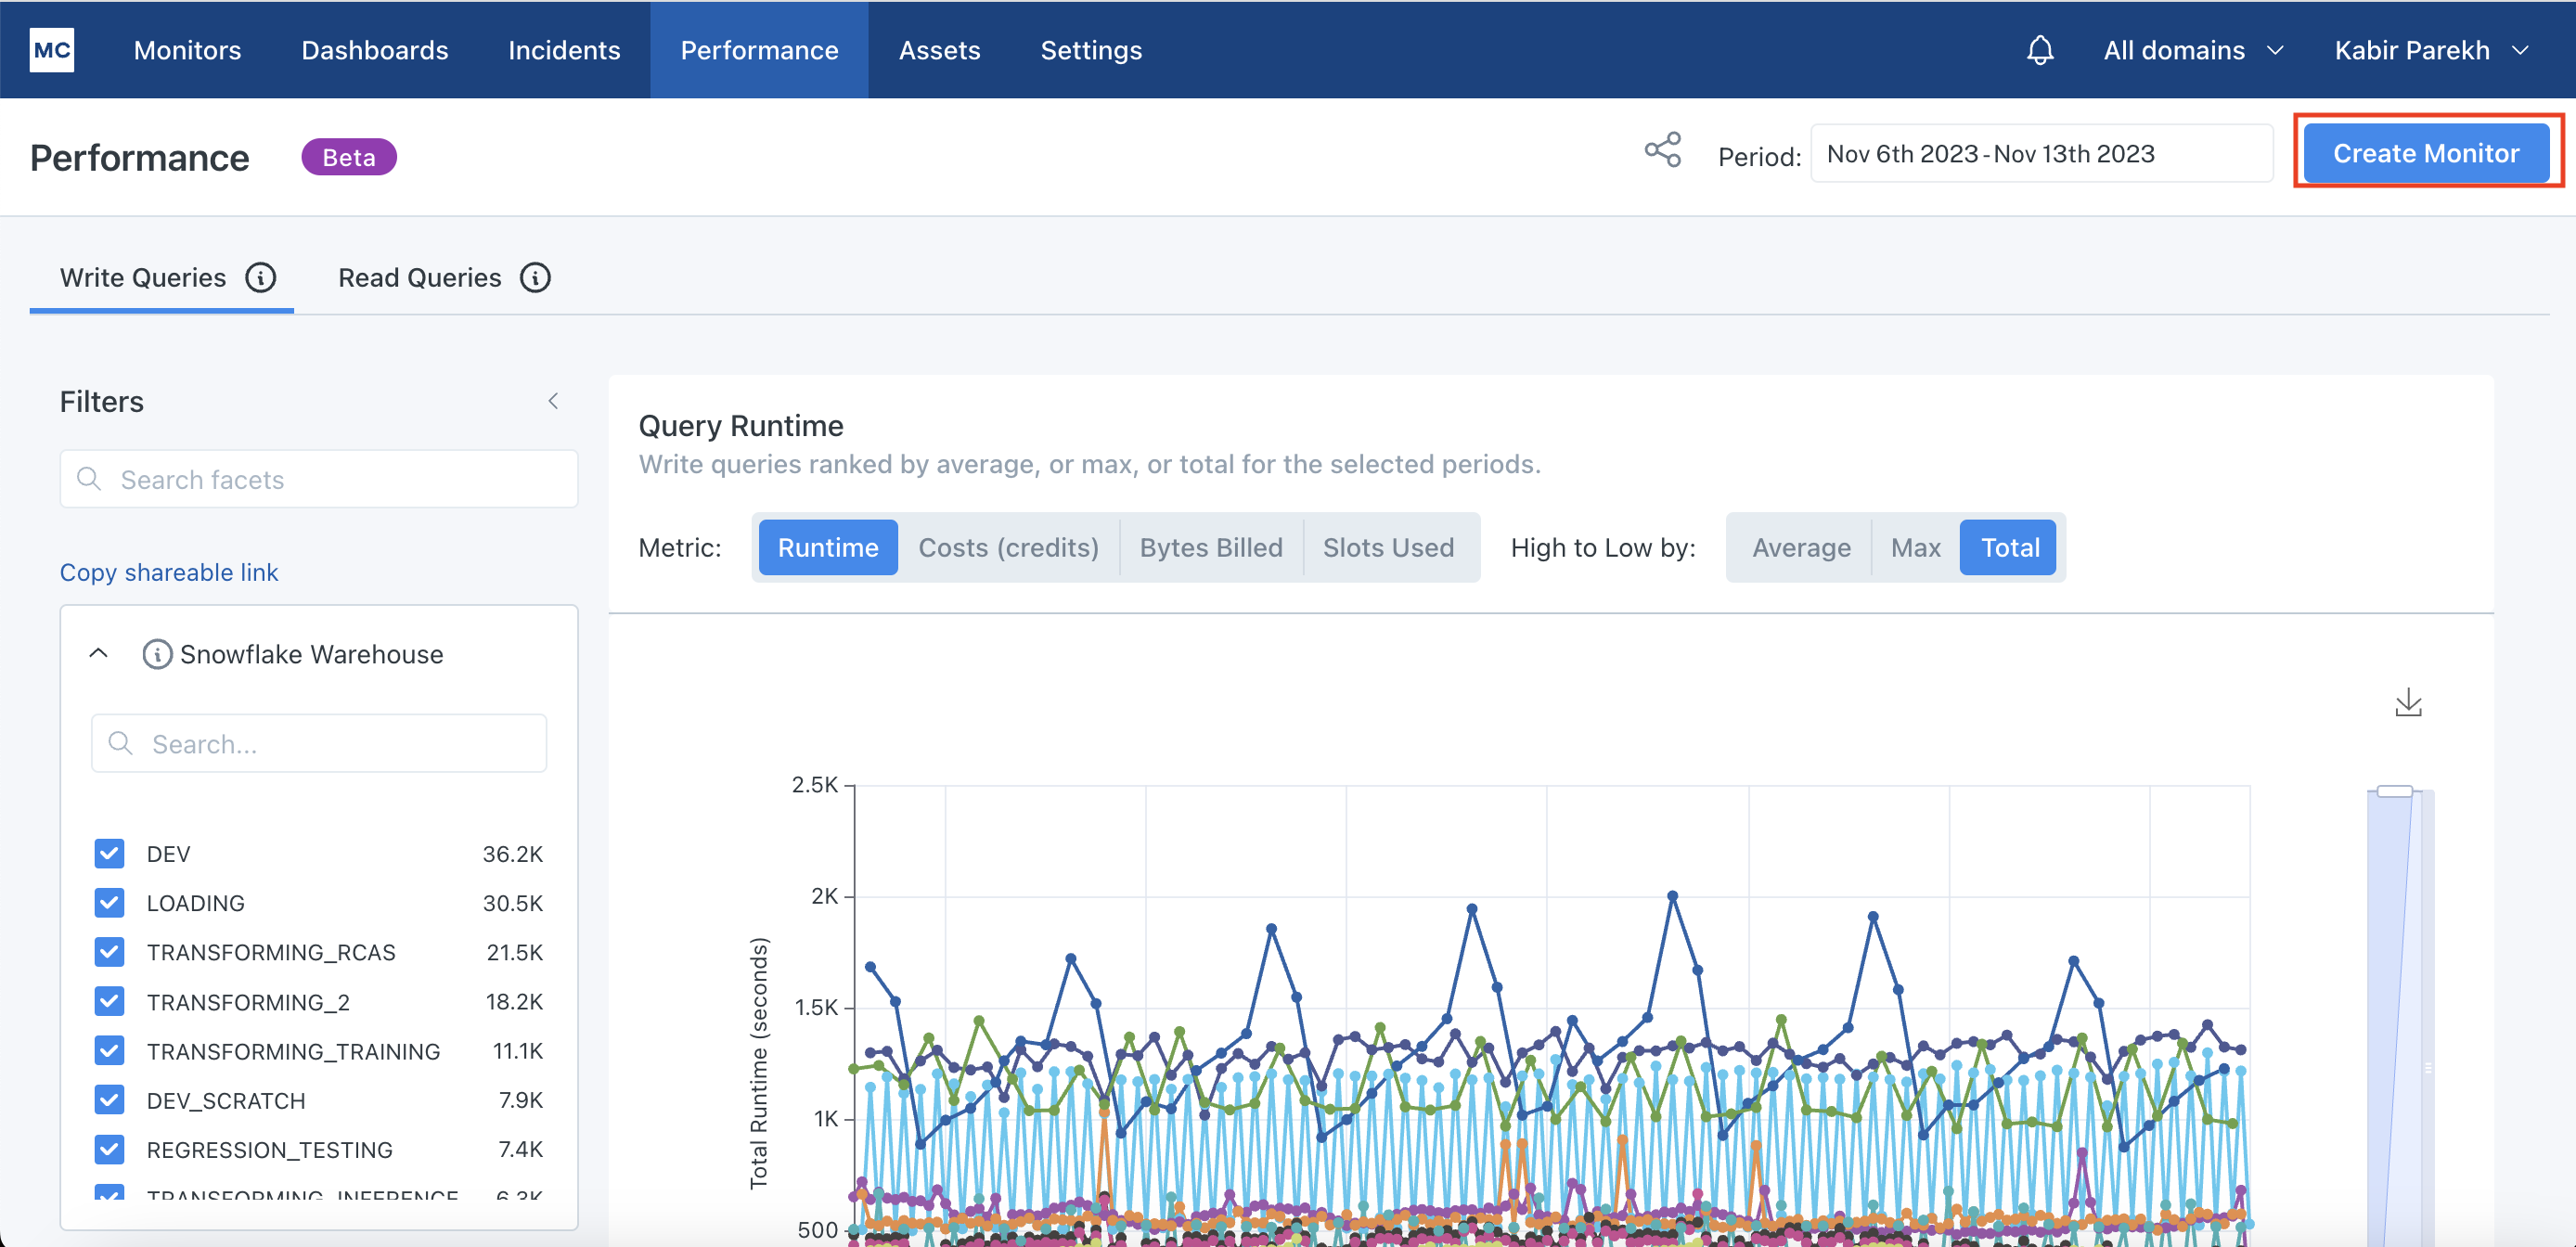
This can also be done on the Monitor tab, but this is just how it would look if you're on the dashboard. We can see that once we click in here, the filters are actually reflecting the filter choices that we made in the performance dashboard.
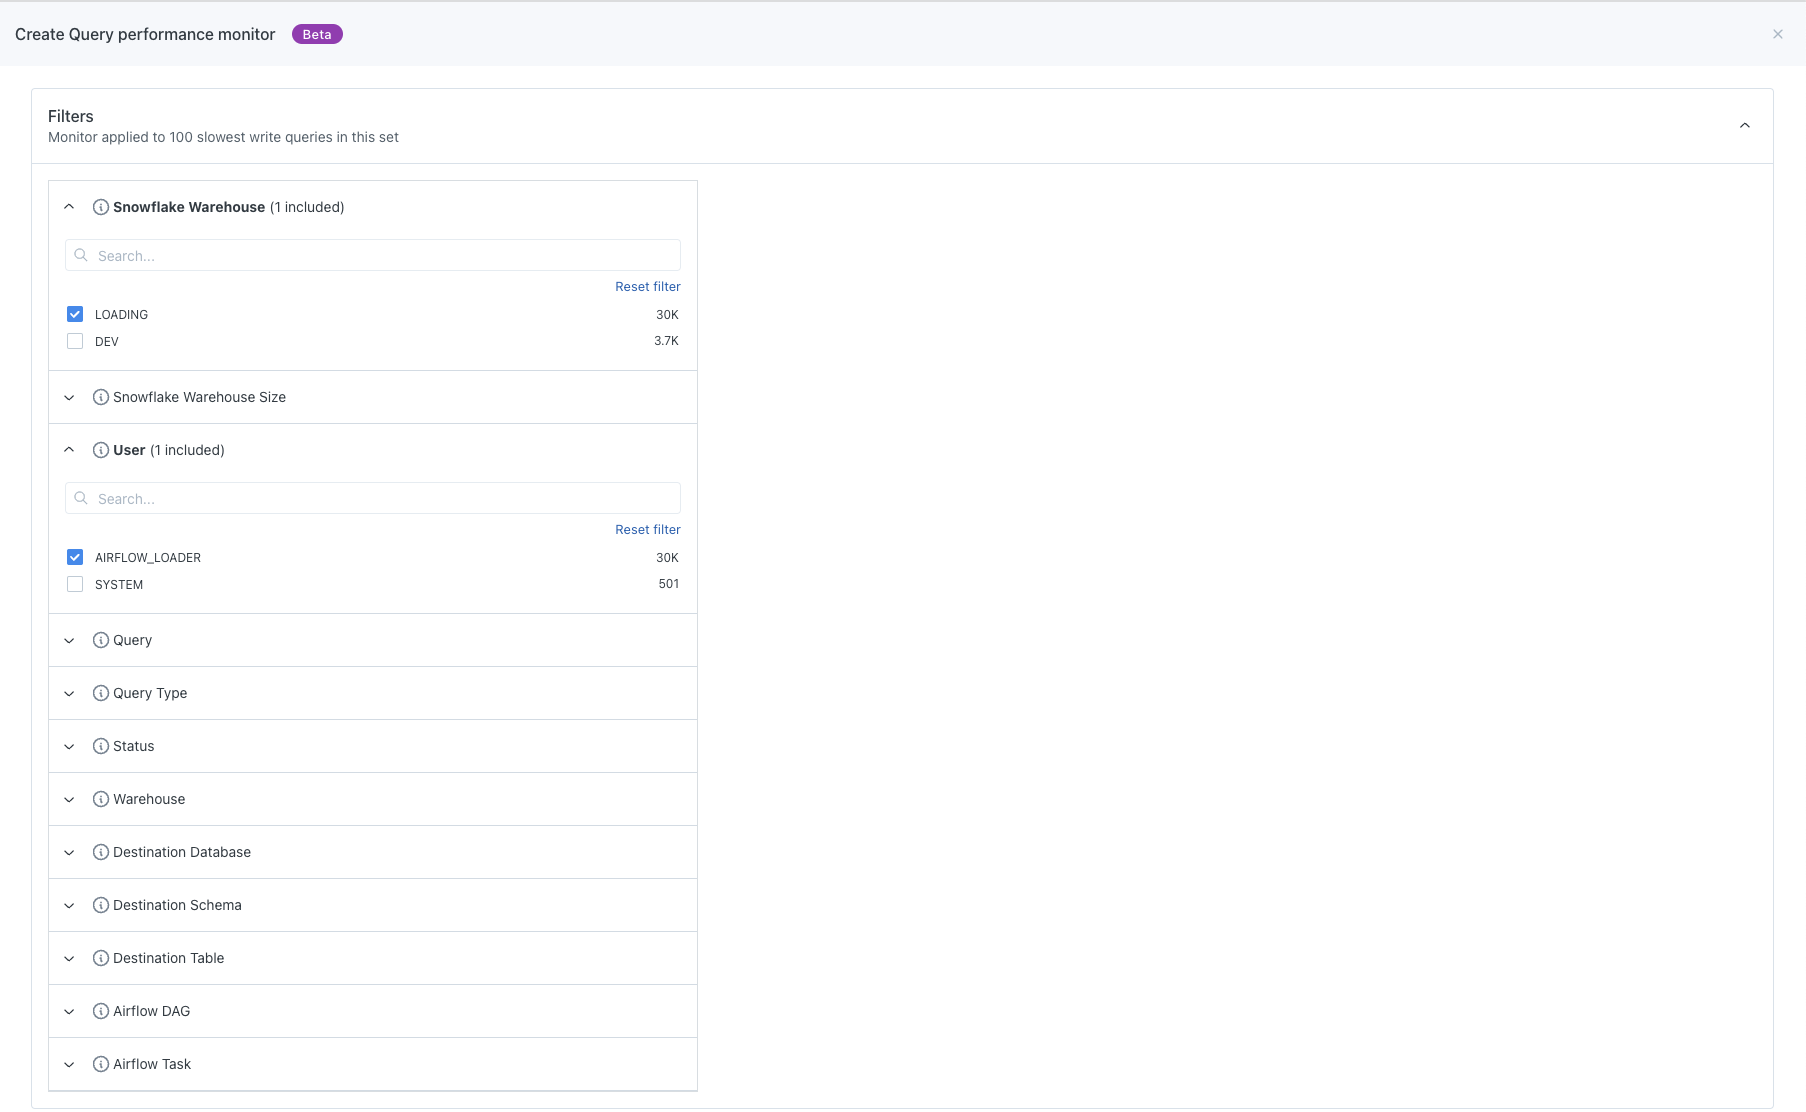
What this also means is that you can get as granular as up to the individual query level or as general as every single query that is running across all of your warehouses. It just depends on what you would like!
Once we're satisfied with the filters, we can then go down and define the alert condition.
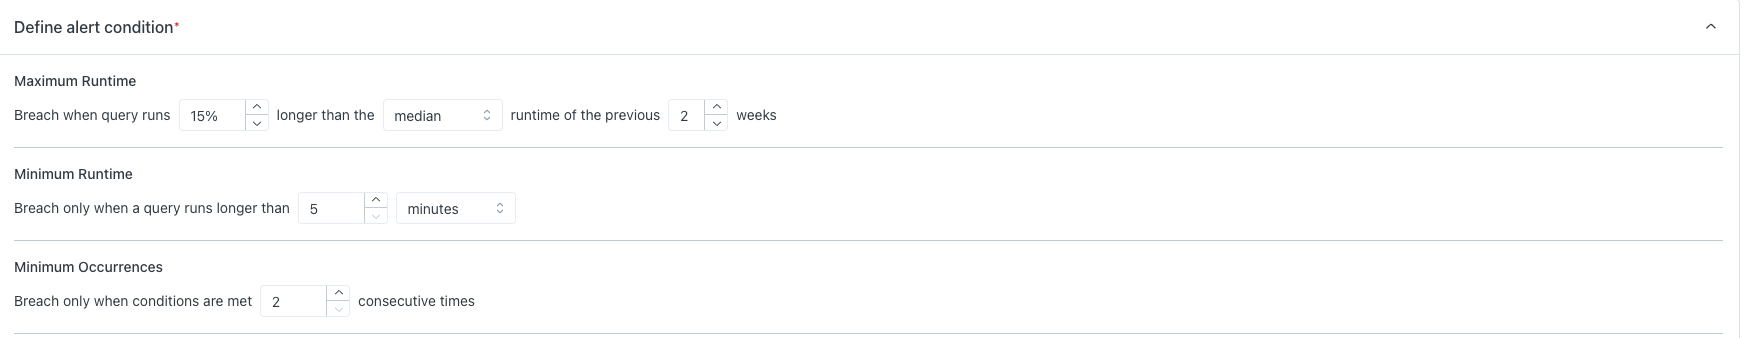
Here, the Maximum Runtime defaults to 200% longer than the median of the previous two weeks. Let's say that I know that the run times for the airflow loading user are relatively stable so I can have something a bit more strict and change the 200% to 15%. Now let's move on to Minimum Runtime. This will breach if the query runs longer than five minutes. Many problematic queries run at least as long as this so that's fine with me and we can continue.
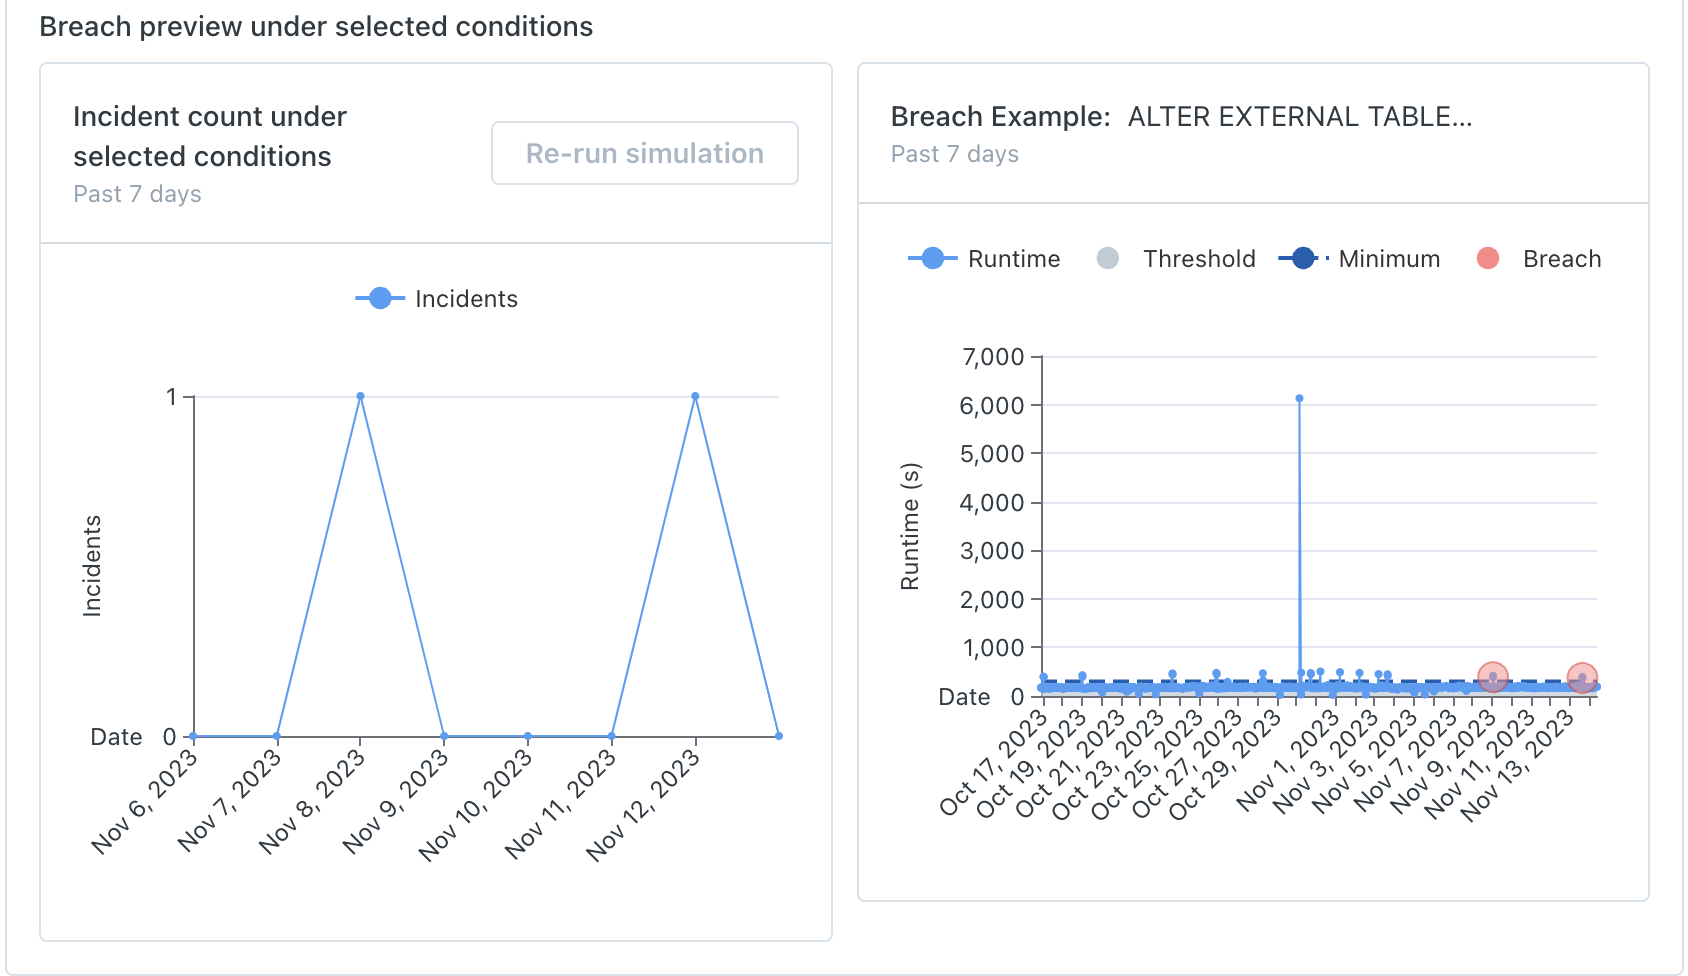
Finally, we can look at the Minimum Occurrences which measures when the monitor will breach if the conditions above are breached three consecutive times as a default. Maybe we don't need that much, so we can go down to two times because we don't care about the noise. But we might not be sure. So to test these alert conditions on this specific filter group we can run a simulation on this monitor.
When run, the simulation goes through the previous seven days of your data and will return the number of incidents that would be associated with this monitor if it was actually created and run. Here we can see that there are two incidents that would have been caught, which is a good noise level for me so we can continue on.
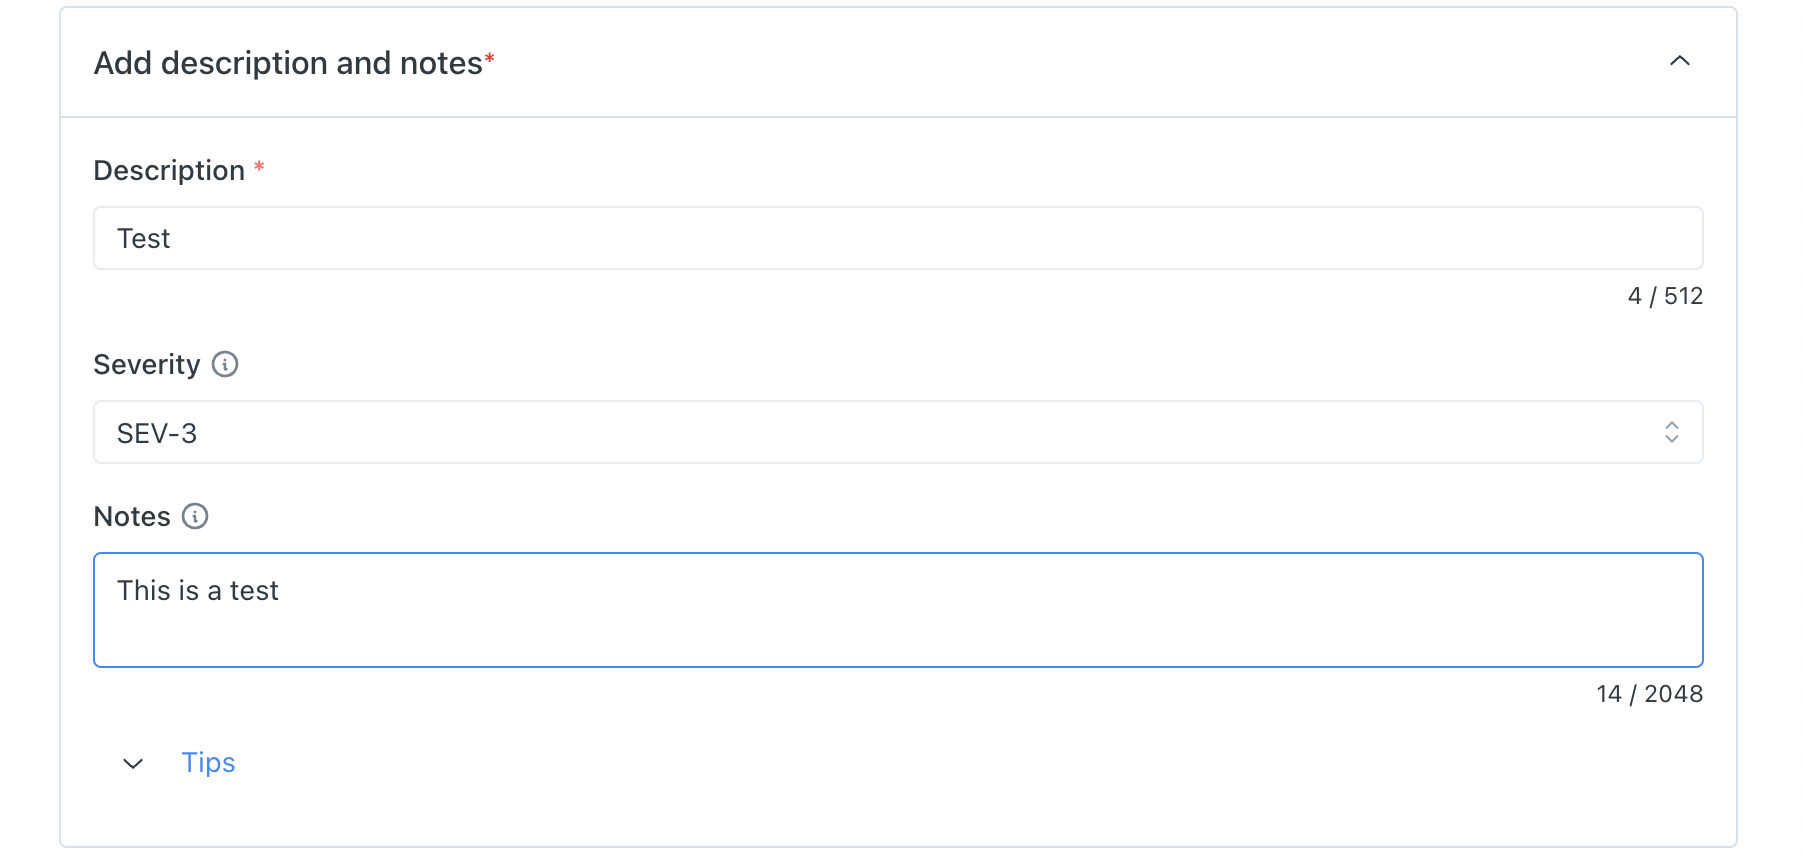
Then we can add a description as well a severity and any additional notes.
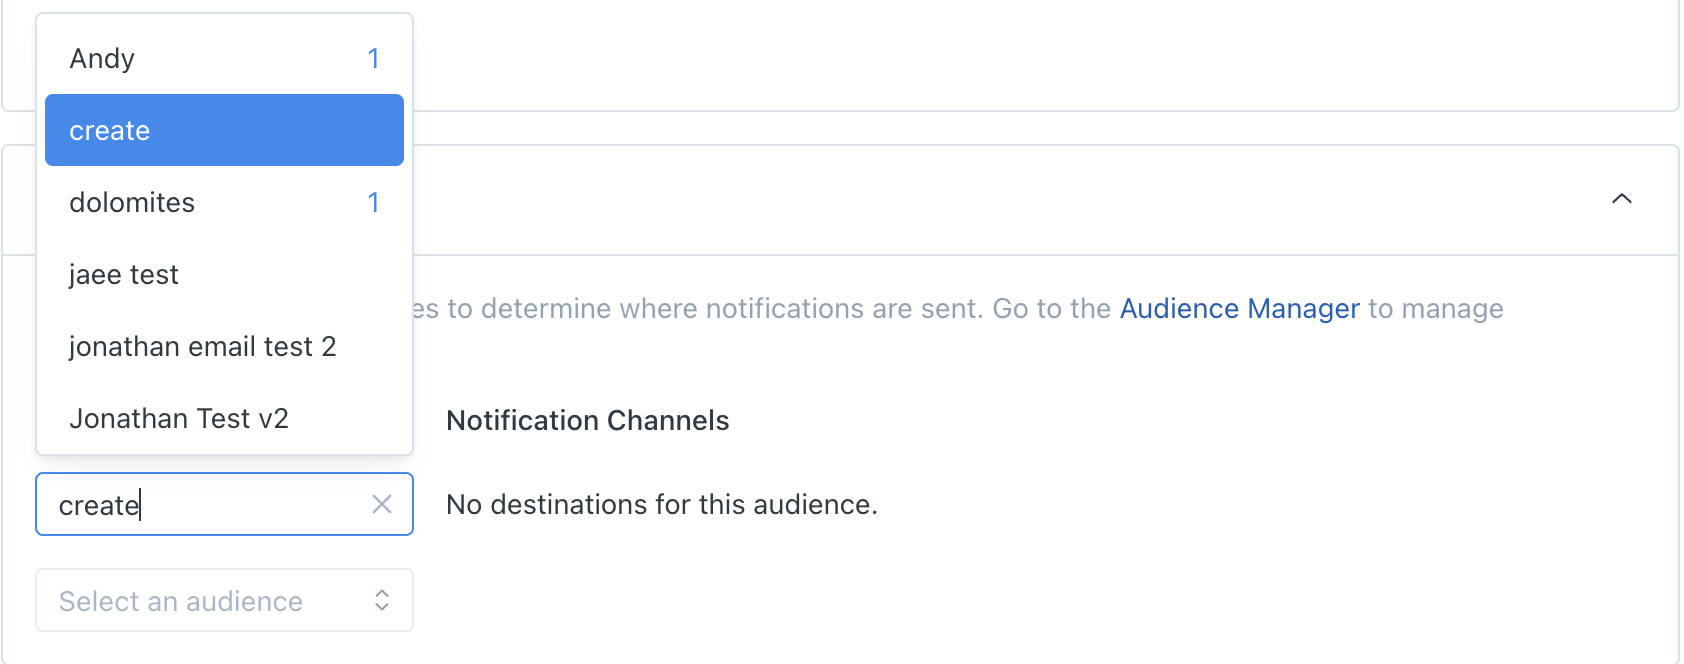
Lastly, we can select the Notifications Channels and the Audiences that should get notified for this specific monitor.
Here we can see in the drop-down menu that any of the numbers shows the number of notification channels associated with this monitor. So let's just say I care about create. Now we're done and we can go and create the actual monitor!
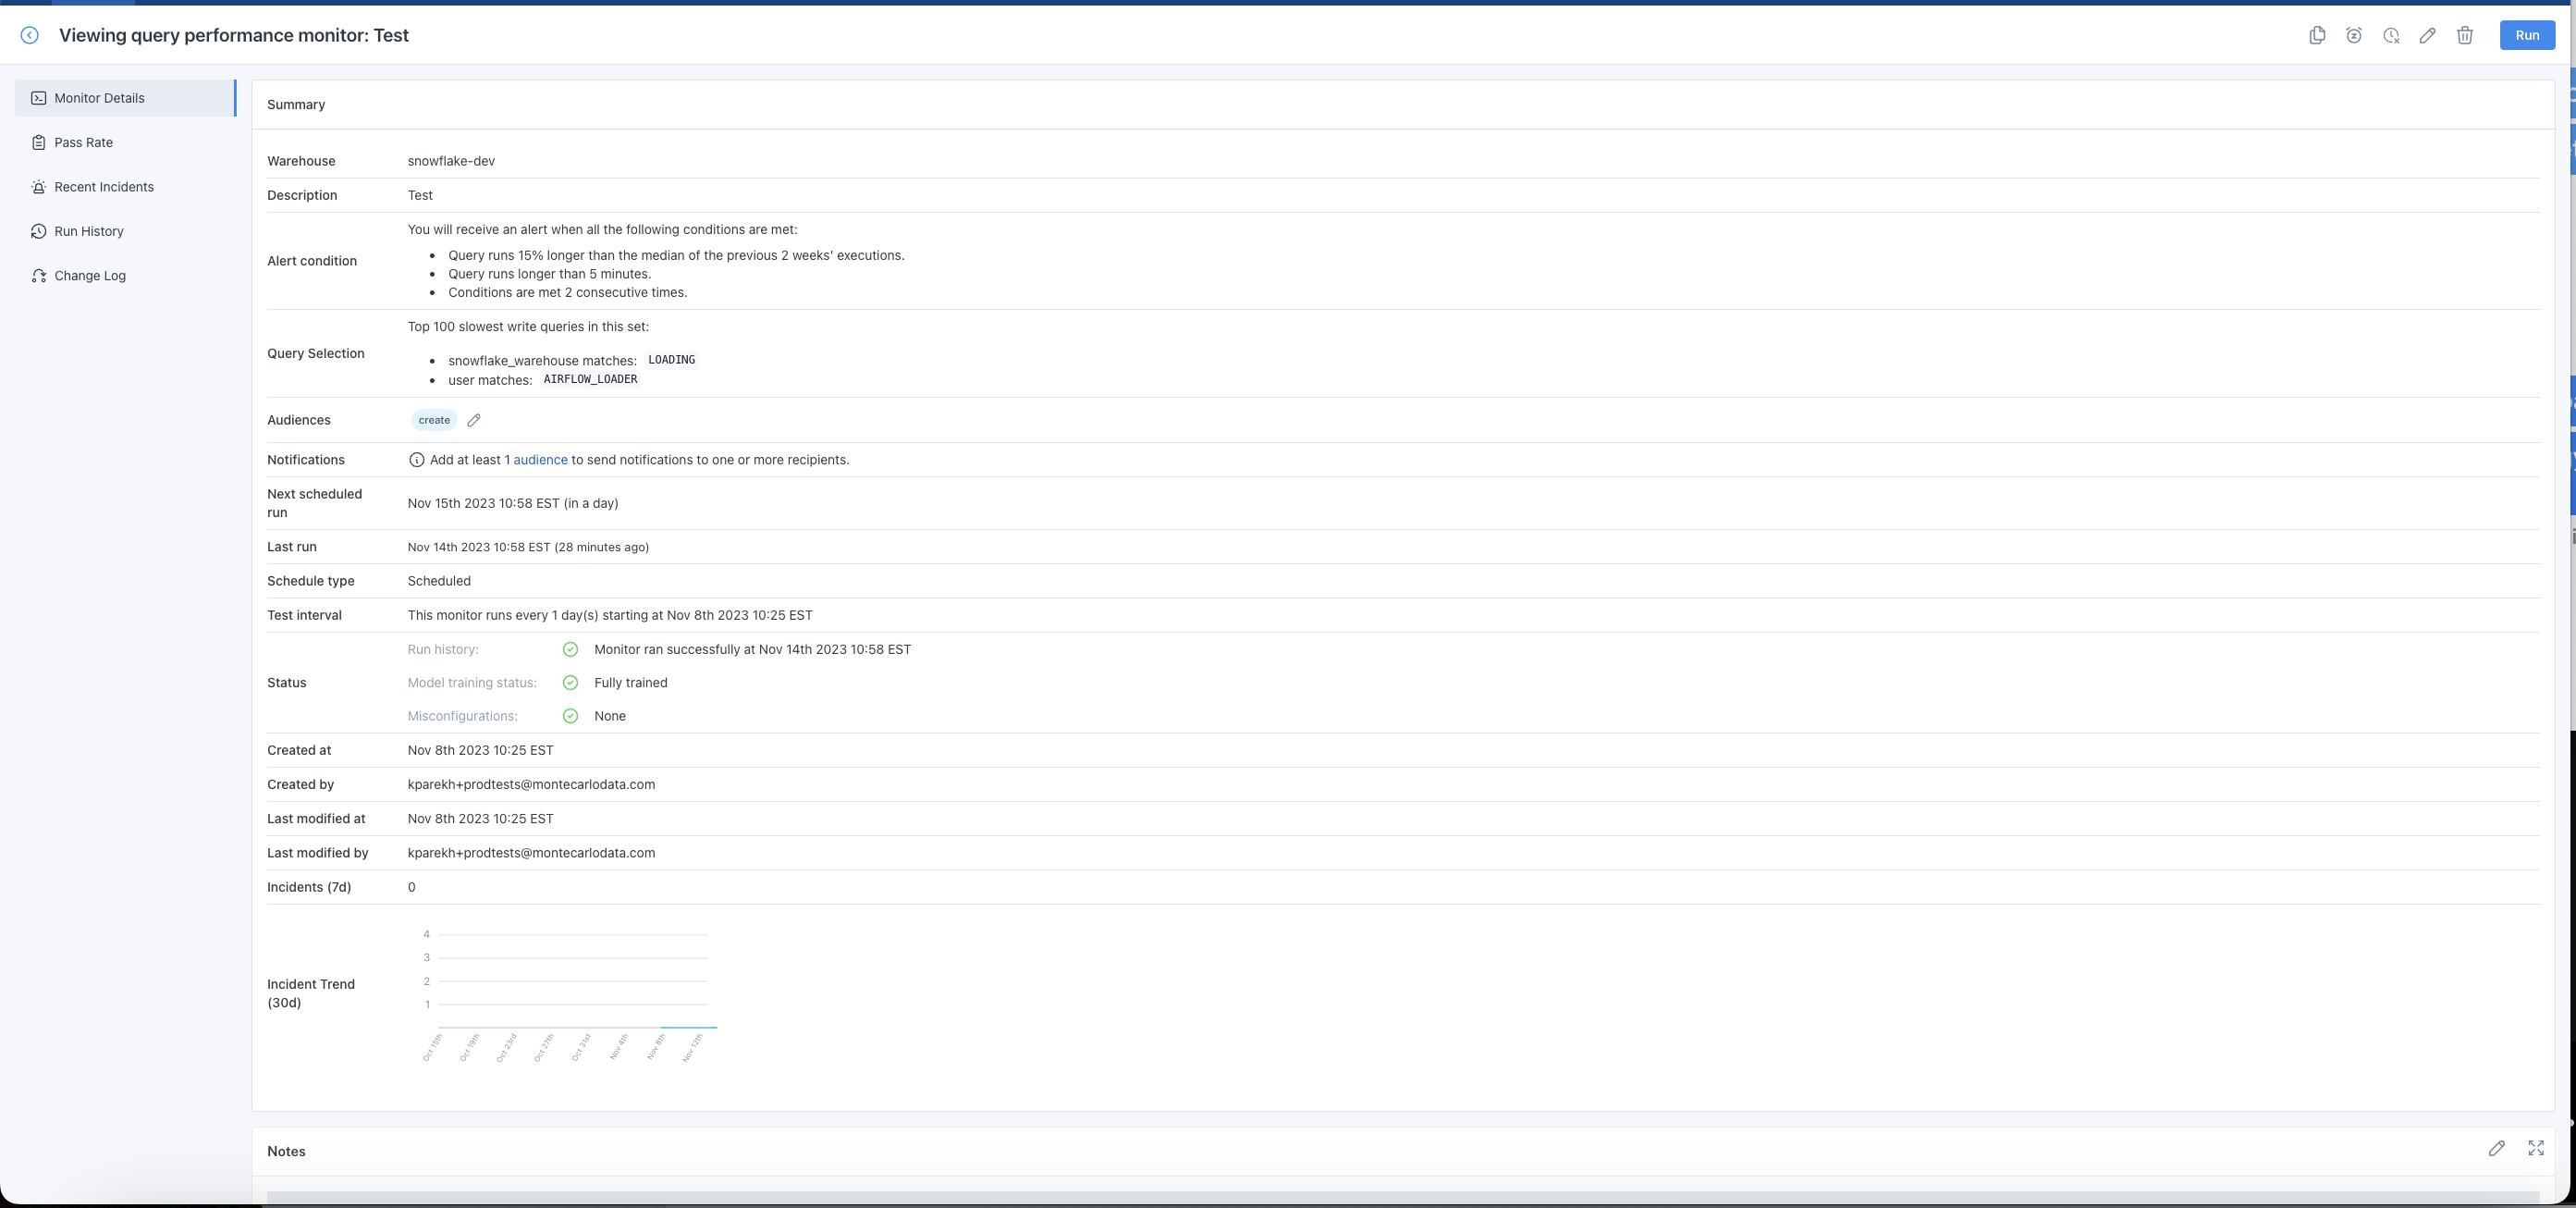
We can then go to the Monitor page to check out the monitor in more detail. Once we're here, we can see the summary of the specifications that we can do. We can also see the Pass Rate, Recent Incidents, Run History, as well as the Changelog for the monitor. All incidents surfaced here are Performance-specific incidents and if you were to click into these, you would be redirected to the IIQ and you can triage them from there.
I hope this was helpful and that you get good use out of Performance Monitors!
Updated 25 days ago