Locally setting up Monitors as Code
This tutorial will go over the steps to locally set up Monitors as Code. Monitors as Code is a great way codify monitors at scale without needing to go into the Monte Carlo UI.
Transcript
In this example, I'll be leveraging dbt, and I'll also be making the assumption that you've downloaded our CLI. If you have not, please see here: Using the CLI
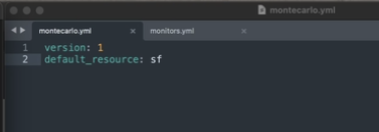
The first step here will be to create a montecarlo.yaml file, in which you'll want to pass through version as 1. For most of you that will be sufficient; if you do have multiple data warehouses set up within Monte Carlo, you will also want to add this default_resource in which you can explicitly define which data warehouse you are using for these monitors. Secondarily, you'll want to set up a yaml file for these monitors. In this specific case, I've created the monitors.yaml file in which I'm defining both a Field Health as well as a Metric monitor:

Example montecarlo.yaml file
Opt In MonitorsRead more about monitors here: [Monitors Overview] (doc:overview-1)
Alternatively, you can also embed these monitors within your dbt schema.yaml file. For more details on what that looks like as opposed to this example, you can go to the "Defining Individual Monitors" section within our Monitors as Code page within our documentation.
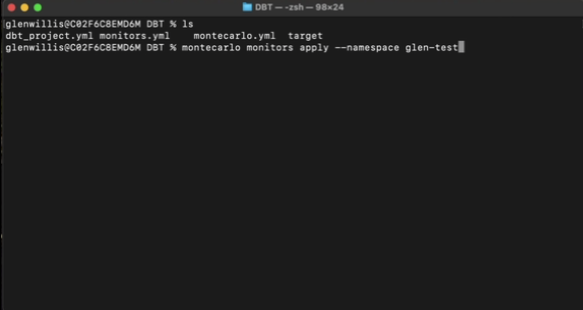
Once you have that set up, you'll first want to navigate to the location where you have your montecarlo.yaml file, as that is the project root; in this case, we can see that I have that here. And now to set these up, I will want to run the montecarlo monitors apply command. In this case, I am going to define this under a test namespace here so that we can see this within the UI. Now, one thing to note here is with these namespaces, this is a way of naming a grouping of monitors you are creating so that the system can synchronize changes between your local configuration and what's stored within the Monte Carlo database:

Applying the monitors
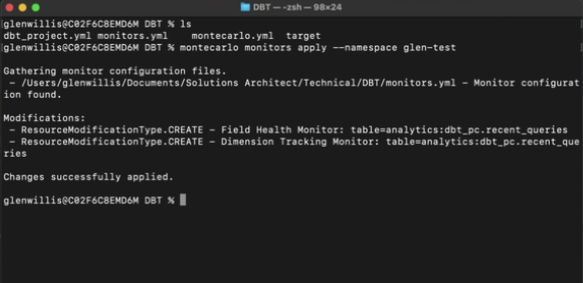
As I run this, we can see that it catches the Field Health monitor as well as the Metric monitor and these changes were successfully applied:

Successful output after applying monitors
Now if I go to the Monte Carlo environment and refresh the page, we'll be able to see those two monitors at the top of the list of customer monitors here. As you can see, the namespace matches, as well as the table, and the type of monitor:

Monitors as Code in the Monte Carlo UI
Now if I also wanted to remove these, I can do so leveraging the montecarlo monitors delete command, and I'll want to match the namespace so it knows what it should delete:

Deleting monitors
Now if I refresh my Monte Carlo UI, you'll be able to see that those no longer exist within the Monte Carlo environment:

Fresh Monte Carlo UI
Hopefully this was helpful, but please feel free to reach out to [email protected] or the chat bot in the lower right hand corner if you have any more questions!
FAQs
Question: I am getting an error when trying to set up hundreds of monitors, how can I fix this?
Answer: Currently, we support up to 2000 resources per namespace. Please make sure your CLI is up to date (at least version 0.52.0) to take advantage of this. Older CLI versions are limited to ~100 monitors per namespace.
Updated 10 months ago
