Data Products
Overview
Data Products in Monte Carlo are a way to organize and monitor the data assets that drive key business outcomes. By grouping related tables and reports together, you gain a holistic view of the monitoring coverage, health and reliability of your data, making it easier to ensure that your data pipelines are delivering accurate and trustworthy information.
Create a data product
TipWhen creating a Data Product, select the most downstream assets. These should be the last stop before the data is used by a client application or viewed by a user.
Once created, the Data Product will automatically include assets that are upstream via lineage to give you a complete picture of the overall health of your Data Product.
Start Tier customers are limited to 3 Data Products.
Navigate to the Data Products tab and click Create data product in the top right.
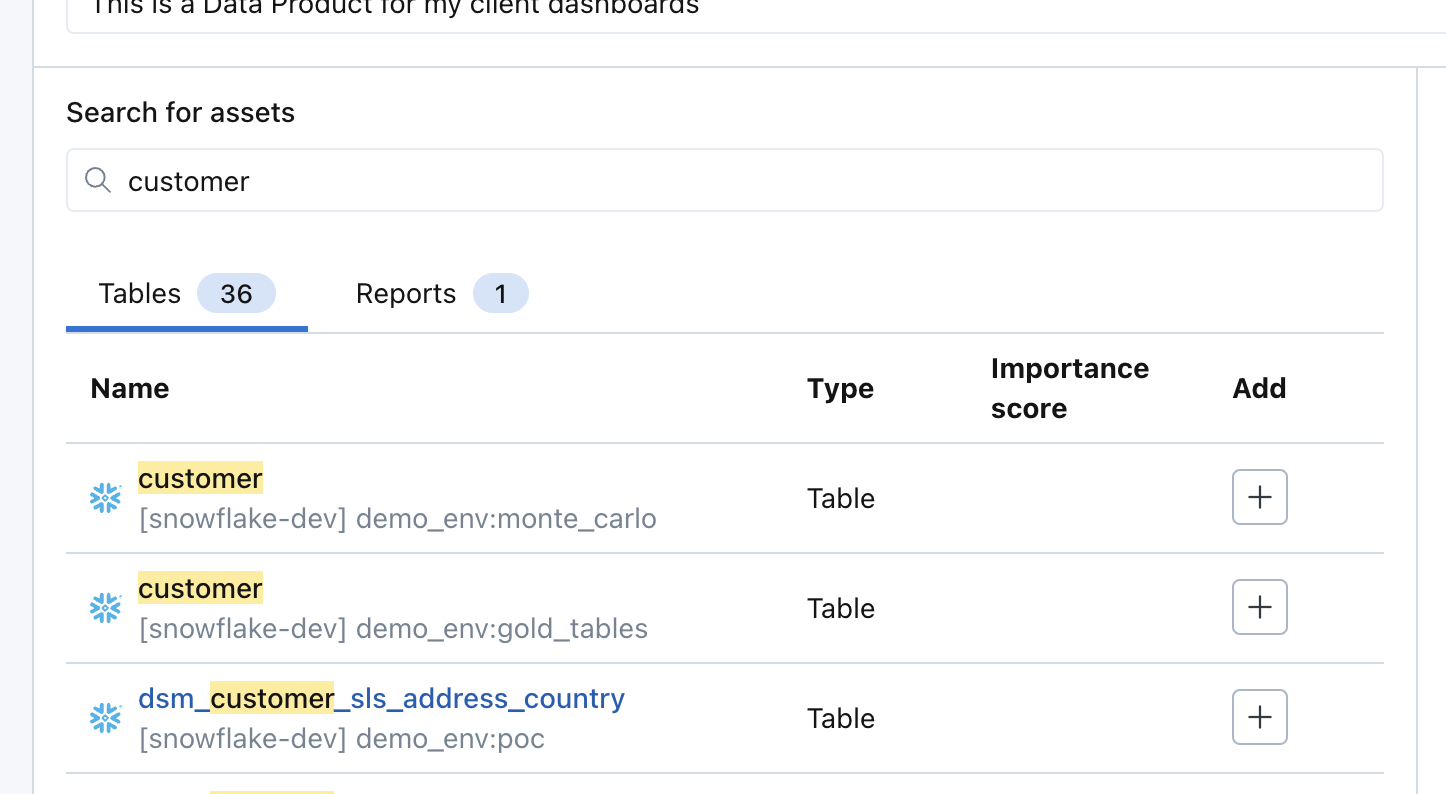
- Search for assets. Select the most downstream assets you would like to add to this Data Product. Table and Reports can be added. Click "+" under "Add" column to add them to the Data Product.
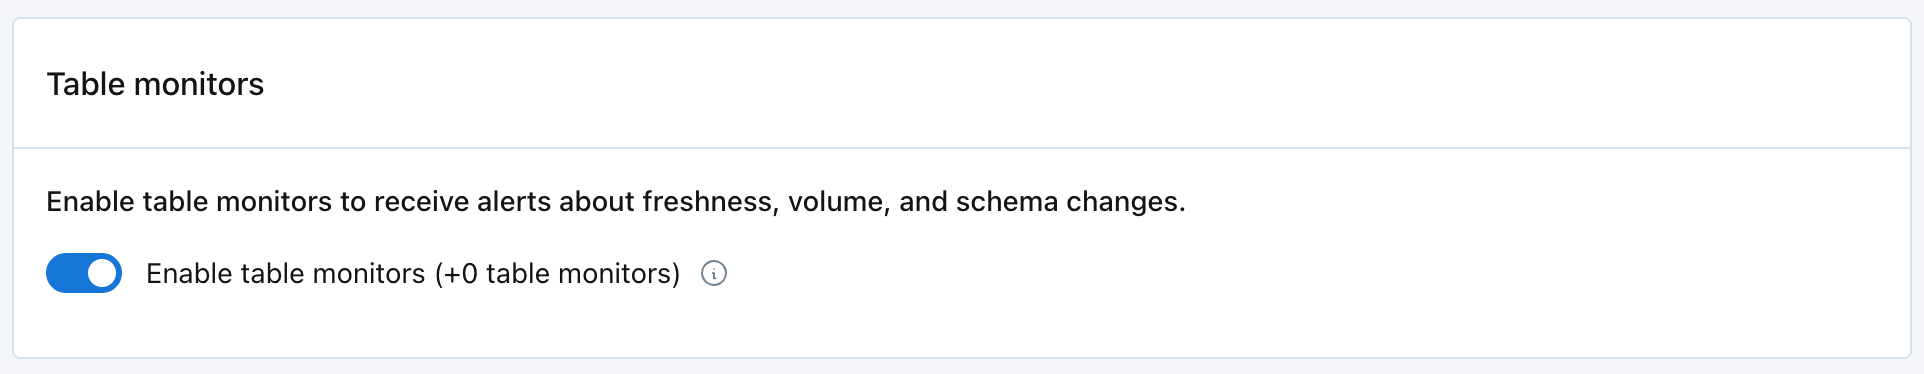
- Table monitors. You can choose to turn on Table Monitors (freshness, volume, and schema monitoring) for the tables included in the Data Product. This includes the assets selected above, as well as all assets upstream of them.
-
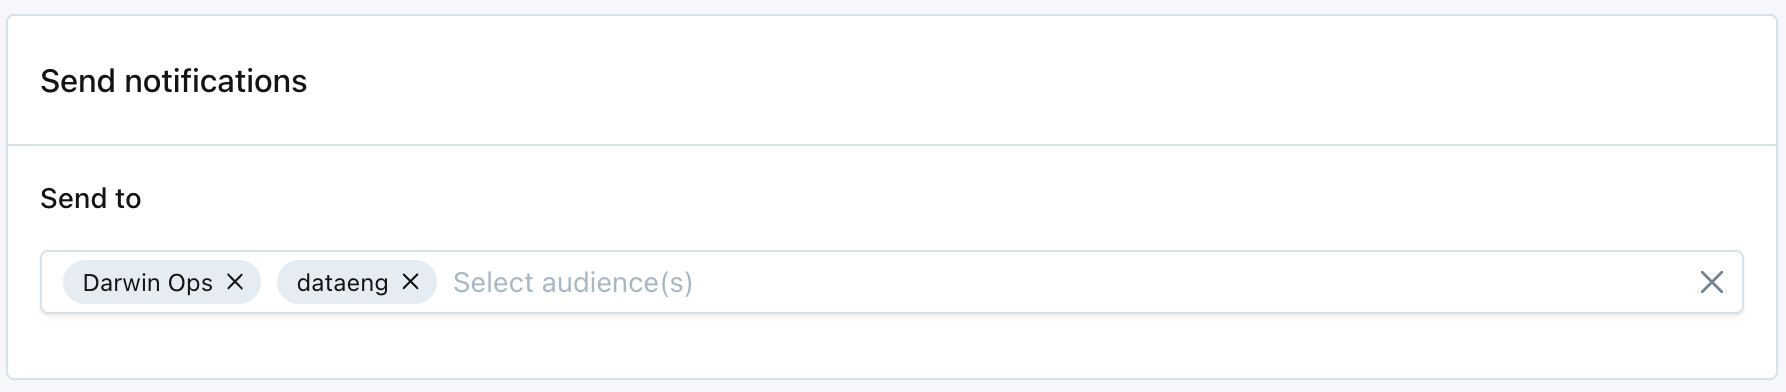
Send notifications. Select which audiences should receive alerts for the table monitors from Assets included in the Data Product.
-
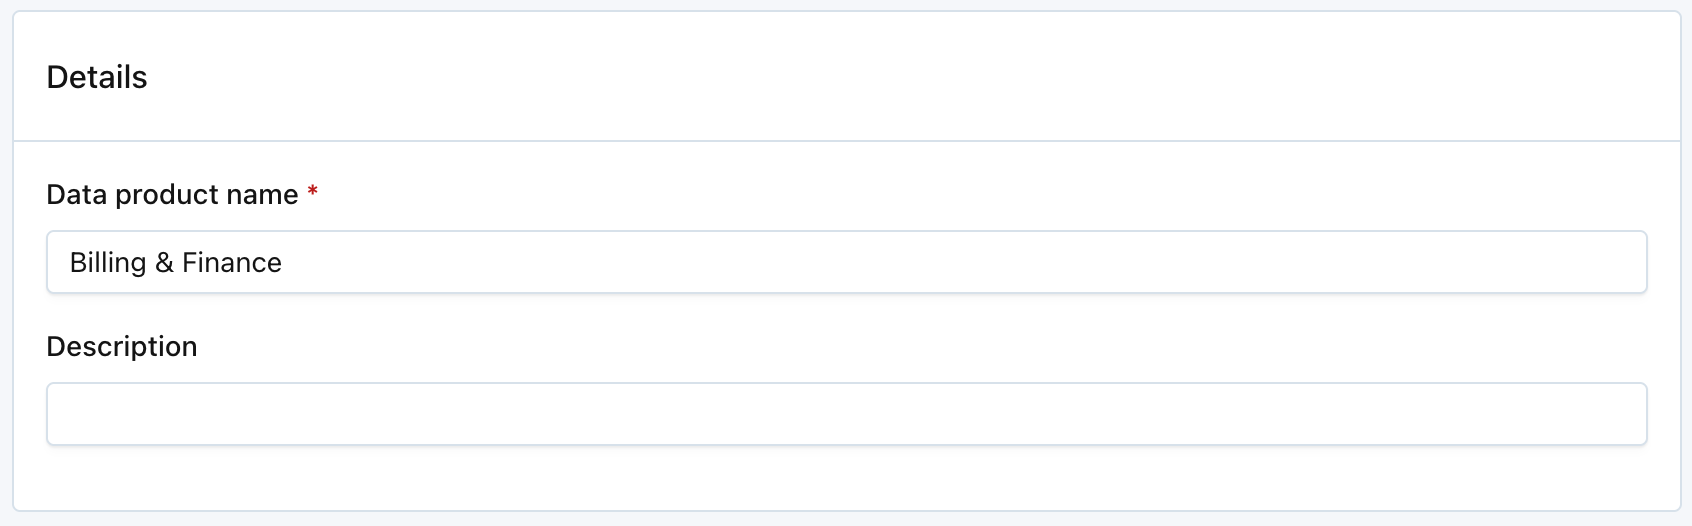
Details. Give the Data Product a name and a description.
-
Click
Create data product. Once a Data Product is created, all tables in the Data Product will be automatically tagged with a Table tag.
Coverage
The Coverage tab of Data Products shows all assets that are included in your Data Product and their current monitoring status.
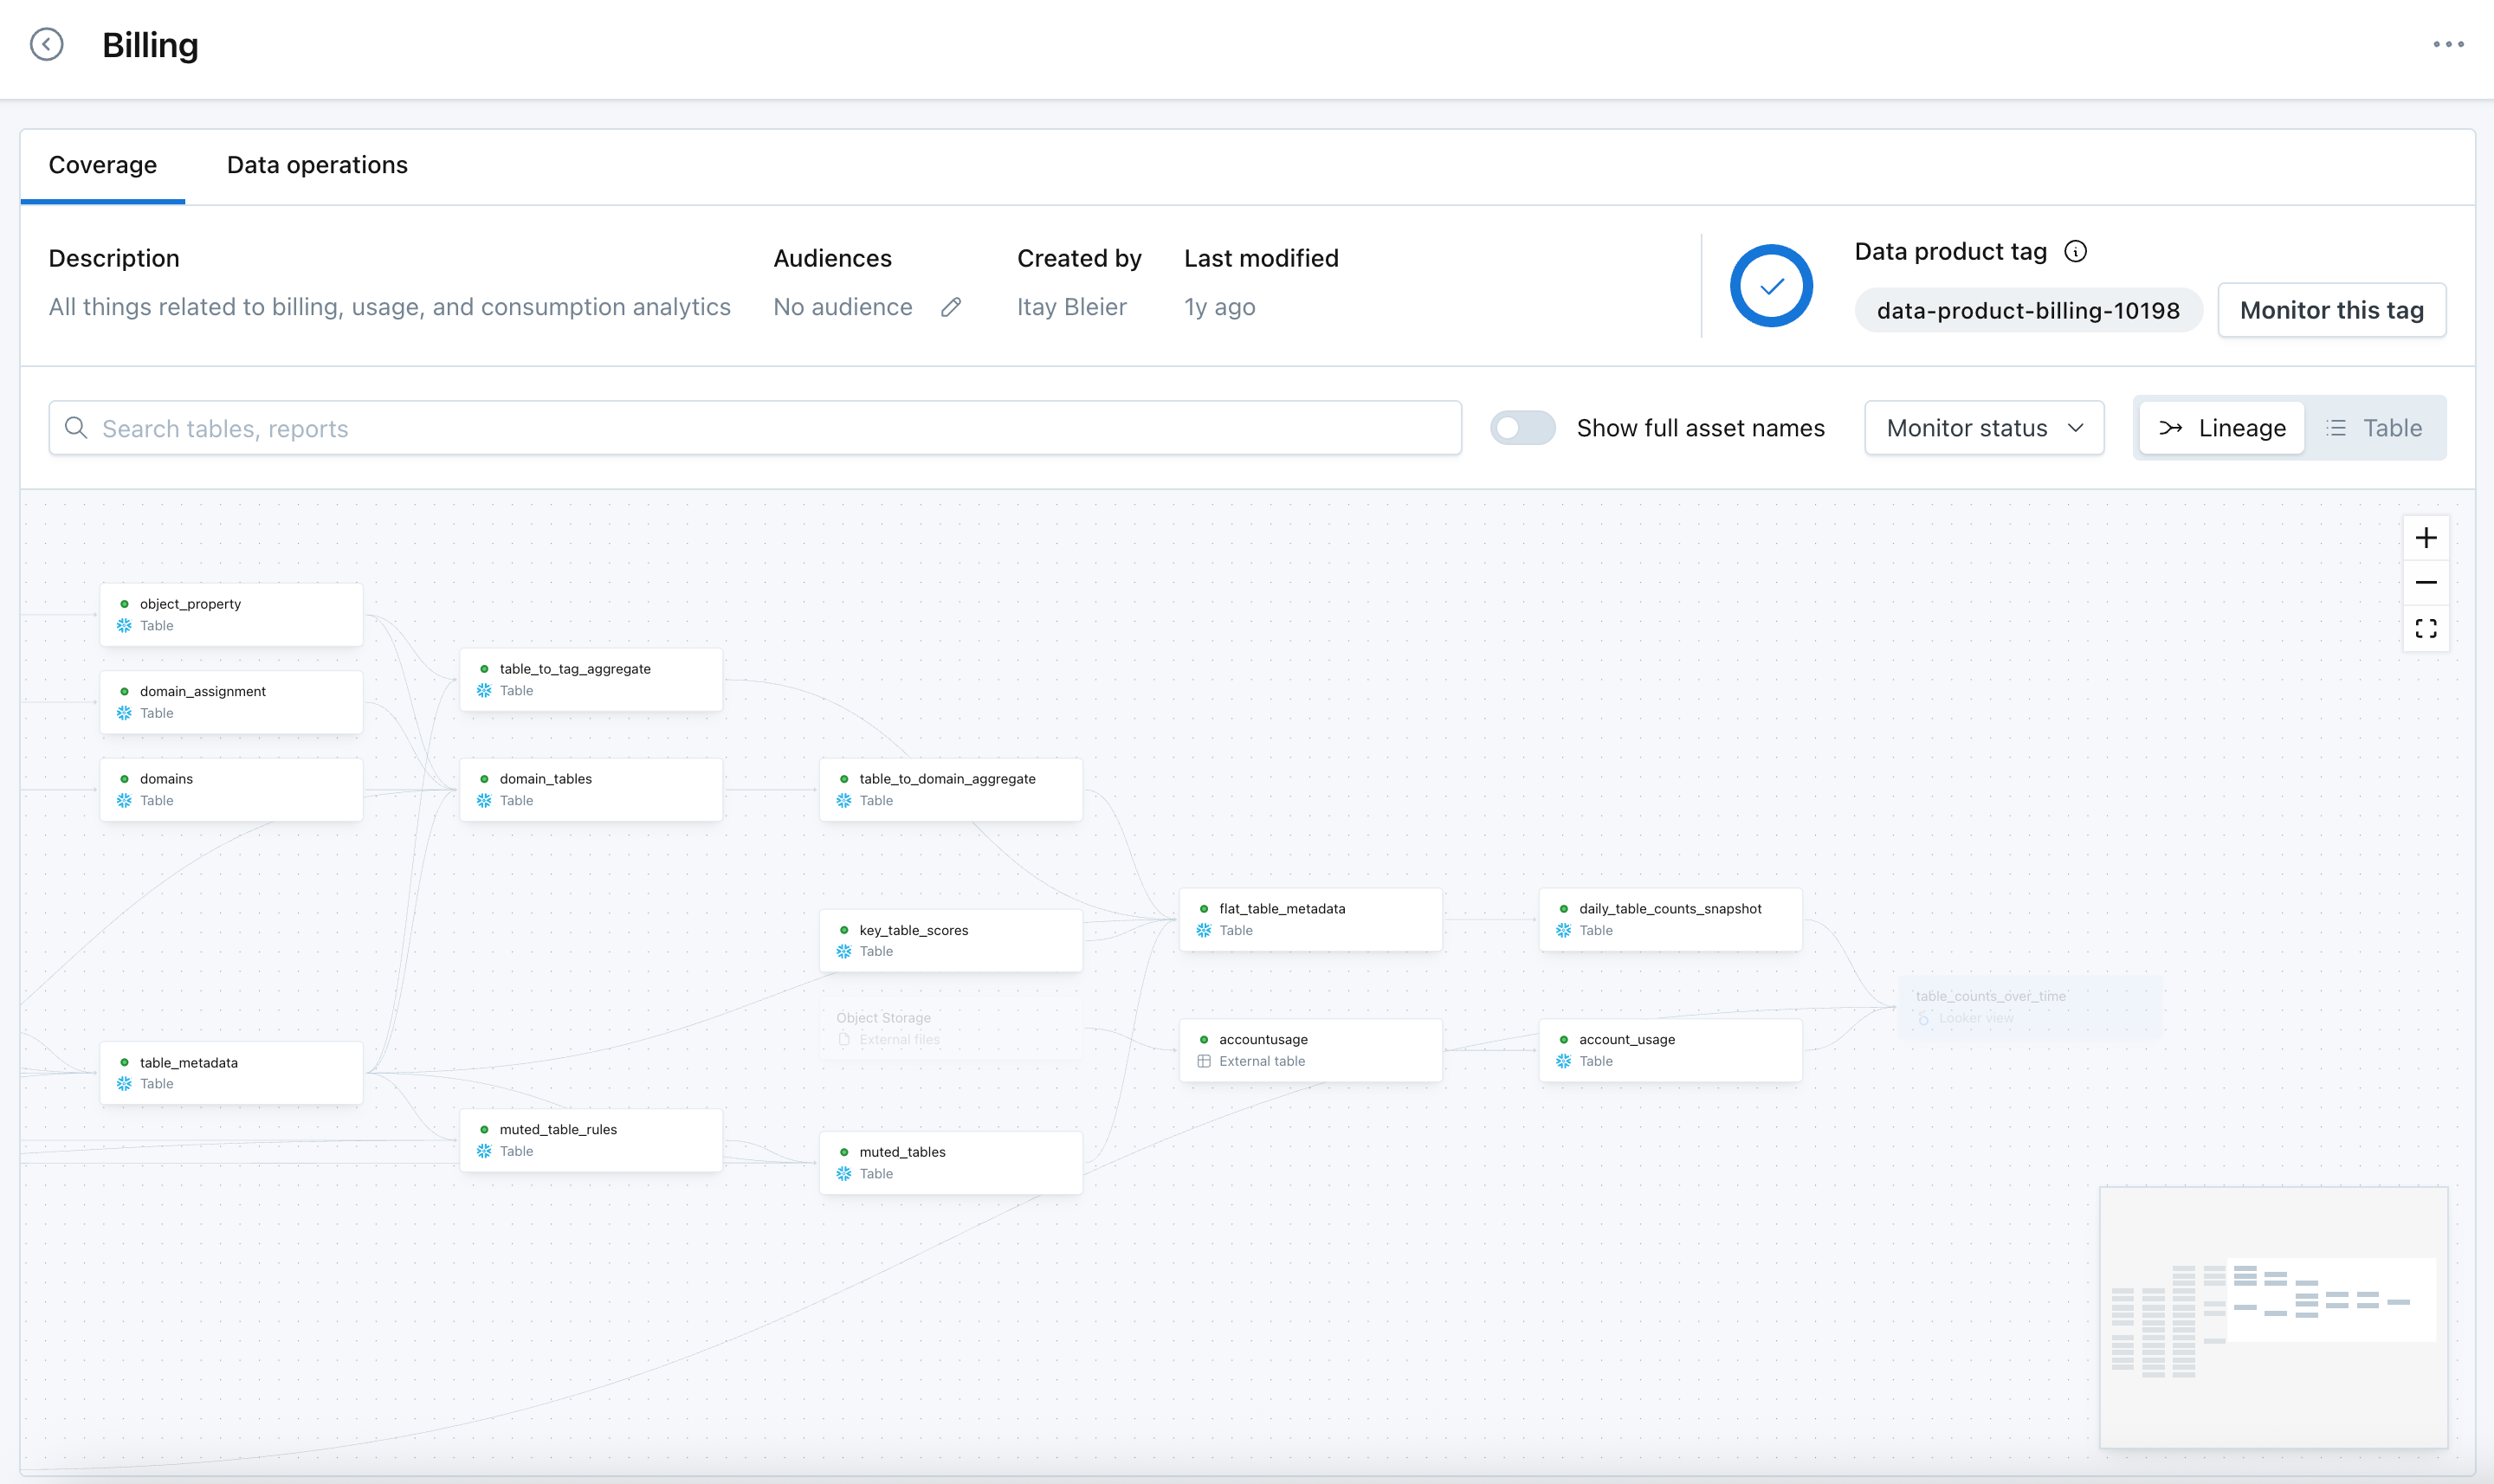
- The coverage chart at the top right provides a quick view on the percent of tables "Not monitored" out of the total tables that could be monitored in the Data Product. This excludes tables that are "Excluded" (through rules added in the Settings > Table Monitors) or tables that are "Not supported".
- The "Data product tag" is automatically generated by Monte Carlo and applied to all tables in the Data Product. When a new table becomes part of the data product lineage, Monte Carlo will automatically apply the same data product tag to it.
- Clicking "Monitor this tag" will add a rule in Settings > Table Monitors to monitor any tables with the "Data product tag" for this Data Product.
- The "Lineage" and "List" view to see the Data Product in different visual layouts
- The filters at the top to filter both of these views by the monitoring status of each of the tables included in the Data Product.
- Monitored - tables that are currently already monitored through other monitoring inclusion rules in Settings > Table Monitors
- Not monitored - tables that are not monitored or explicitly excluded from monitoring.
- Not supported - tables that exist in the lineage but monitoring through Monte Carlo is not supported
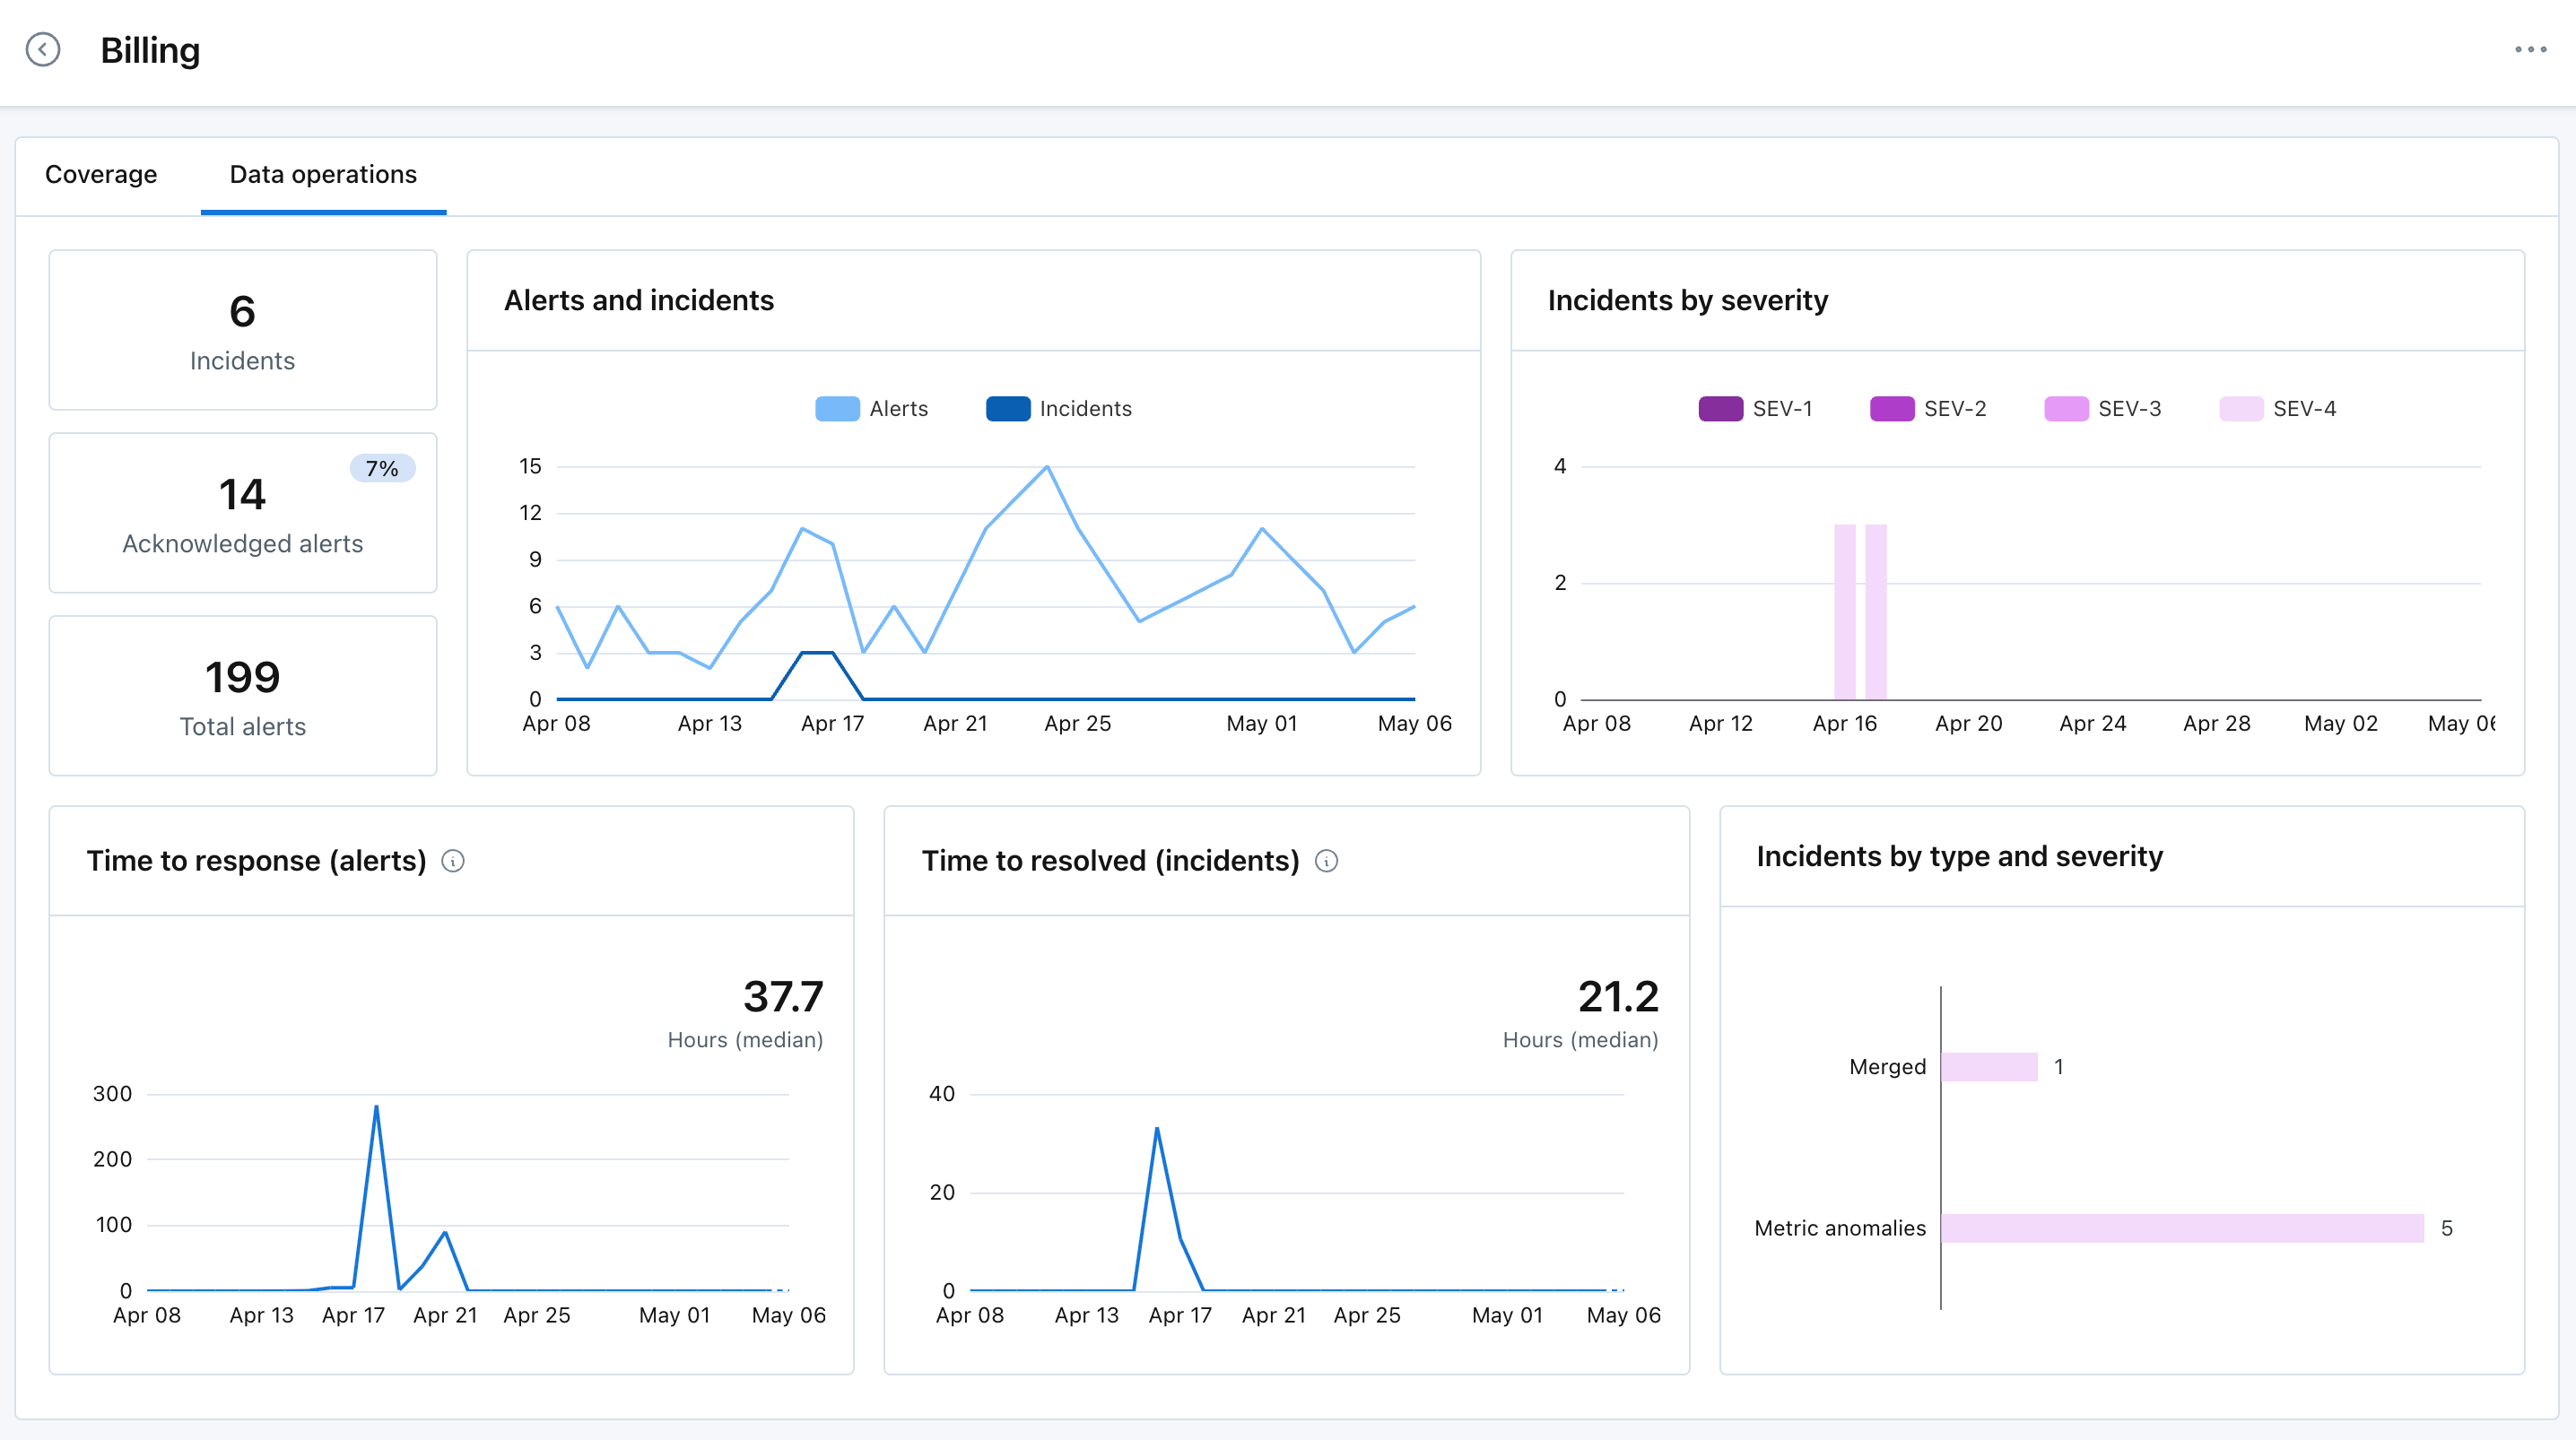
Data operations
Data operations allow users to get an overview of alerts and incidents for the assets included in the Data Product. These summary statistics can be used to answer questions like:
- How many incidents have impacted this Data Product in recent weeks or months? What severity were they?
- Is this Data Product becoming more reliable over time? Is the number of alert or incidents increasing or decreasing?
- Is responsiveness to alerts about this data product getting better, or worse? Is time to response and time to resolved improving or not?
Widgets in this dashboard are clickable, allowing you to see the underlying alerts and incidents. To further filter the dashboard, click on the ... and "Open in Data operations", which will open the fully configurable Data Operations dashboard, pre-filtered for the Data Product.
Access and permissions
Data Products can be created by Account Owners, Domain Managers and Editor Managed Roles and are visible to all roles except Asset Editor and Asset Viewer.
- Account Owners and Domain Managers can edit all Data Products
- Editors are only able to edit Data Products they created
Updated 16 days ago