Comparison Monitors
Comparison Monitors compare metrics from two data sources to find deltas. They detect anomalies for dozens of available metrics, or for custom metrics defined by the user.
One monitor can track many different metrics on the given tables. Comparison monitors can also be easily segmented, allowing the user to isolate anomalies that could otherwise be diluted and missed.
The current version of Comparison Monitors replaced an earlier version in May 2025. Documentation for the earlier version is still available here.
Creating Comparison Monitors
Comparison Monitors can be created from the Create monitor page or Assets page. Configuration steps include:
Choose source and target
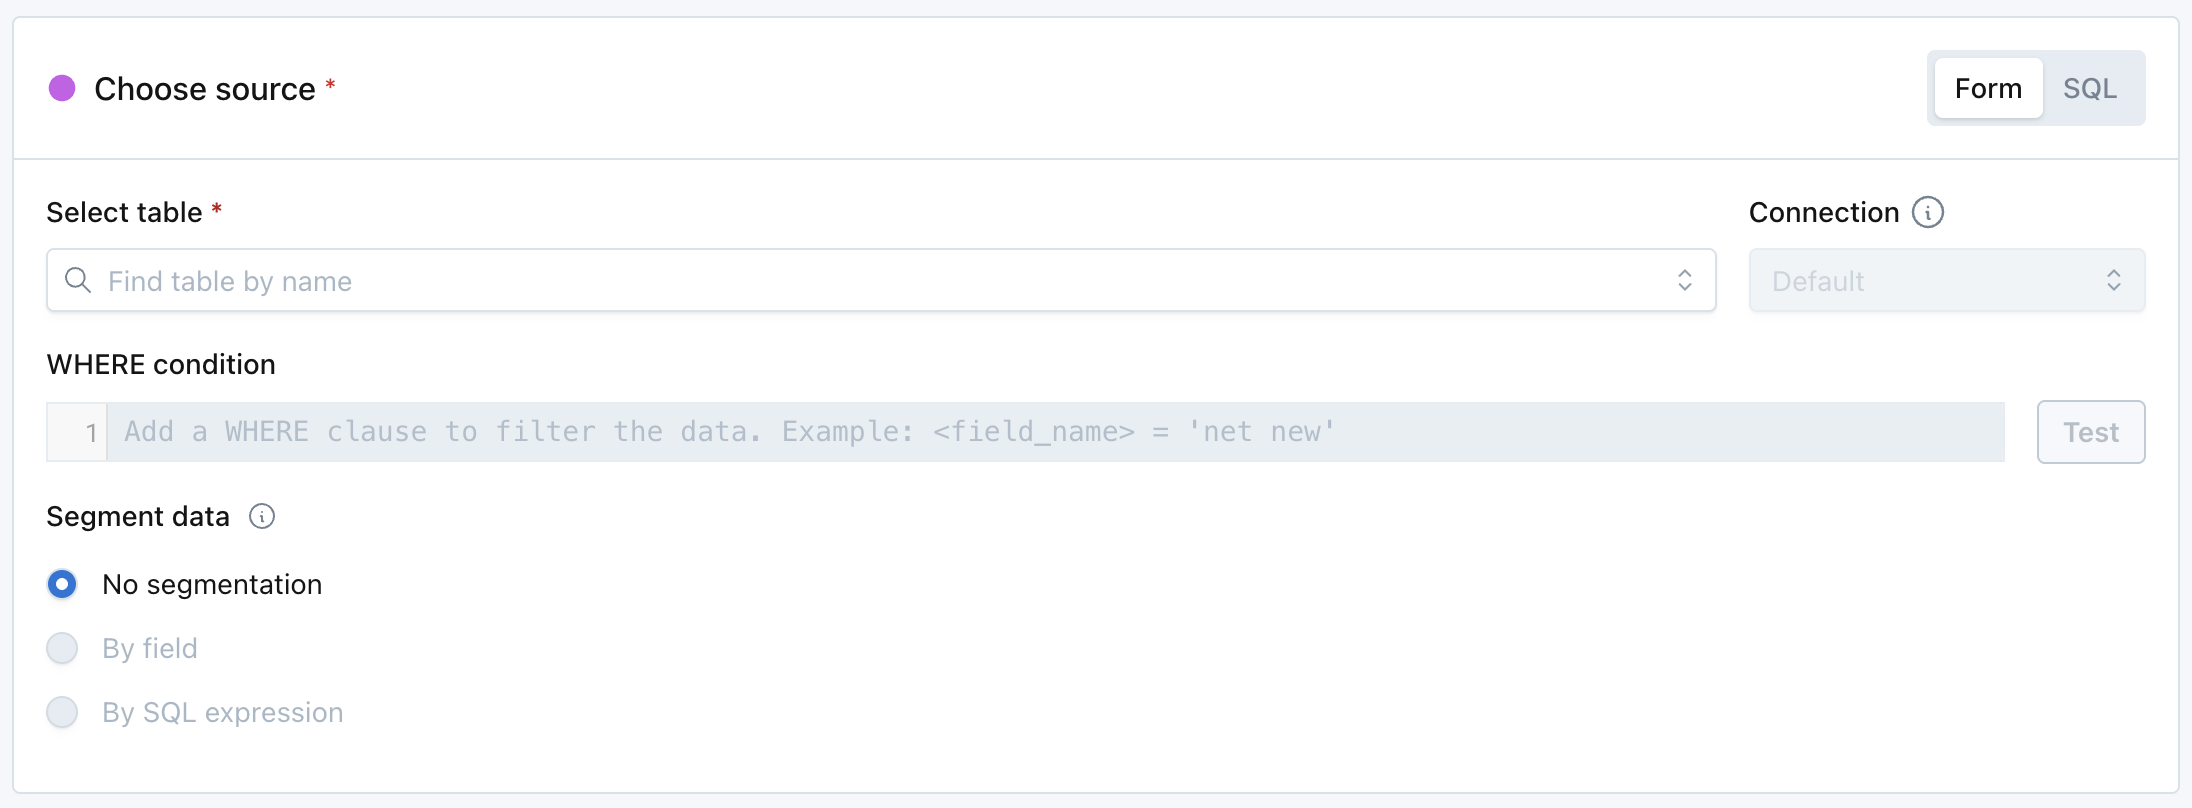
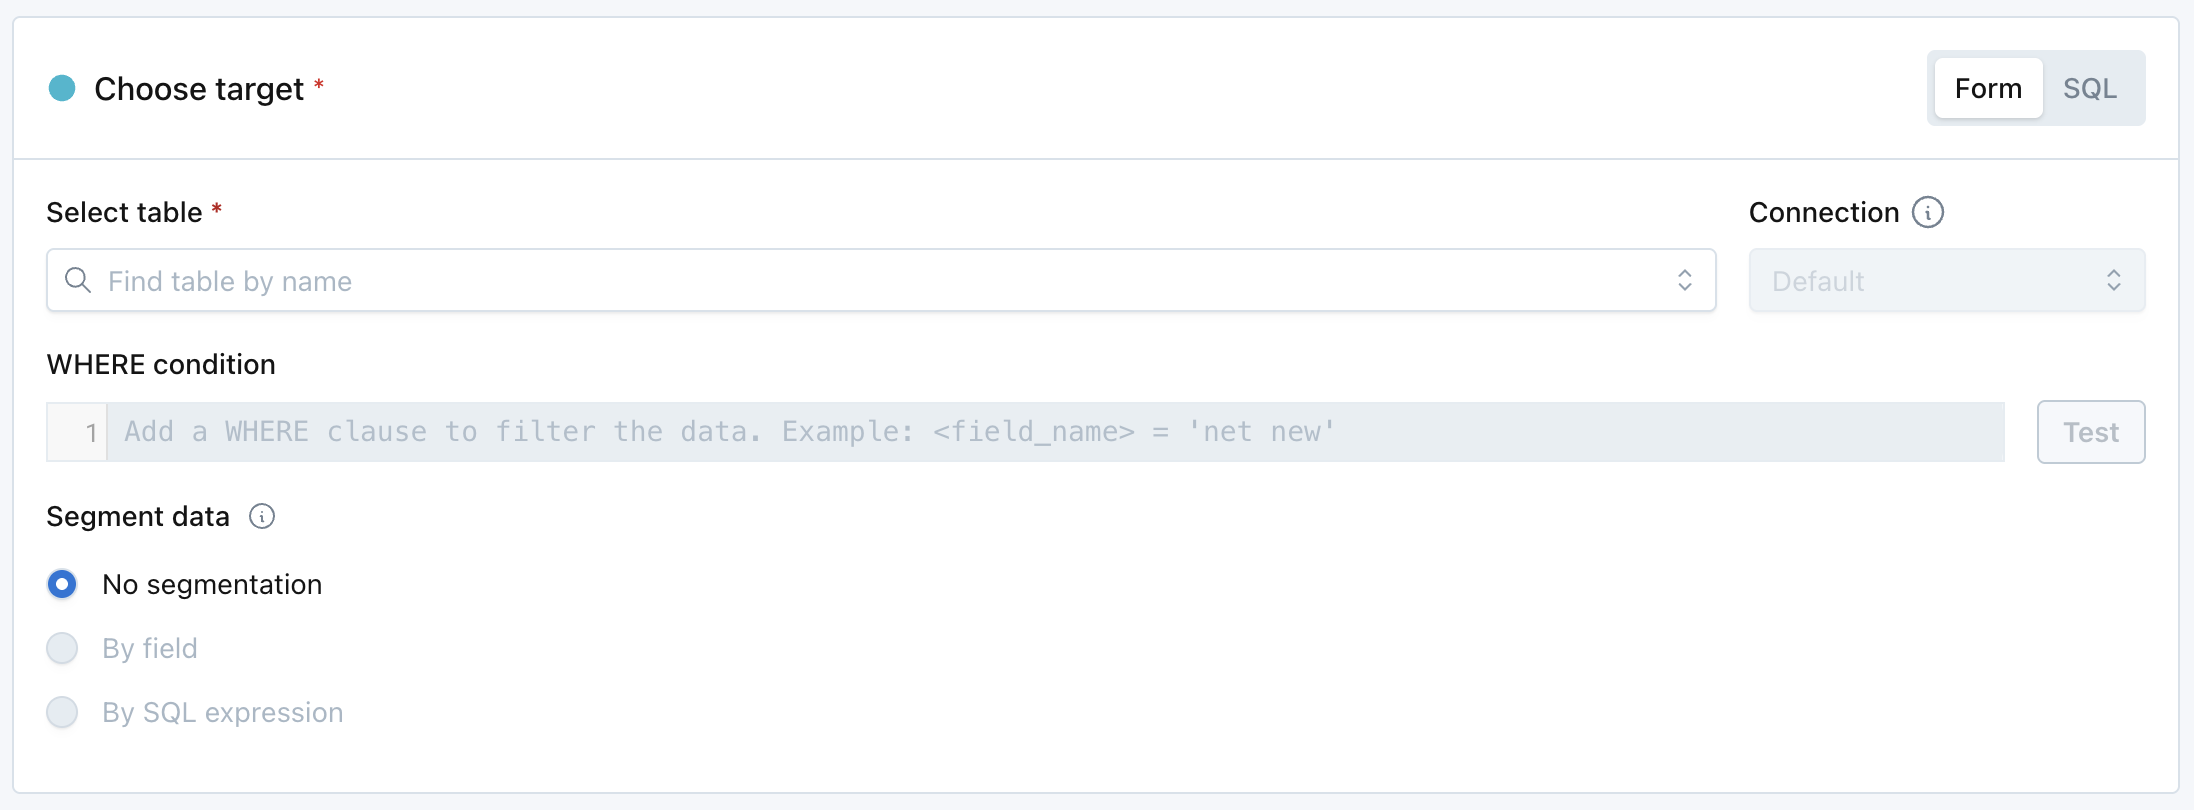
For the source and target data sources, select which table or view to monitor, and how to filter and segment the data. Instead of selecting a table, users can also define a source using SQL. Settings include:
Select table: picks which table or view to monitor. Alternatively, users can write custom SQL and monitor the output of the query.
WHERE condition: filters the entire selected table or the output from the custom SQL. For example, a specific segment of data you would like to monitor.
Segment data: select up to 1 field to segment the data by, or compose one with a SQL expression. Common fields to segment by include products, regions, event types, versions, and merchants. Read more about segmentation.
Define alert conditions
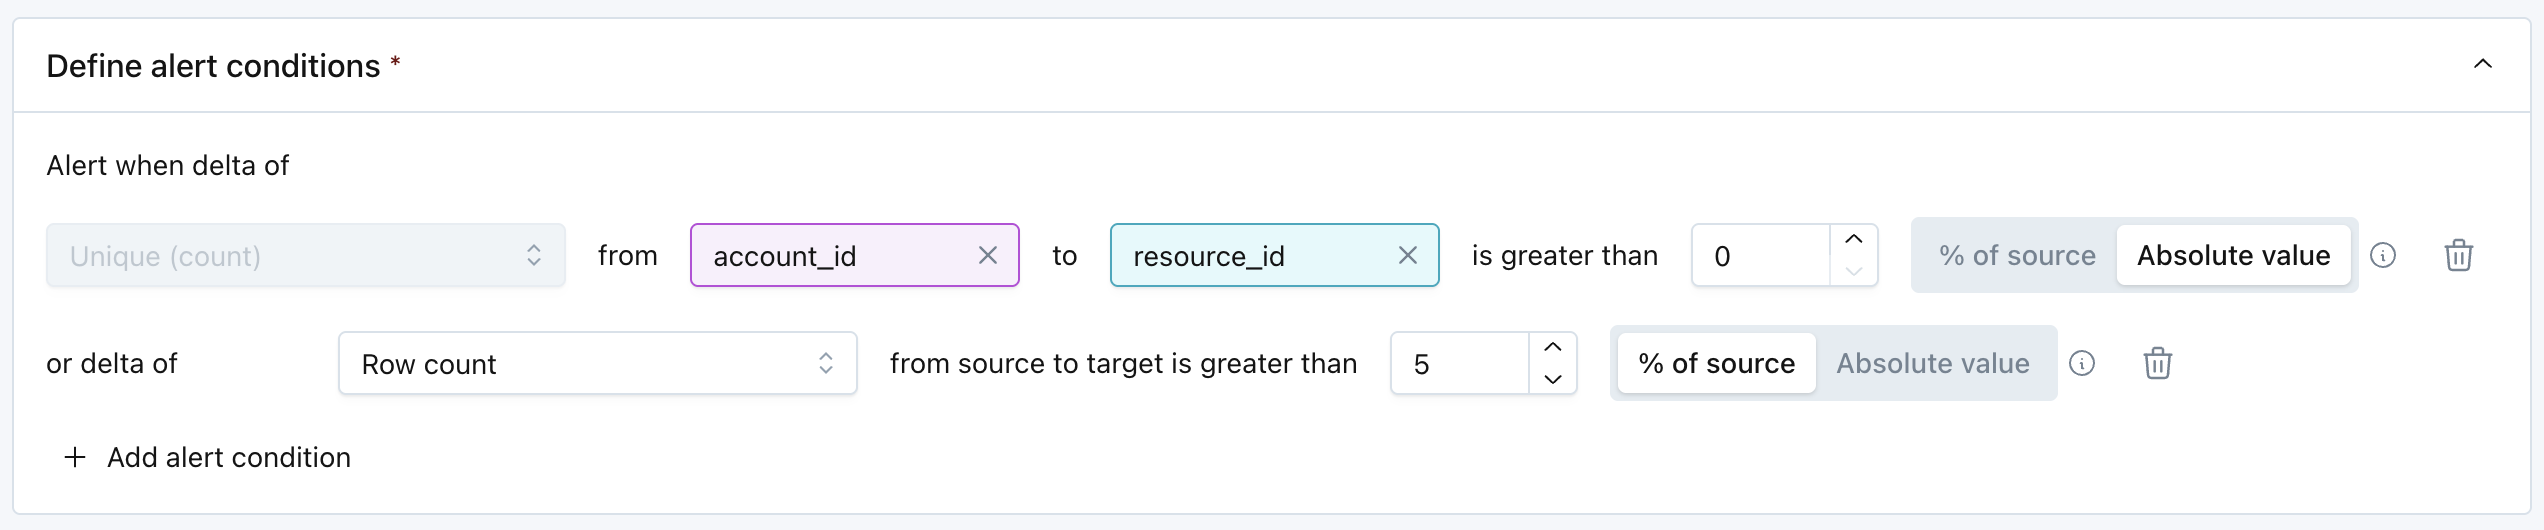
Select the metrics and fields to monitor, and the threshold to generate an incident. See the full list of available metrics or create your own custom metric.
Define schedule
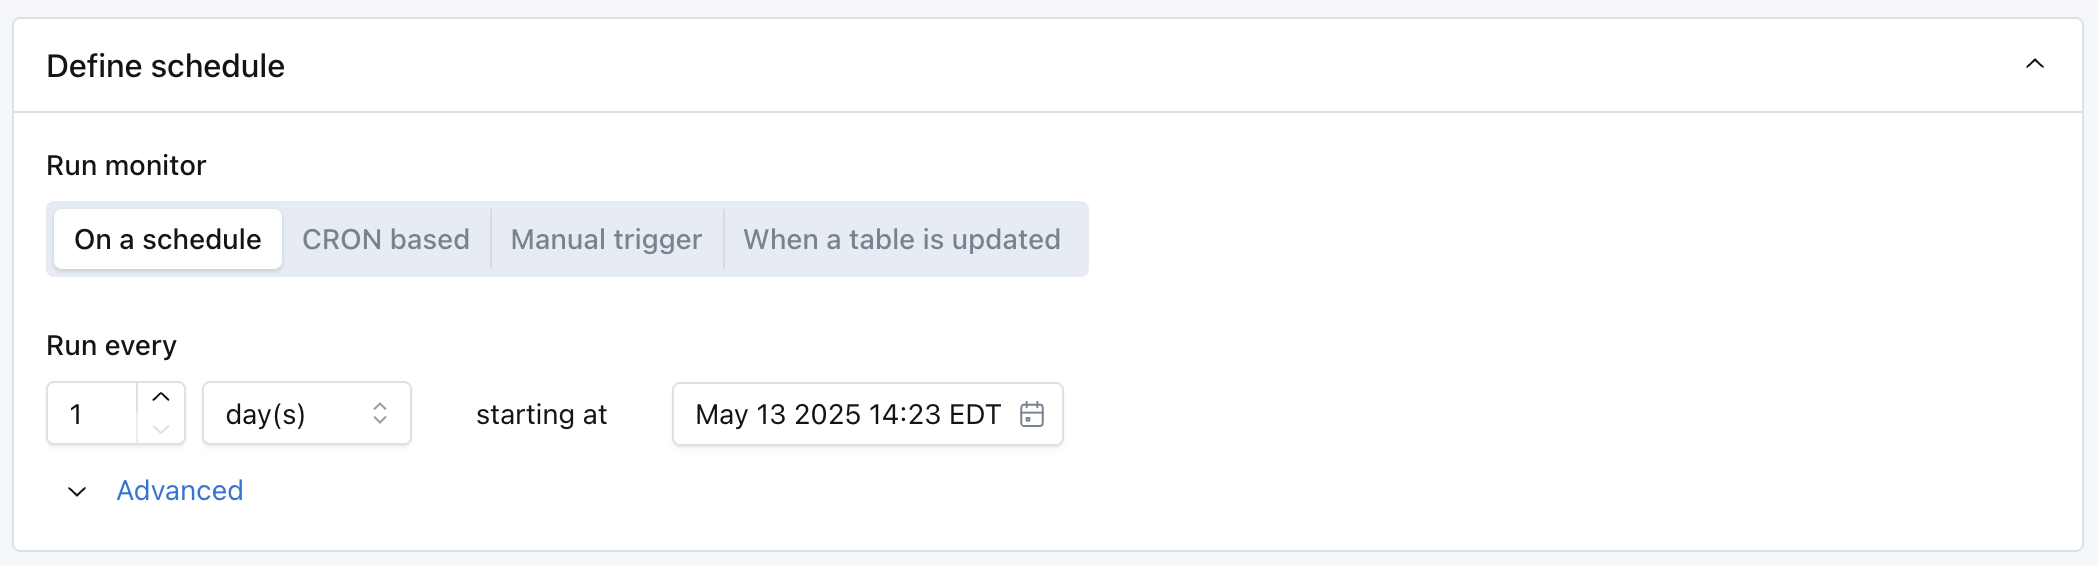
Select when the monitor should run. There are several options:
- On a schedule: Input a regular, periodic schedule. Options for handling daylight savings are available in the advanced dropdown.
- CRON based: Input a cron expression to run on a schedule specified by the cron. Options for handling daylight savings are available in the advanced dropdown.
- By trigger:
- Manual trigger: Select this option when you want to manually trigger using the
Runbutton on the monitor description page. - When a table is updated: The monitor will run when Monte Carlo sees that the table has been updated. This logic uses the history of table updates that Monte Carlo gets through its hourly collection of metadata. The run will occur up to 30 minutes after an update, but not more than once every 2 hours (12 hours for high-segment monitors). Use the Run periodically if trigger doesn't fire toggle to control whether the monitor also runs on a fallback schedule (every 48 hours by default) when no table update is detected.
- When a job or task completes: The monitor will run when Monte Carlo detects a successful job or task execution, but not more frequently than every 2 hours (12 hours for high-segment monitors). Use the Run periodically if trigger doesn't fire toggle to control whether the monitor also runs on a fallback schedule (every 48 hours by default) when no job or task executions are detected.
- Manual trigger: Select this option when you want to manually trigger using the
Send notifications
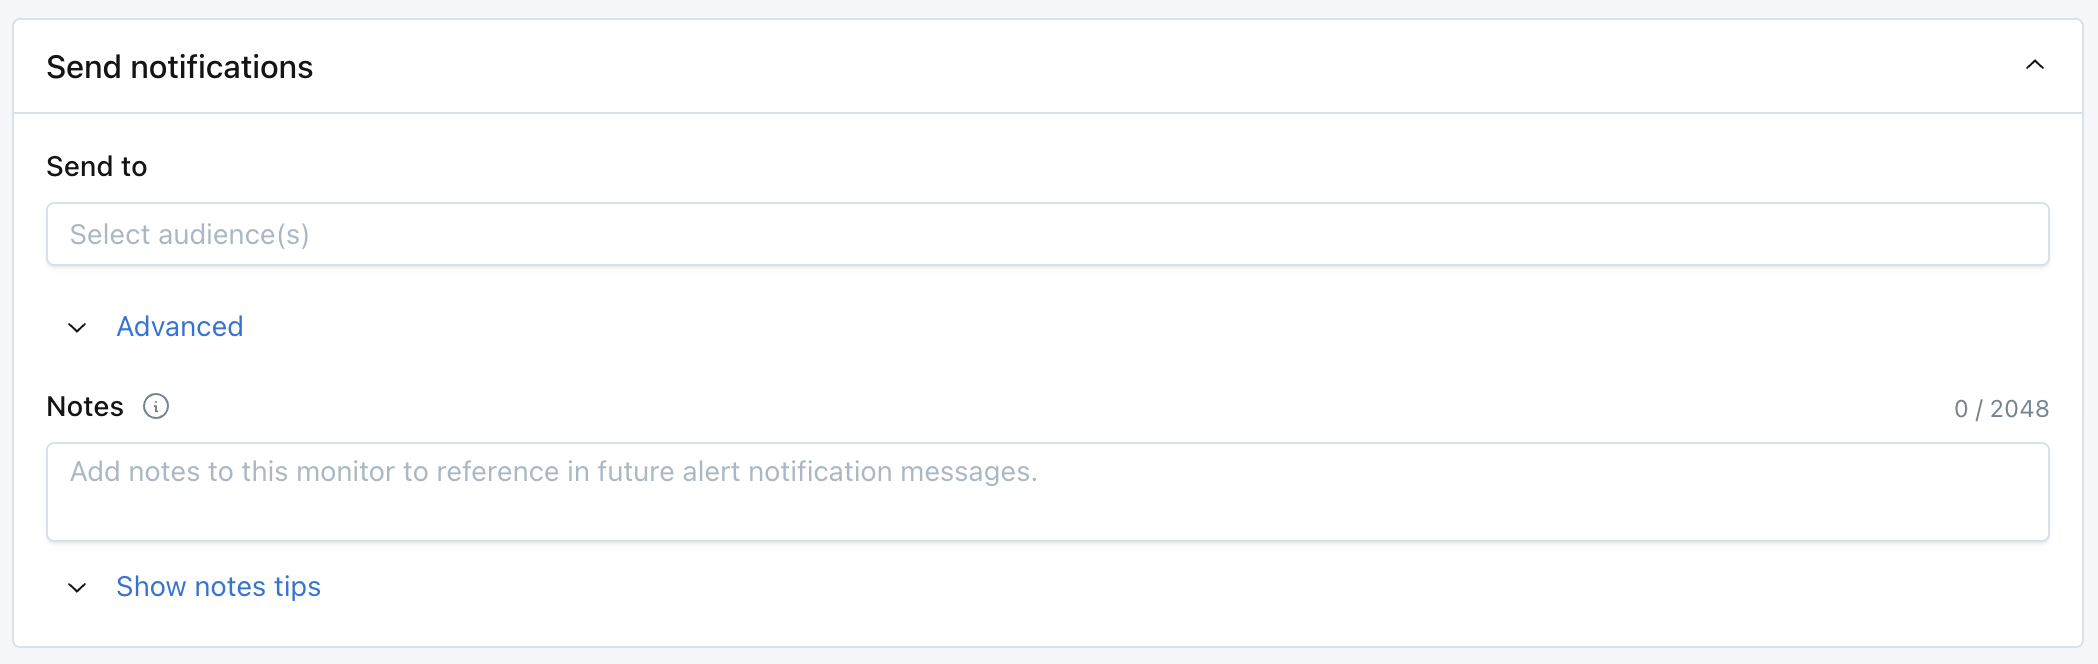
Select which audiences should receive notifications when an anomaly is detected.
Text in the Notes section will be included directly in Alert notifications. The "Show notes tips" dropdown includes details on how to @mention an individual or team if you are sending notifications to Slack.
Notes support rich-text formatting, including bold, italic, underline, strike-through, lists, links, and code blocks. Rich-text channels display these styles, while text-only channels show a plain-text equivalent.
Monitor properties can be dynamically inserted into Notes through variables. Supported variables include Created by, Last updated at, Last updated by, Priority, and Tags.
Additional settings exist for customizing the description of the monitor, pre-setting a severity on any incidents generated by the monitor, or for turning off failure notifications.
Learn more about setting monitor tags.
Updated 1 day ago