Data quality
Overview
The data quality dashboard provides a way to view the health of a set of monitors. Customer use the data quality dashboard for:
- SLAs : report on the current state and trend of specific monitors, rather than all monitors.
- Critical data elements: report on a set of validations or metric monitors for a critical data element, applying tags like
cde:total_revenue. - Enforcing data contracts: tag monitors with a specific tag per data contract or simply
data-contract. - Data quality dimensions: coming soon: breaking down data quality score by dimension.
- Team monitor reporting: for monitors that are owned by the finance team, using monitor tags like
team:finance. - Use case monitor reporting: for organizing specific use-cases or data products, using monitor tags like
data-product:salesforce_revenueorproject:revenue_reliability.
Data quality dashboard
Supported monitor typesThe following monitor types are supported for measuring data quality:
- Validations
- Comparison
- Custom SQL
Legacy Freshness and Volume rules can also be viewed. Other monitor types are under evaluation to be added, but generally this dashboard is meant to measure deterministic monitors versus non-deterministic anomaly detection monitors.
Using the data quality dashboard
By default, all Validation, Comparison, and Custom SQL monitors are shown. Best practice is to tag monitors in order to start measuring data quality for your data product, asset, or team.
Filtering by monitor tags
The dashboard can be filtered by monitor tags. Learn more about applying monitor tags.
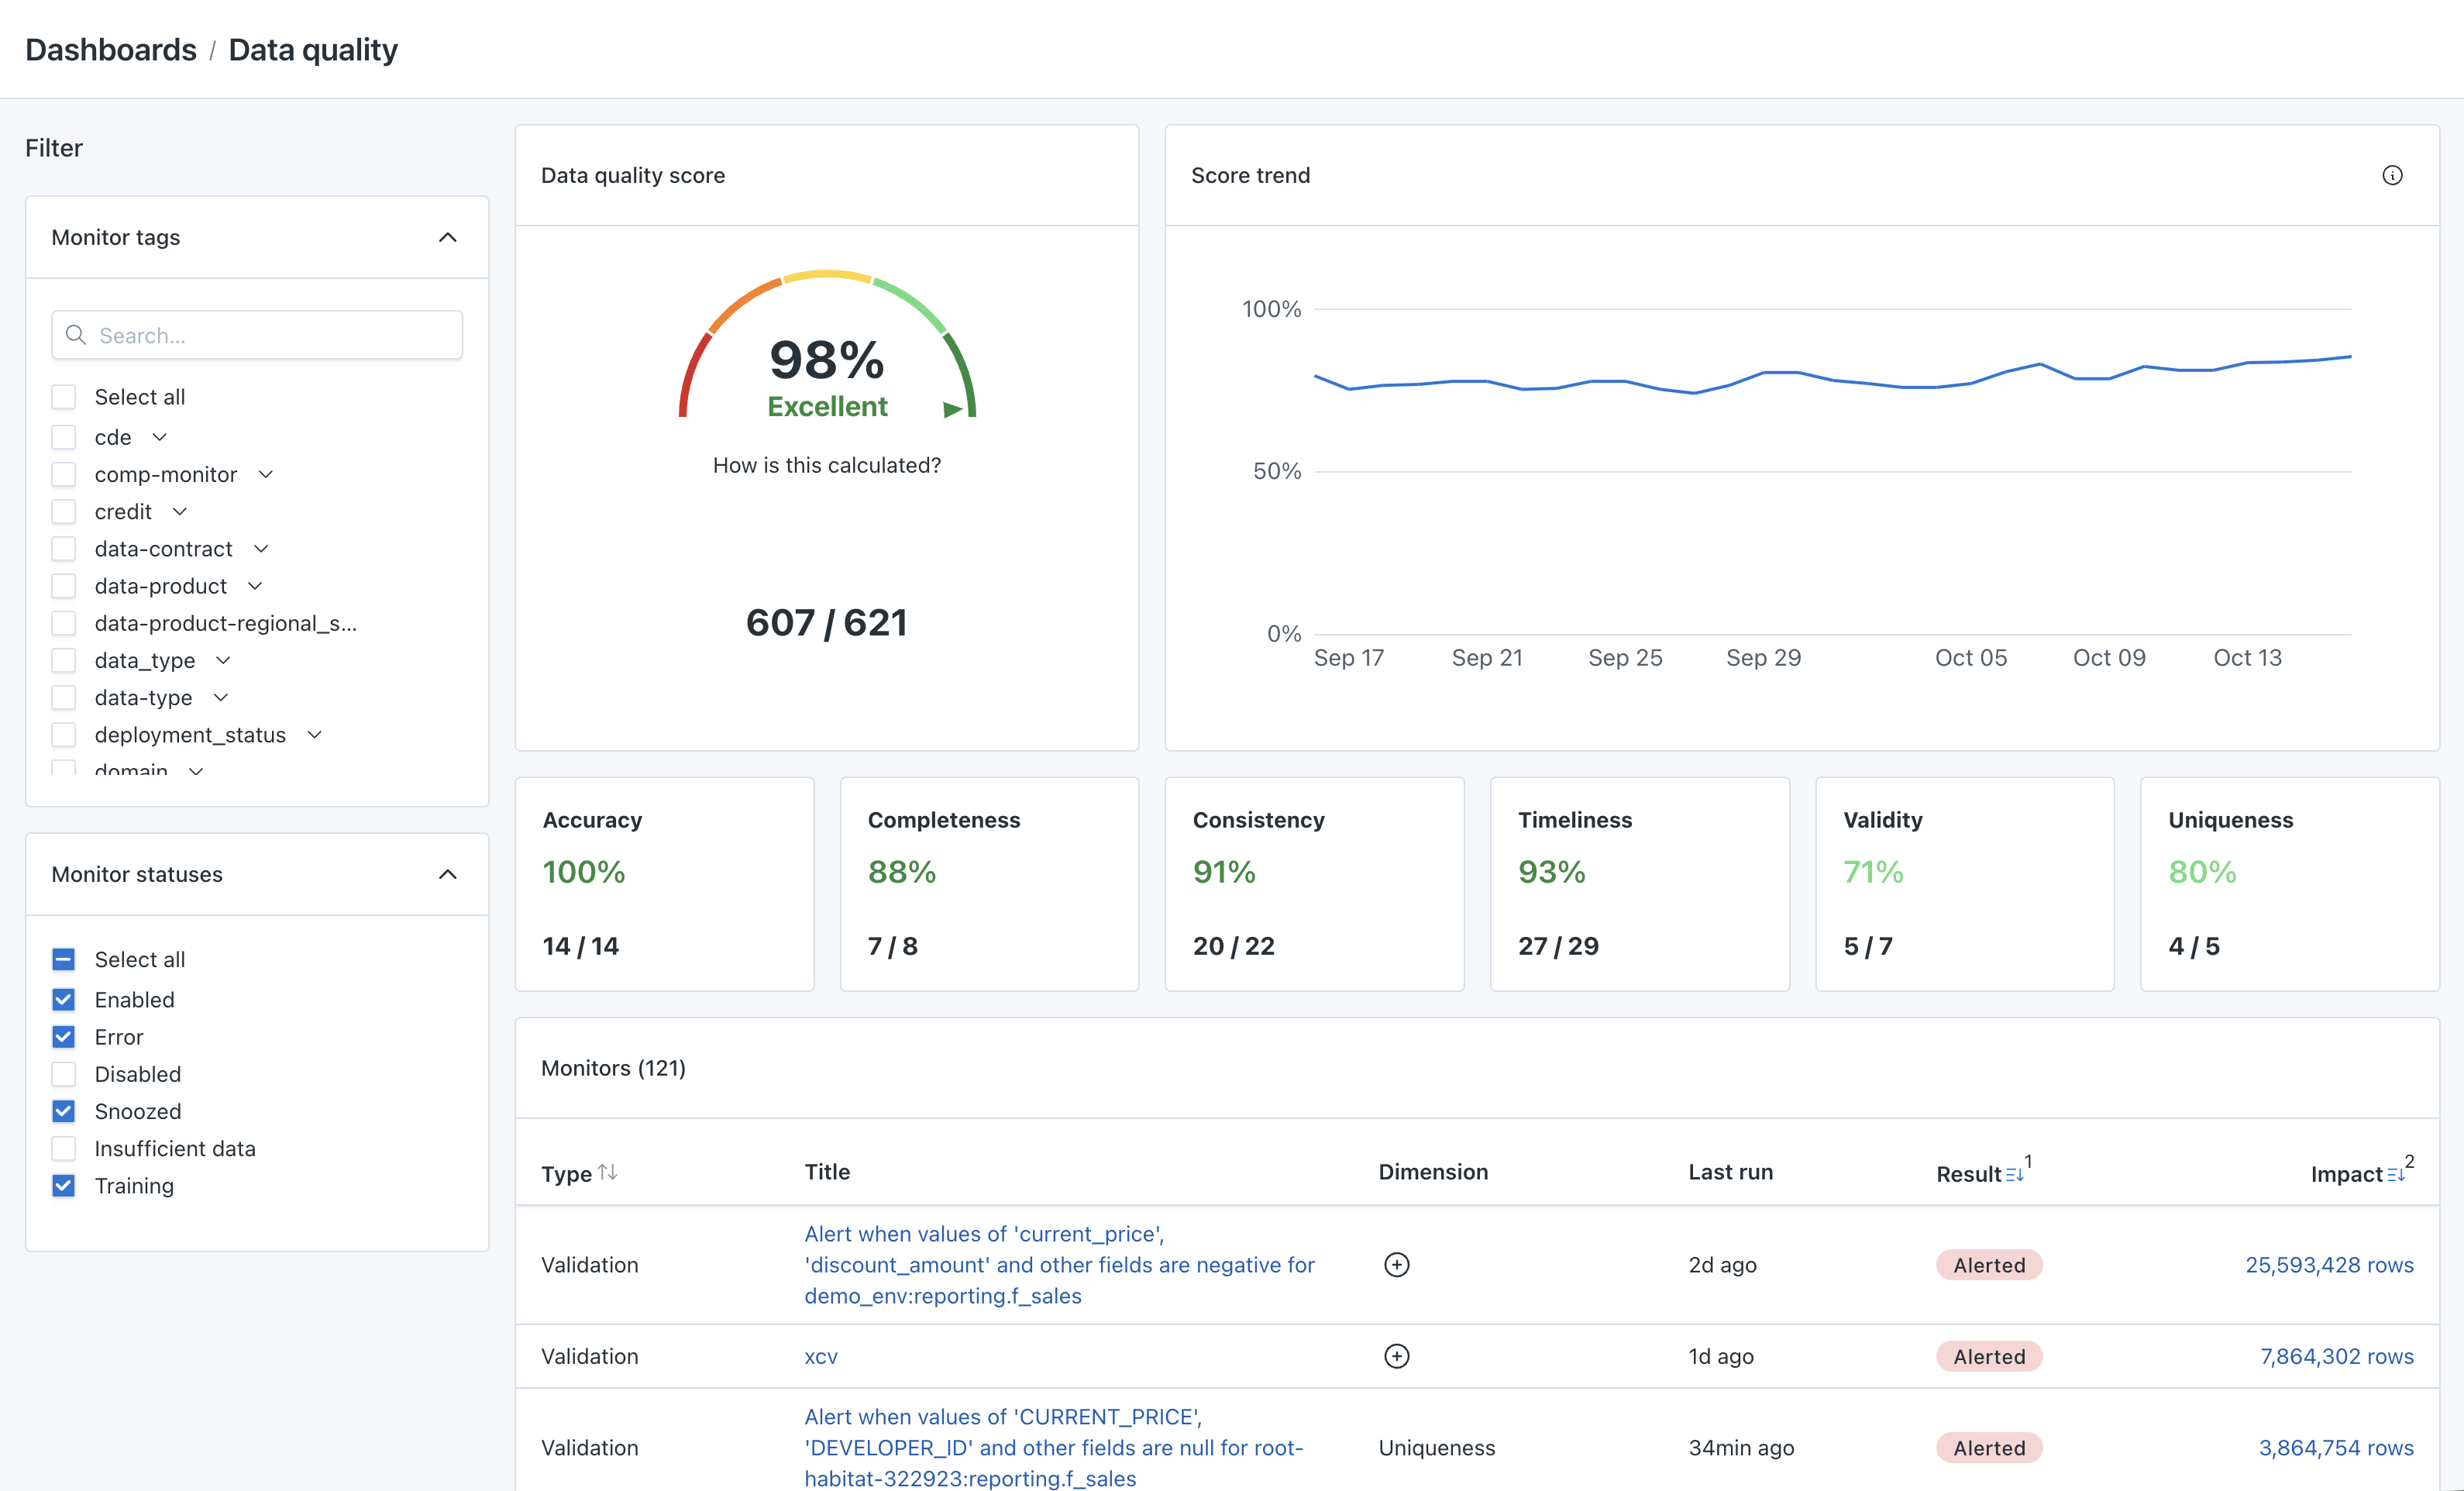
Data quality score
The data quality score is calculated as the number of monitors that have passed on the last run divided by the total number of monitors.
Think of the score as "current state" - what percent of monitors are passing right now?
Why might total monitors number be different than expected?
There a few reasons:
- All status monitors are displayed in this dashboard, including Enabled, Error, Disabled, Snoozed, Insufficient data, and Training. Confirm if any of these monitors are no longer needed or apply a tag filter to filter them out.
Why might the alerting monitors number be different than expected?
- For monitors in "Error" status, the last run is displayed as the last "successful" run. Error status means the monitor entirely failed to execute, not that it ran and alerted. Confirm if any of these monitors are no longer needed or apply a tag filter to filter them out.
- The monitor may have run and alerted, then was disabled. You may not be receiving alerts for this monitor recently, but since the last successful run of the monitor alerted it will show as alerting in the "current state."
Score trend
The score trend is a daily aggregation of the monitor runs that run that day. The score trend calculation is the number of successful runs of monitors that day divided by the number of total monitor runs that day.
Why might trend number be different than the current data quality score?
- If a monitor is not a "daily" scheduled monitor, this may cause discrepancies between the score and trend. It is recommended to use monitors with similar frequencies for measuring data quality. For example:
- If a monitor is run hourly, it carries a heavier weight as it will have 24 runs per day instead of a daily monitor that only has 1 run per day.
- If a monitor is run weekly, it carries a lower weight as it will only show on the trend once per week instead of a daily. It will only be used in the trend once per week.
- If a monitor is no longer actively running on a schedule, it won't be reflected in the trend but will still be reflected in the current data quality score.
- The trend data is on a delay of up to 12 hours. Newly tagged monitors will not have trend data for 12 hours.
Data quality dimensions
The Monte Carlo platform supports monitoring the following six key dimensions of data quality. Each dimension provides insight into specific aspects of data health.
Applying data quality dimensions to monitors
To create add a data quality dimension a monitor, there are a few options:
- Add a dimension when creating or editing an existing custom monitor.
- Bulk apply a dimension on the monitors list.
- Add the
dataQualityDimensionattribute on Monitors as Code.
Supported monitors
The following types of monitors support data quality dimensions:
- All Metric and Validation monitors (Metric, Validation, Custom SQL, & Comparison) are supported through the UI and Monitors as code.
- Explicit thresholds within Freshness and Volume are supported through the UI.
- Freshness and volume rules are supported through Monitors as Code.
Dimension definitions & examples
-
Accuracy
Measures how closely data reflects actual events or conditions.
Monitor Examples:- Validation: Applies custom logic to check for outlier values in columns.
- Comparison: Check if the values in one asset reflect the those in another.
Real-World Examples:
- A monitor that alerts when customer purchase totals exceed expected limits, indicating possible errors in calculations.
- An accuracy rule that flags inconsistencies in geographic coordinates if they exceed a certain distance.
- Flagging discrepancies in foreign key relationships to ensure referential integrity.
-
Completeness
Assesses if all necessary data points are included.
Monitor Examples:- Metric: Alerts when specific columns have a high proportion of null or missing values.
- See many available metrics to measure completeness as well as distribution of records.
- Volume: Detects deviations in row counts or record volume that may indicate missing or duplicate data.
- Comparison: Check that a pipeline has completed between a transactional database and the data warehouse.
Real-World Examples:
- Monitoring null values in critical fields, such as product IDs, to prevent downstream reporting gaps.
- Ensuring key transaction tables refresh every hour to maintain up-to-date analytics.
- Metric: Alerts when specific columns have a high proportion of null or missing values.
-
Consistency
Confirms uniformity in data format and expected patterns.
Monitor Examples:- Schema: Detects schema drift, like unexpected column type changes.
- Volume: Flags tables with sudden shifts in row counts, potentially indicating inconsistent data ingestion.
Real-World Examples:
- A monitor that triggers when daily sales data format changes (e.g., date format shifts) to prevent processing errors.
-
Timeliness
Checks if data arrives within the expected window for timely decisions.
Monitor Examples:- Freshness: Ensures data pipelines update tables within set thresholds.
- Freshness: Ensures critical data tables, such as sales transactions, are updated within a specific timeframe.
Real-World Examples:
- Alerting on late updates to customer engagement data so marketing teams don’t use outdated insights.
- Monitoring delivery time for inventory updates to ensure real-time stock levels reflect sales.
-
Validity
Verifies data against business rules or standards.
Monitor Examples:- Validation: Implements business-specific validation checks.
- JSON Schema: Tracks schema adherence, such as required fields and data types.
Real-World Examples:
- A rule to verify that discount rates fall within allowable percentages for specific product lines.
- Validating email formats in customer contact details to reduce communication errors.
-
Uniqueness
Detects duplications where unique values are required.
Monitor Examples:- Metric: Tracks duplicate entries in unique ID columns.
Real-World Examples:
- Ensuring no duplicate entries in transaction ID fields, which could lead to over-reporting sales.
- Monitoring unique customer IDs to prevent merging errors in customer data records.
Alerting monitors
Alerting monitors provides detailed information on the monitors that alerted on their most recent run. Invalid records are provided, and drilling into the invalid records takes you to that alert for further investigation.
Updated about 1 month ago