Metric investigation
What is Metric Investigation?
Metric Investigation helps you trace anomalies detected by Monte Carlo metric monitors back to their potential root causes — faster and with more context. With this feature, you can sample and segment rows related to a metric alert, giving you immediate visibility into the underlying data that triggered an alert.
Metric Investigation provides a lightweight root cause analysis workflow built directly into the alert page.
Why Use Metric Investigation?
When a metric monitor triggers an alert, teams often ask:
- What is driving the change in this metric?
- Are certain values or dimensions contributing to the anomaly?
- Are there unexpected outliers or data quality issues in the rows behind this result?
Metric Investigation helps answer these questions by making it easy to:
- View sample rows related to a metric alert.
- Segment rows by field to quickly surface correlations.
- Drill into anomalous vs. non-anomalous behavior.
- Compare across time periods or segments.
- Copy and refine the SQL query for deeper investigation.
This reduces the time from detection to understanding, helping data engineers and analysts diagnose and respond to data issues more effectively.
Overview
When viewing a metric monitor alert, you will see an Investigate rows icon on each event and under the Investigate button. Clicking this opens the investigation drawer, where you can explore:
1. Sampling and Segmentation
-
Sample Rows: View a sample of rows for the alerting measurement.
Example: Rows wheremp_processing_time_ms < 0triggered a Negative (%) alert. -
Segment by Field: Group rows by any low-cardinality field on the table to spot correlations.
Example: Group bystatusto see counts ofpaid,refunded, etc.
-
SQL Query: The exact SQL used to retrieve the displayed data is visible and can be copied for further analysis.
-
Sample Rows Table or Bar Chart: Depending on the type of investigation:
- Full table of rows (useful for outlier review and deep dive).
- Bar chart of segment distribution (useful for correlation and comparison).
2. Investigation Modes
You can switch between multiple investigation modes:
- Sample: View anomalous rows for the alert condition.
- Segment: Segment anomalous rows by field (e.g. client, region, status).
- Segmenting works best on fields with low to moderate cardinality, as it's limited to the first 1,000 segments.
3. Supported Metrics and Fields
You can see the full list of Available Metrics in metric monitors in the linked documentation. All metrics are supported for investigation, but the options to filter rows by may slightly vary per metric.
| Metric Type | Supported? |
|---|---|
| Pipeline metrics (Row count, Relative row count, Time since last row count change) |
|
| Field metrics (distribution or counts, e.g. Mean, Median) |
|
| Field metrics (conditions, e.g. Null %, Unique %) |
|
| Custom metrics |
|
Example Investigations
Example 1: Sample metric underlying rows
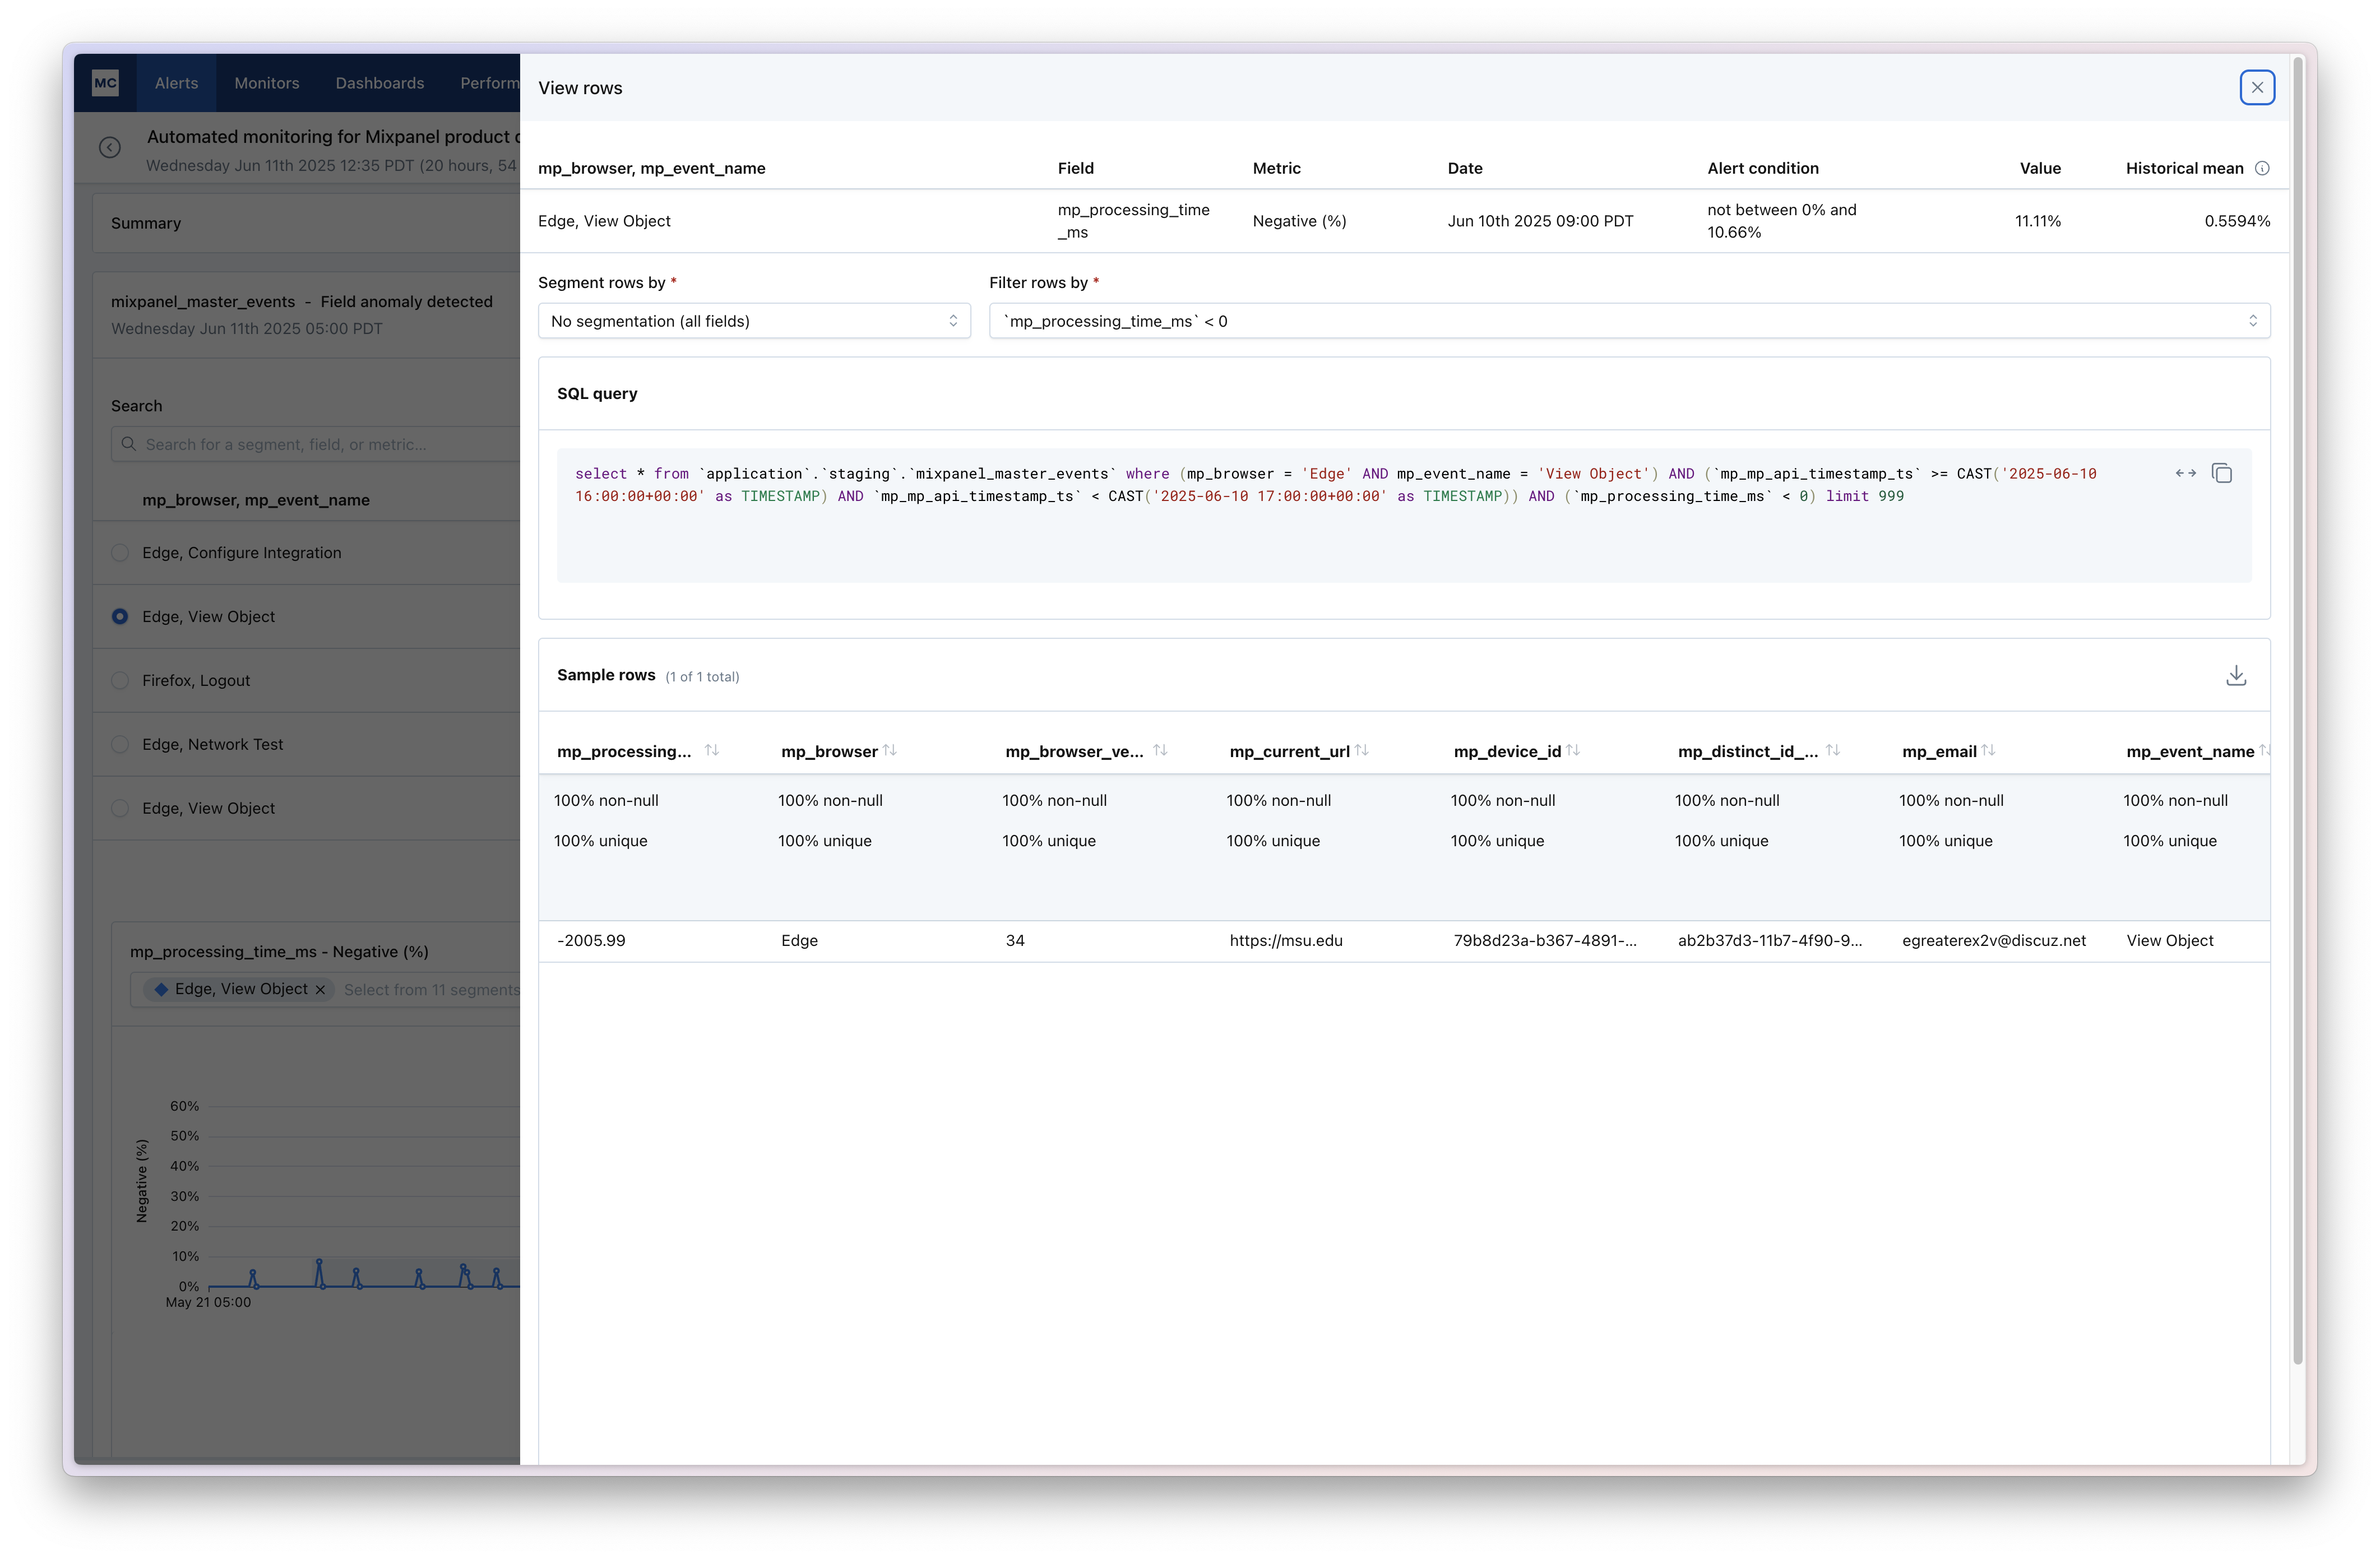
- Alert: Negative (%) on
mp_processing_time_ms - Investigation: Sample rows where value < 0
- Segment:
mp_browserandmp_event_name
Example 2: Segmentation
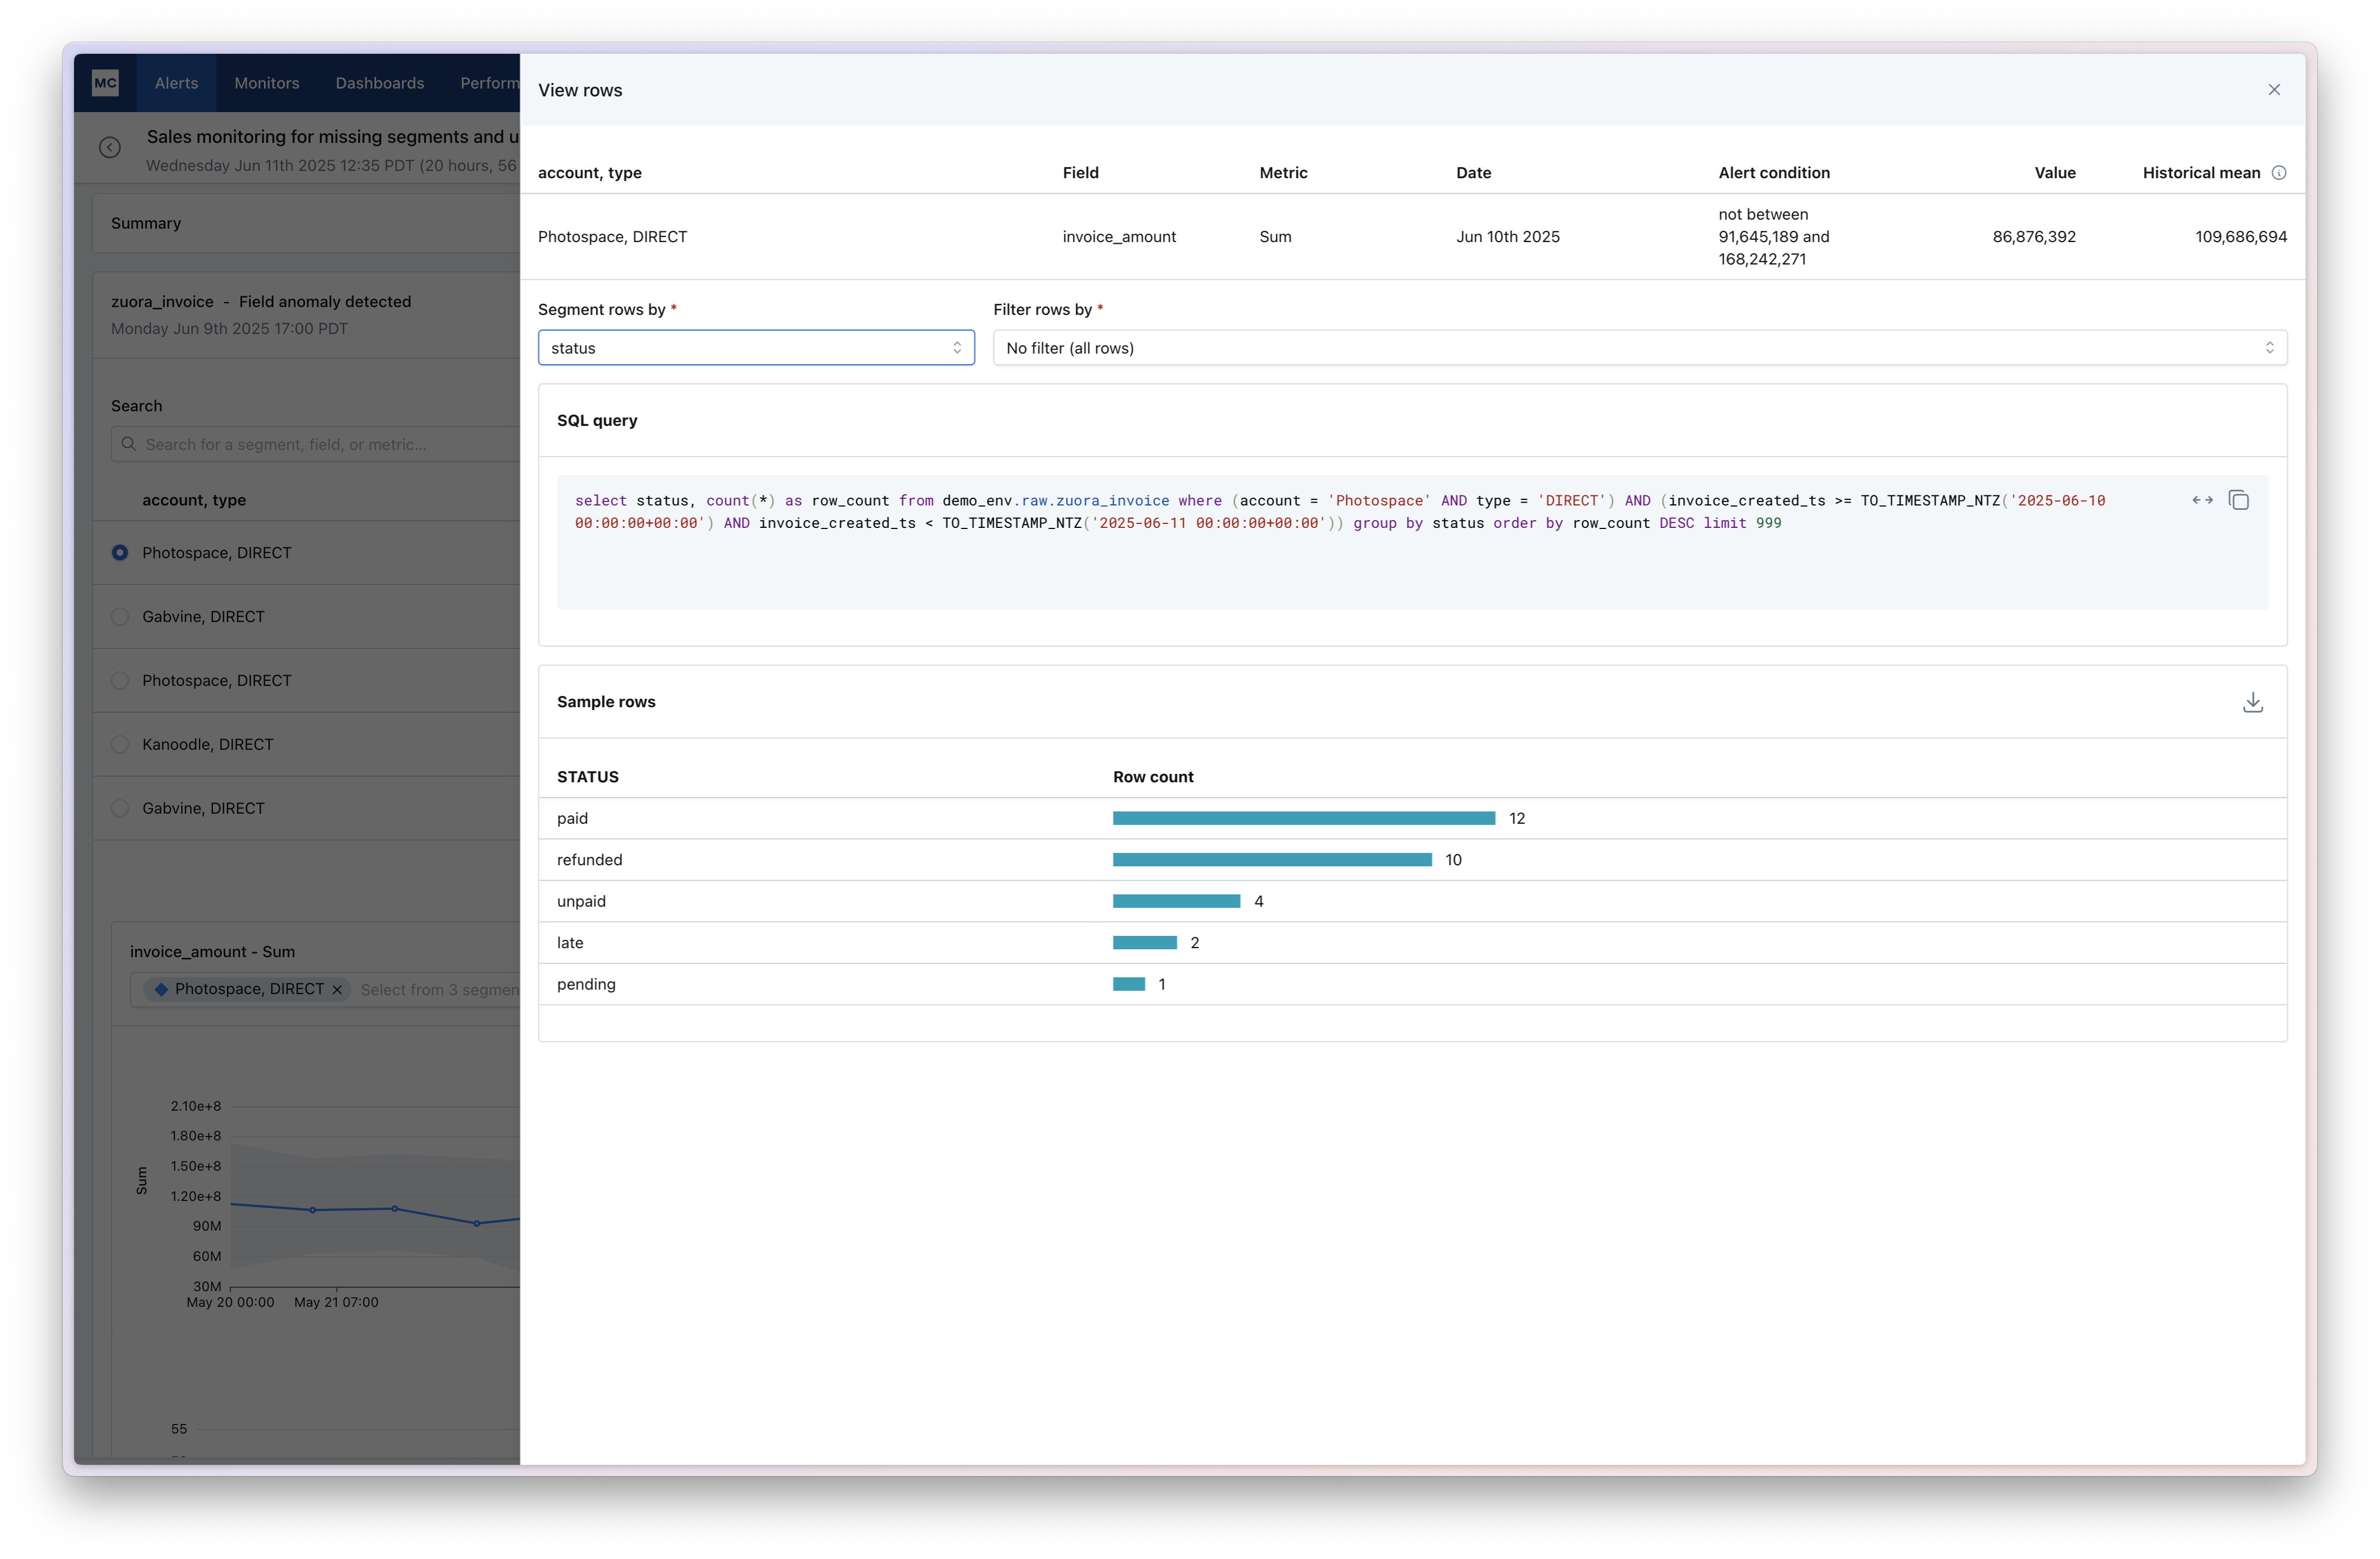
- Alert: Sum of
invoice_amountoutside expected range - Investigation: Segment rows by
statusto understand row count distribution by type (paid, refunded, unpaid, etc).
Notes and Tips
- SQL-first: Everything shown is backed by a SQL query you can copy and modify.
- Anomalous rows first: Investigation focuses on showing you the rows that drove the alert.
- Segment smartly: For tables with many columns, choose low-cardinality fields for the clearest results.
Learn More
For background on how metric monitors work, see the Metric Monitors Overview.
Updated about 1 month ago