Navigating the Monte Carlo UI
This tutorial will go over how to navigate the Monte Carlo UI.
Last Updated: April 11, 2022
Transcript
When you first sign into Monte Carlo, you will land on the Monitors page which provides a summary of the universe of data that Monte Carlo is monitoring in your environment, as well as a list of the different sorts of opt in or custom monitors that have been added to your environment:
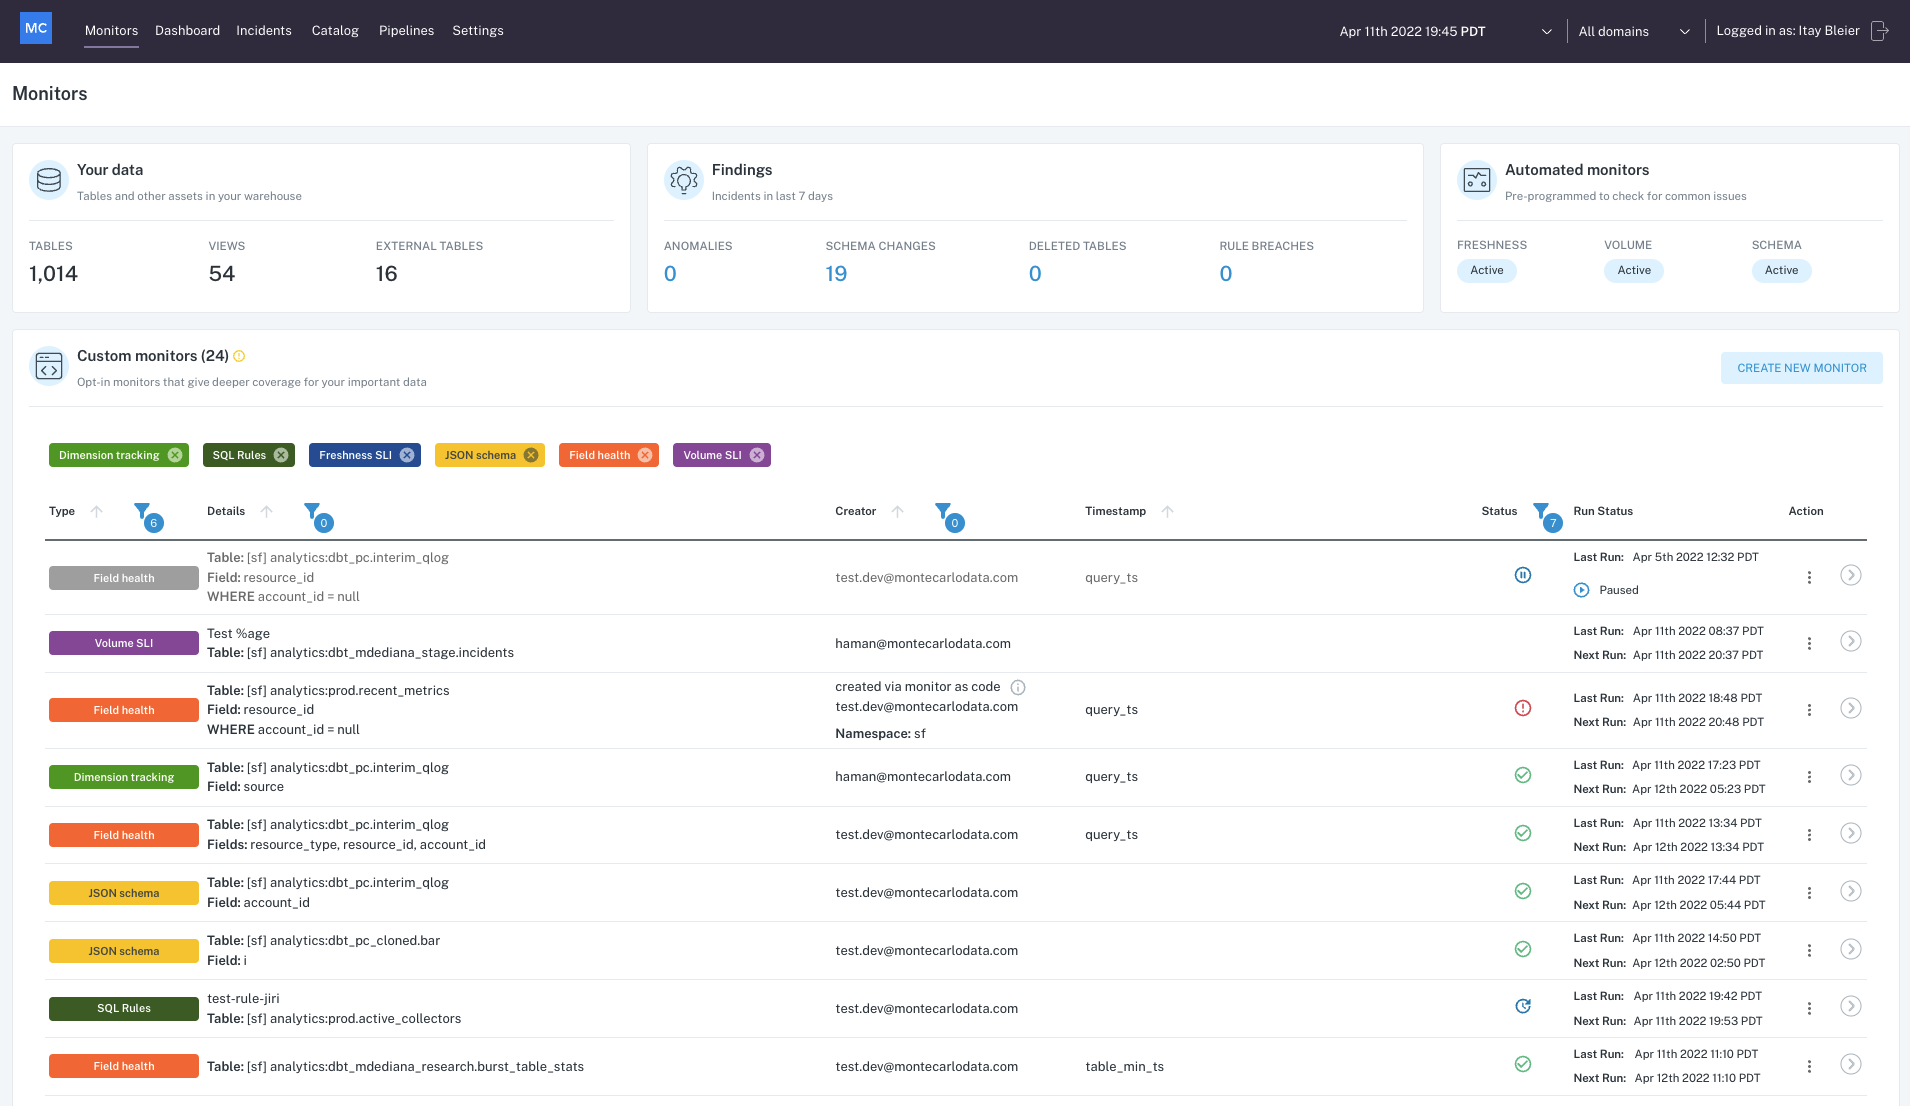
Example Monte Carlo environment
In this particular environment, we are monitoring about twenty three hundred tables plus a handful of views and external tables, and those are being monitored for freshness, volume, and schema changes automatically. In order to get freshness, volume, and schema changes on these twenty three hundred tables, you don't have to do anything; the system is automatically doing that as soon as you are plugged in.
In this environment, there is a set of different opt in monitors (or custom monitors) which have been added, and those include field health, dimension tracking, different sorts of rules, and what we call SLIs or service level indicators, as well as json schema monitors. It's easy to search down and see which of these are monitoring which tables - there some nice search capabilities here. It's a high level overview of the different kinds of monitors that have been added to your environment:
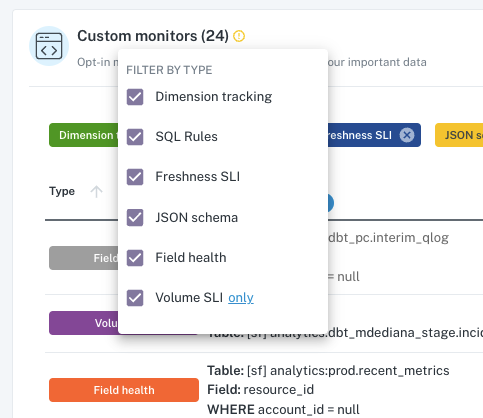
Filter by type of monitor
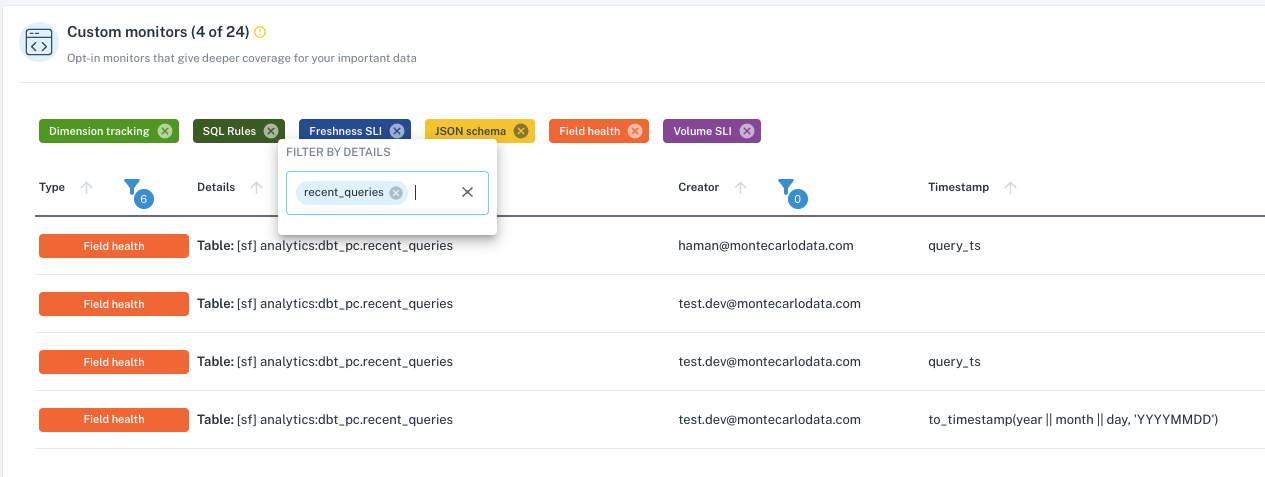
Filter by monitor details
You'll also notice that we have a quick little summary of some of the recent findings or incidents in your environment, and if I wanted to click in to learn more about these, you could either directly click on some of these numbers, or you can just toggle over to the incident feed.
The incident tab is going to have a feed of all the recent detections Monte Carlo has made in your environment, and you can quickly filter this down; so lets say for examples maybe I only want to see the recent freshness issues, I can click down and now it's just going to show me freshness. For example, I can see the most recent freshness issue we have detected in this environment was this issue where a table which normally updates every hour went seven hours without updating, and this is something that impacted 5 tables, one of which was a key table or really important table:
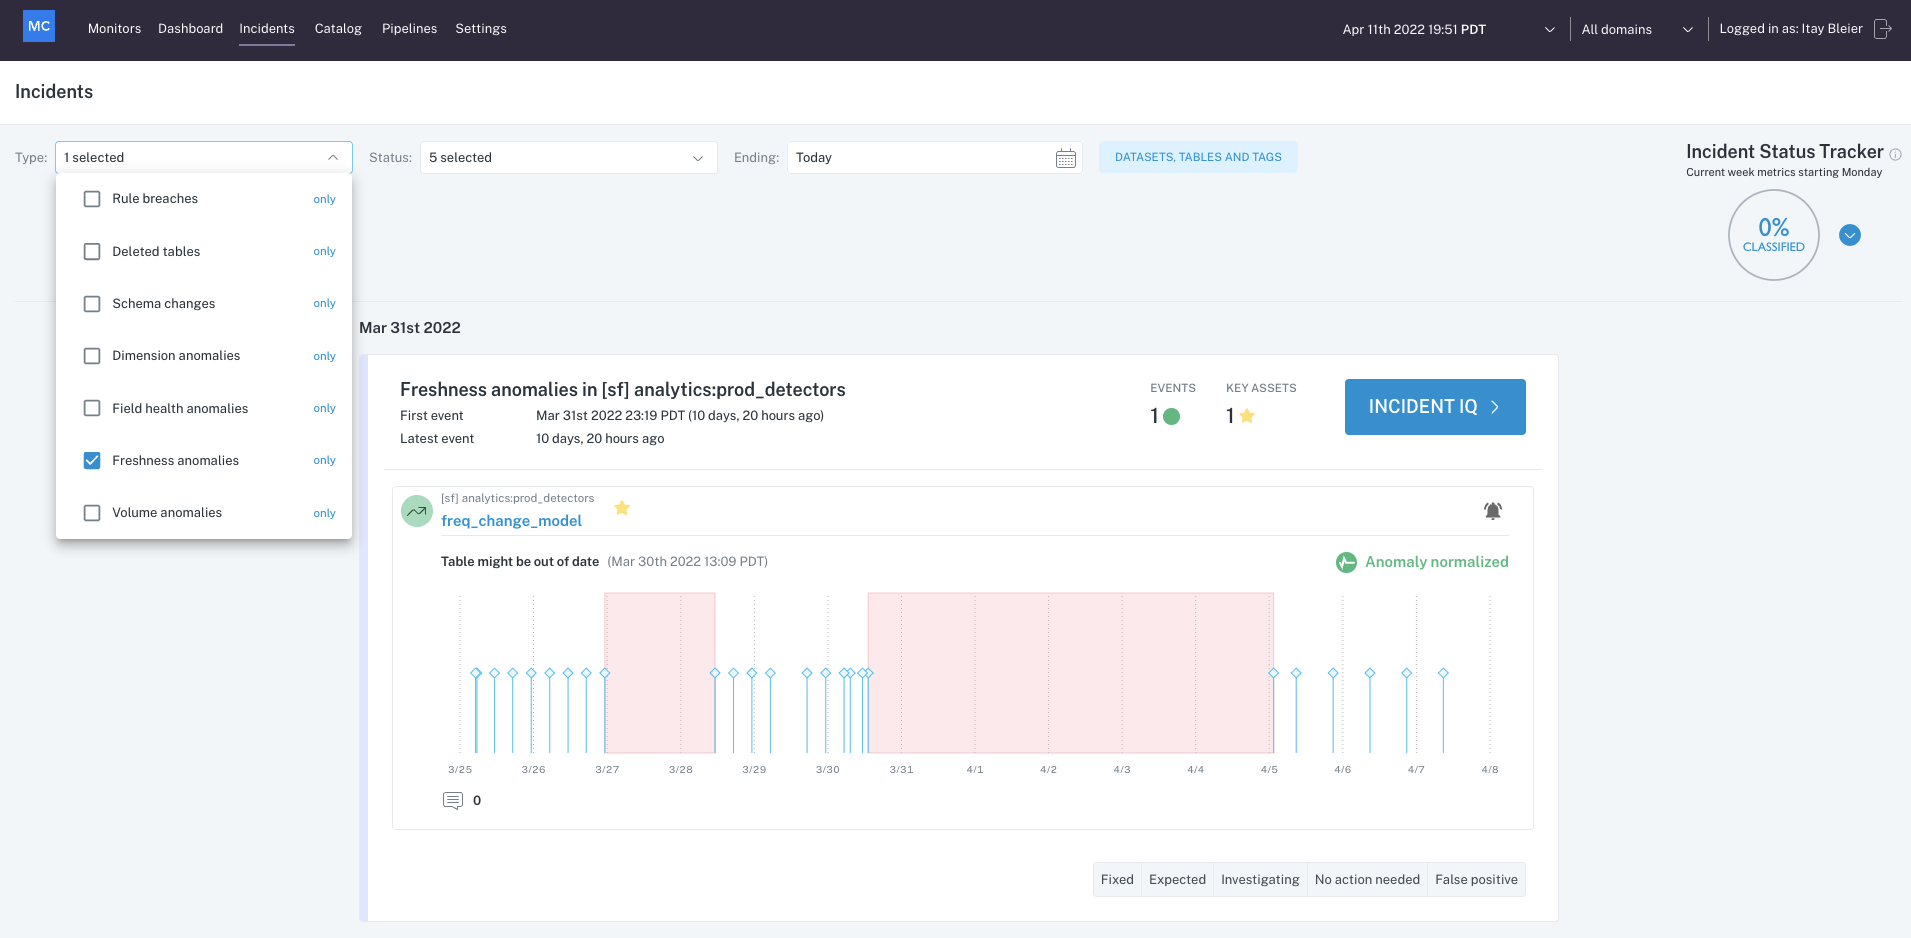
Incident Feed
I can also click directly into this, and it'll pull me into whats called the incident IQ page. Incident IQ is like a command center for you to triage an incident in Monte Carlo to understand what's happened, is it a big deal, what do I need to do about it. I can share more about that in a subsequent video:
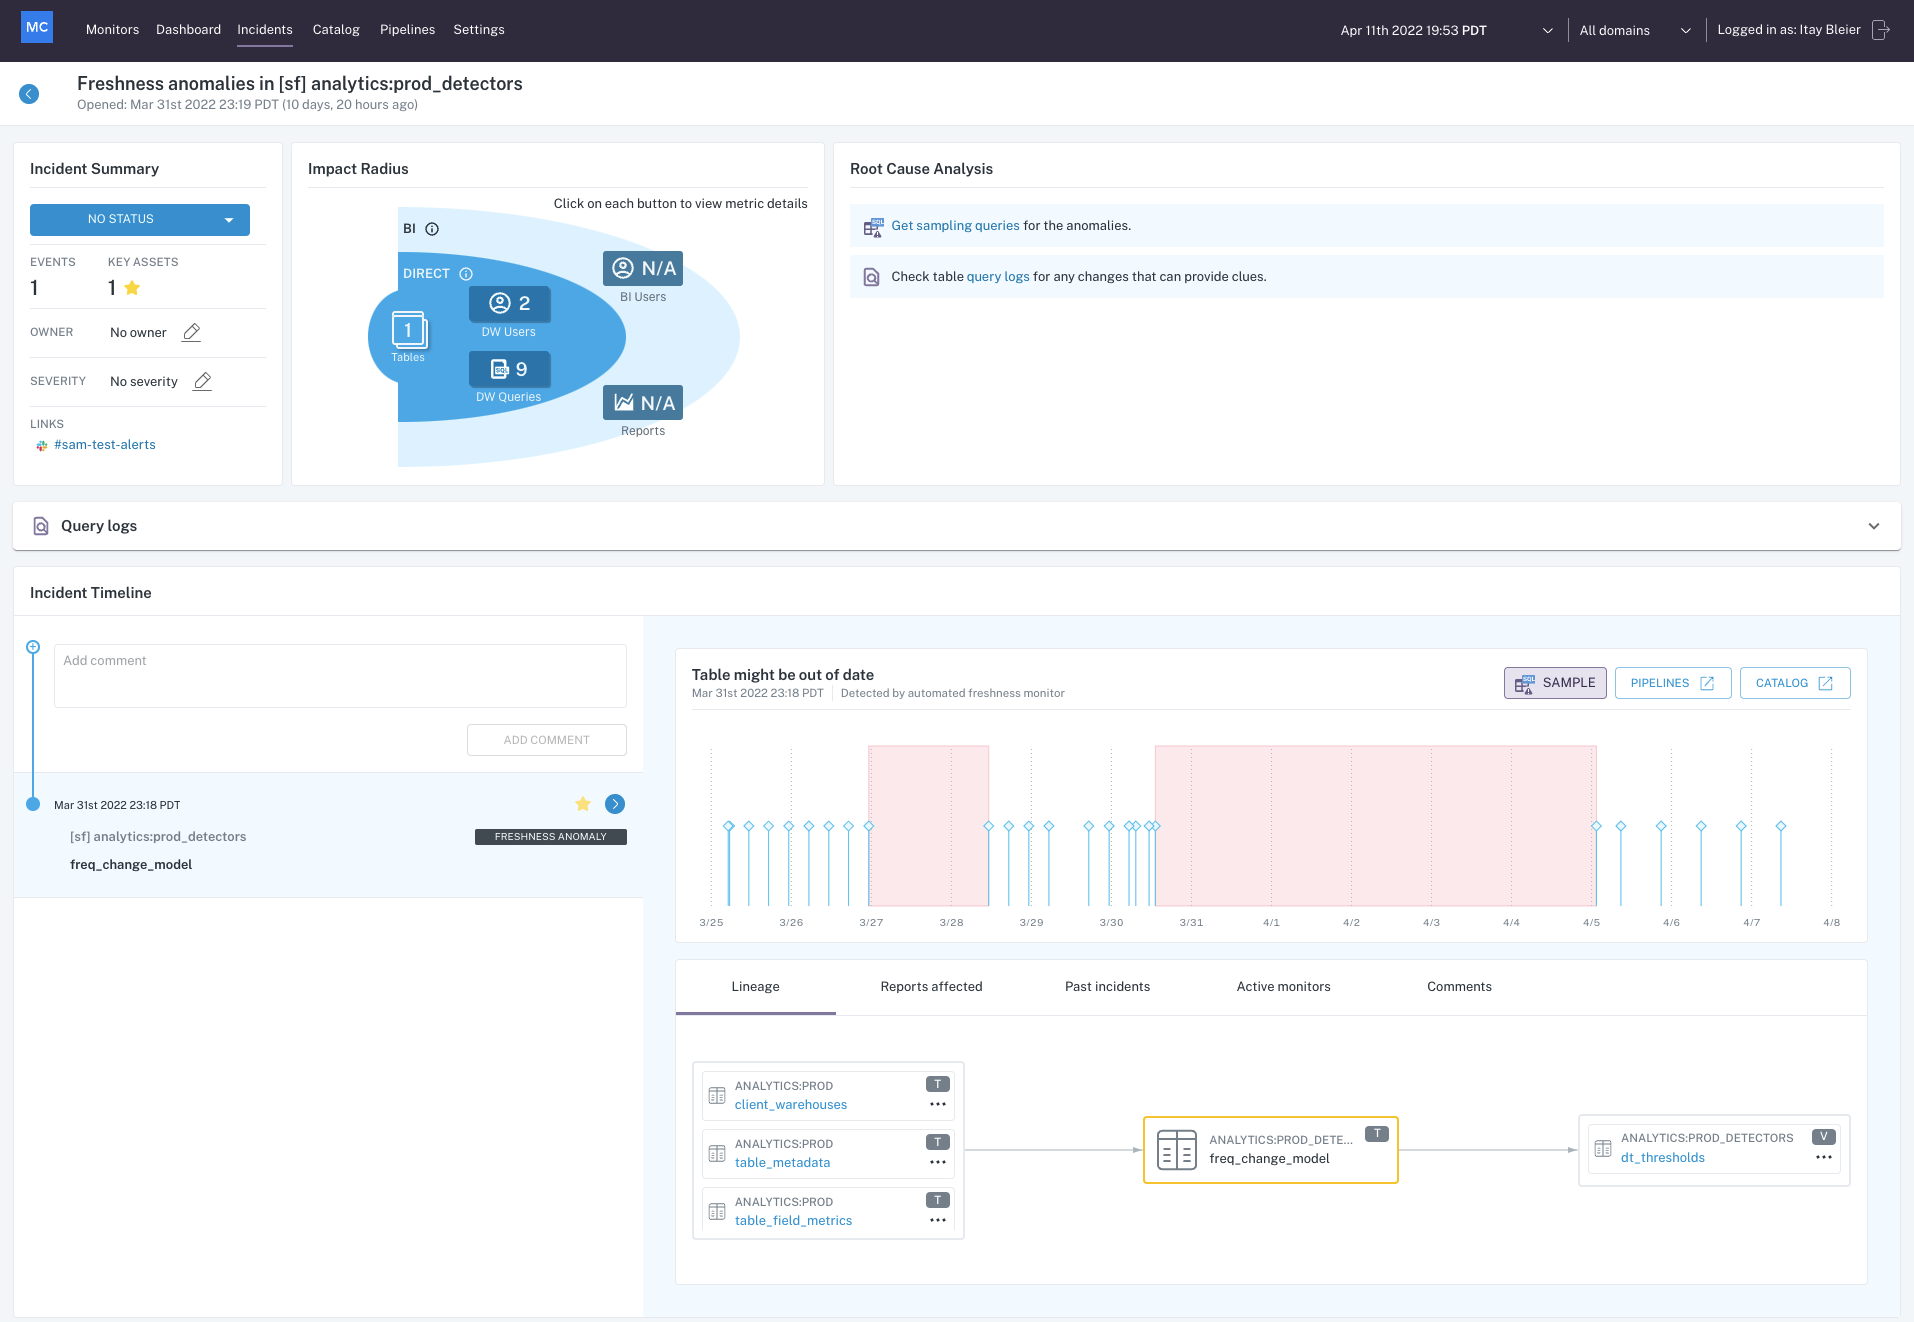
Incident IQ
Of course, it's easy to view these incidents within the UI, but it's also very easy to set up routing to send these incidents to go out to a slack channel or an email address or PagerDuty destination or some other sort of place outside of the Monte Carlo UI so you can more easily keep tabs on what are the different incidents that are being detected.
If you wanted to search for a particular table or view or BI report, you can search for that in catalog. I'll just search the word "customer", and I can quickly get a list of what are the tables or the BI reports or the specific fields that contain that keyword. If I click into any one of these, it pulls me into the catalog view for that particular table, and I have all different kinds of metrics and context about what this table is, where is it coming from, where does the data in here go, recent incidents or anomalies, tags, history of freshness and size, history of schema changes, field level lineage, all different sorts of things here:

Searching the catalog
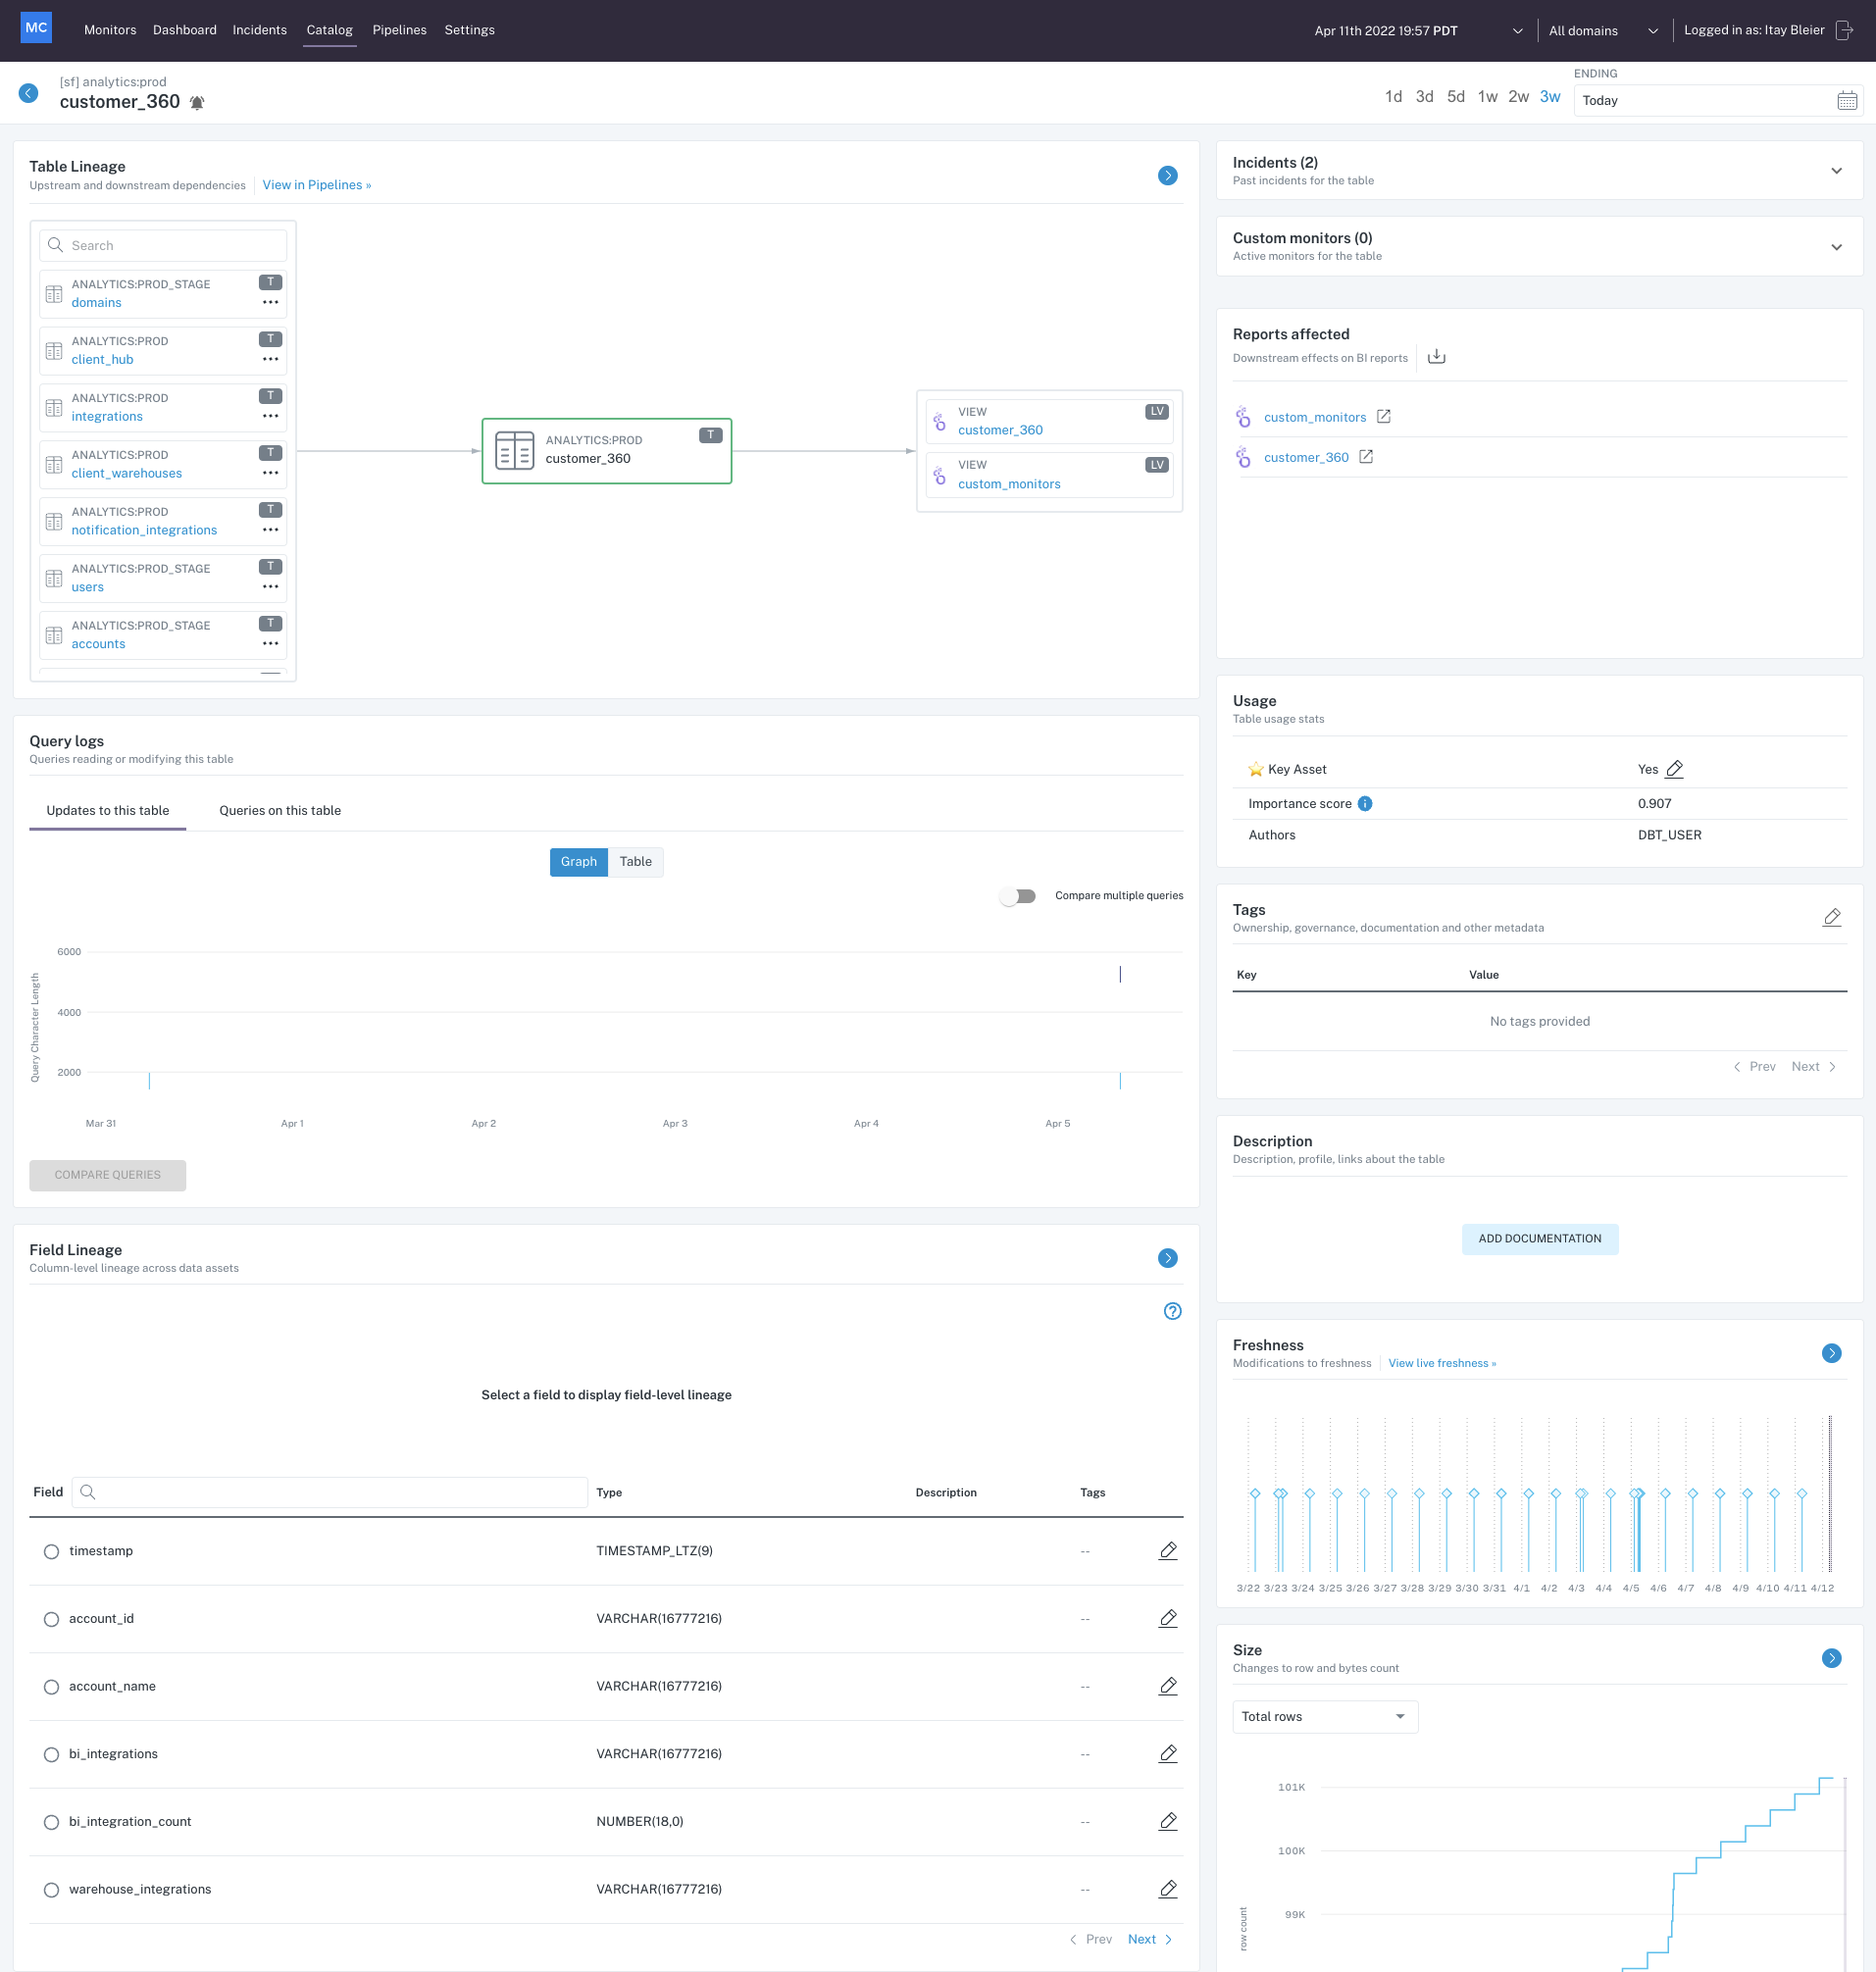
Catalog view
If I wanted to dive deeper into the lineage for any given table or BI report, I can go to the pipelines tab, and I can search and quickly explore the lineage from there. I'll search the word "customer" and specifically, I'll search the lineage for this "customer 360" table which is one that I use very often and Monte Carlo will present me with this living and breathing map of the lineage upstream of this table, but I can also quickly toggle it to view downstream. There is some different sorts of filters that I can apply here as well. For example, I can overlay onto this view the recent detections or recent incidents that Monte Carlo has seen on any of the different nodes on this lineage graph:
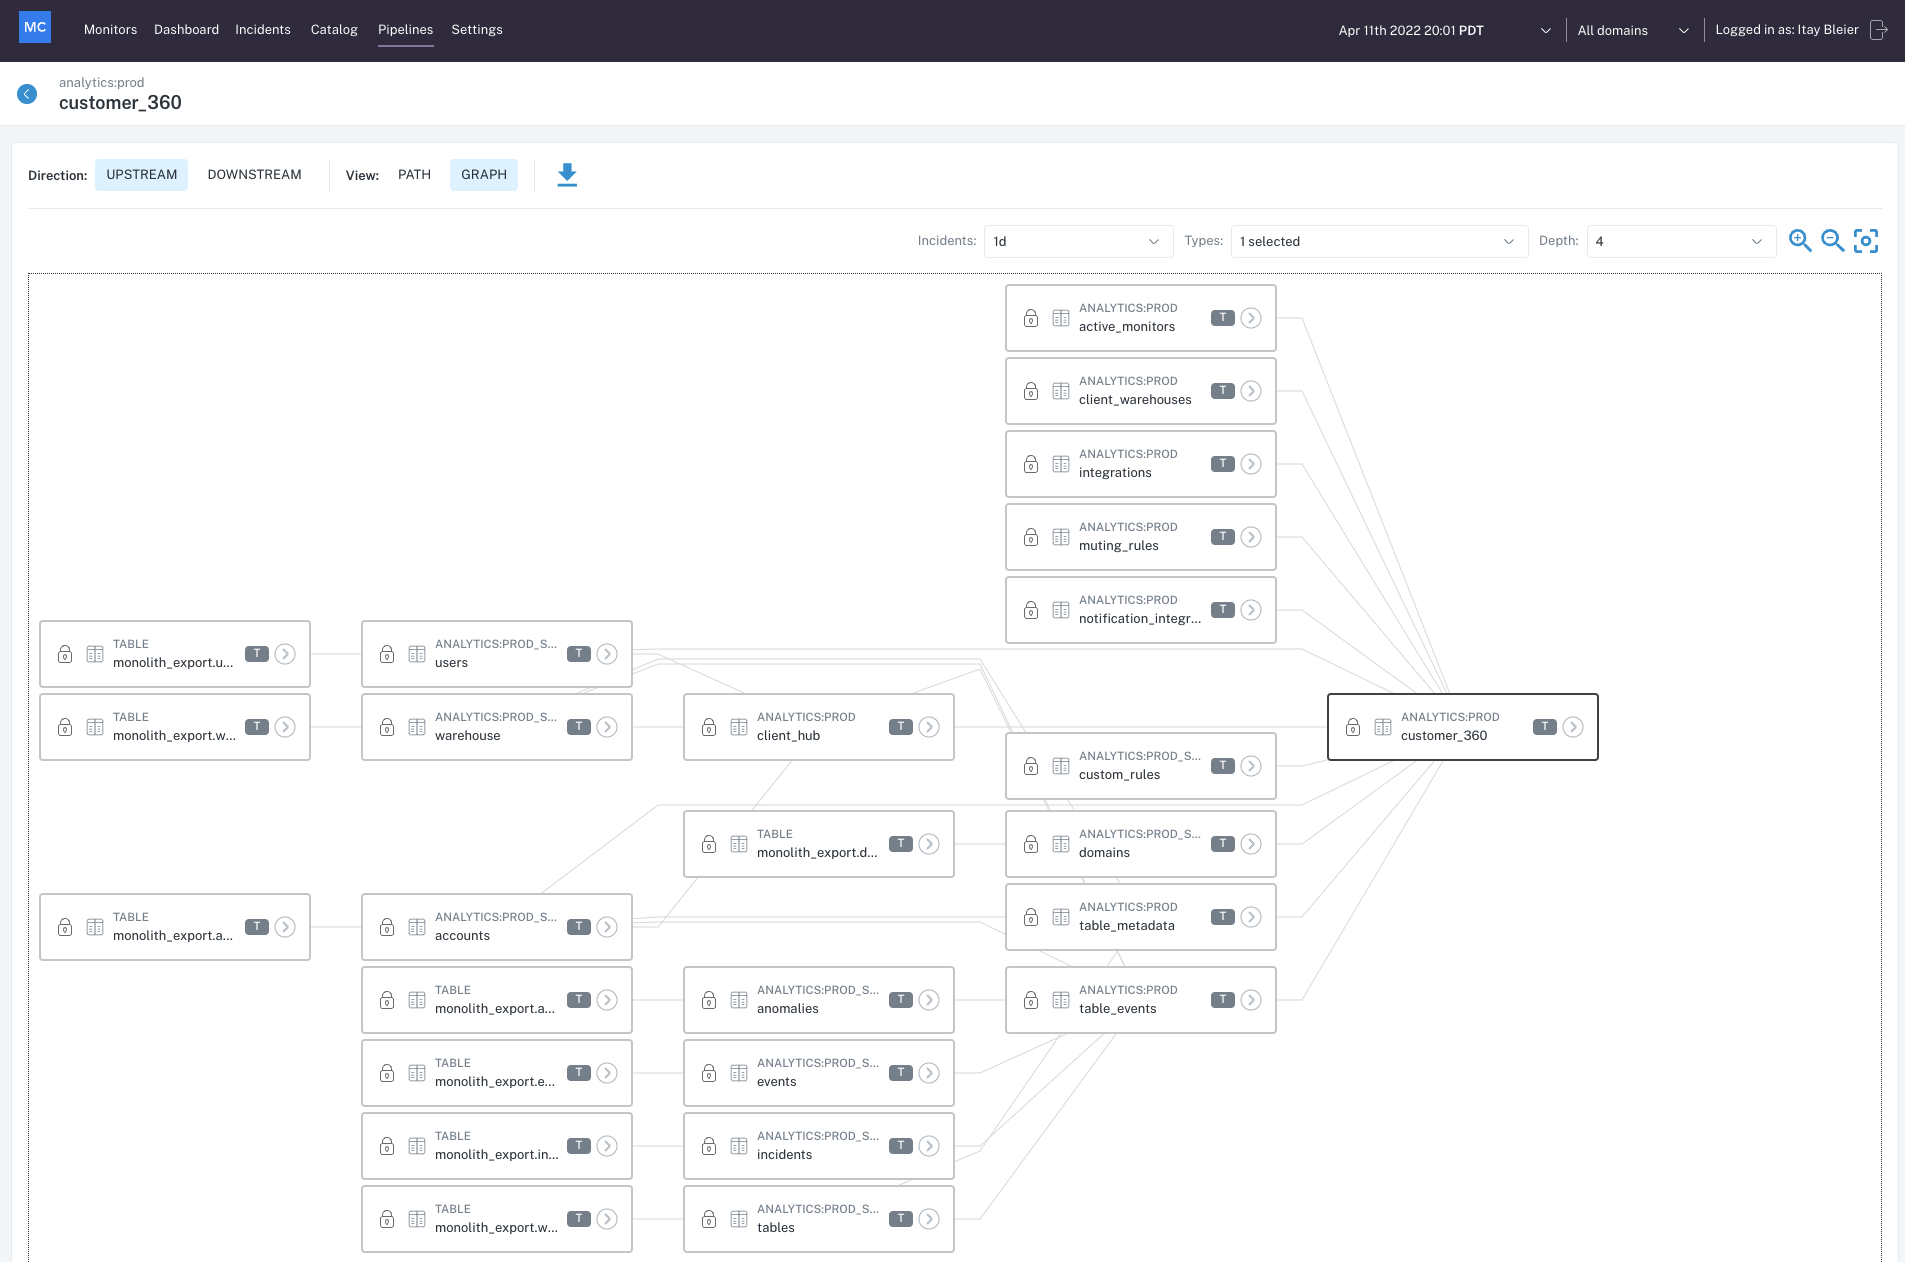
Pipelines - Lineage
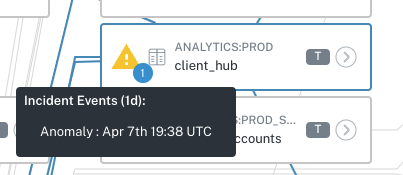
Current incidents surfaced in lineage
Lastly, Dashboard is where I can go to see a high level overview of my current data assets, the amount of incidents over the past month, their statuses, active monitors, and to download some different insights which come in a csv format which I can then use to explore this data further. We also offer this sort of pinboard experience where you can pin your most important tables and then keep tabs on if there is any sort of recent issue on any of them:
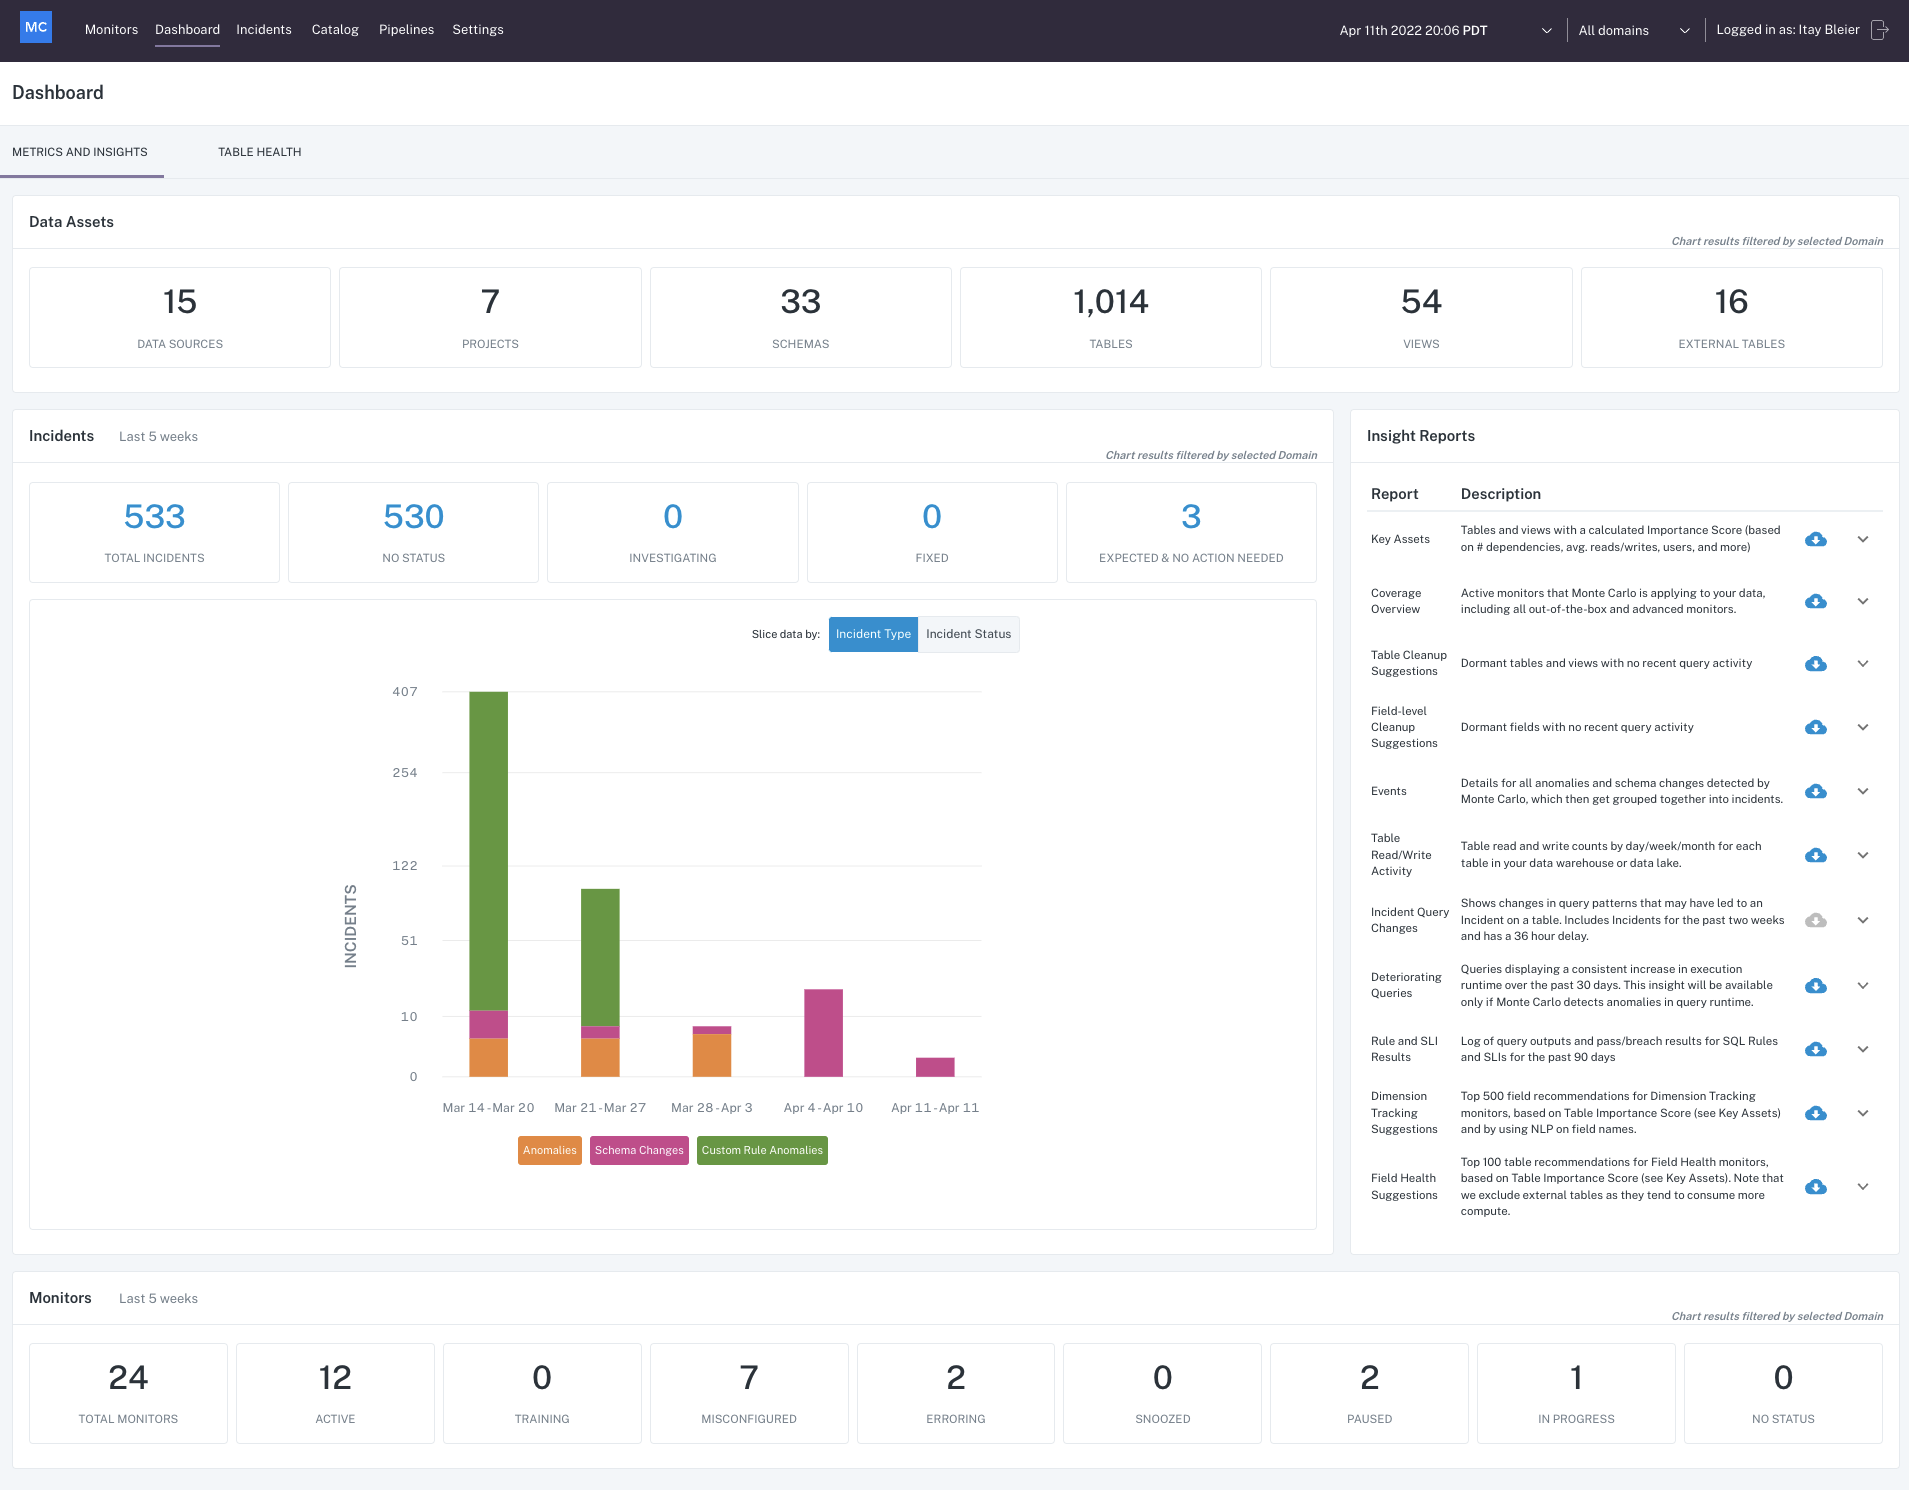
Dashboard
Settings is where I can go if i want to add users, configure routing for notifications to outside the application, or set up anything else like that. Lastly I'll add if you want to filter all the data that you are seeing in Monte Carlo down to just a particular domain worth of data, that is something that you can set up top here next to your timezone. You can select from any domains that have already been configured in your environment, or you have the appropriate permissions you can add a domain. A domain is essentially a set of dataset or project level filters or databases and schema level filters which let you define a set of data that you or a particular team will care about, and then you can apply that set of filters easily to your whole experience in Monte Carlo so you are just seeing monitors and incidents and resulting catalog items, all that stuff that aligns to the data that you care about:
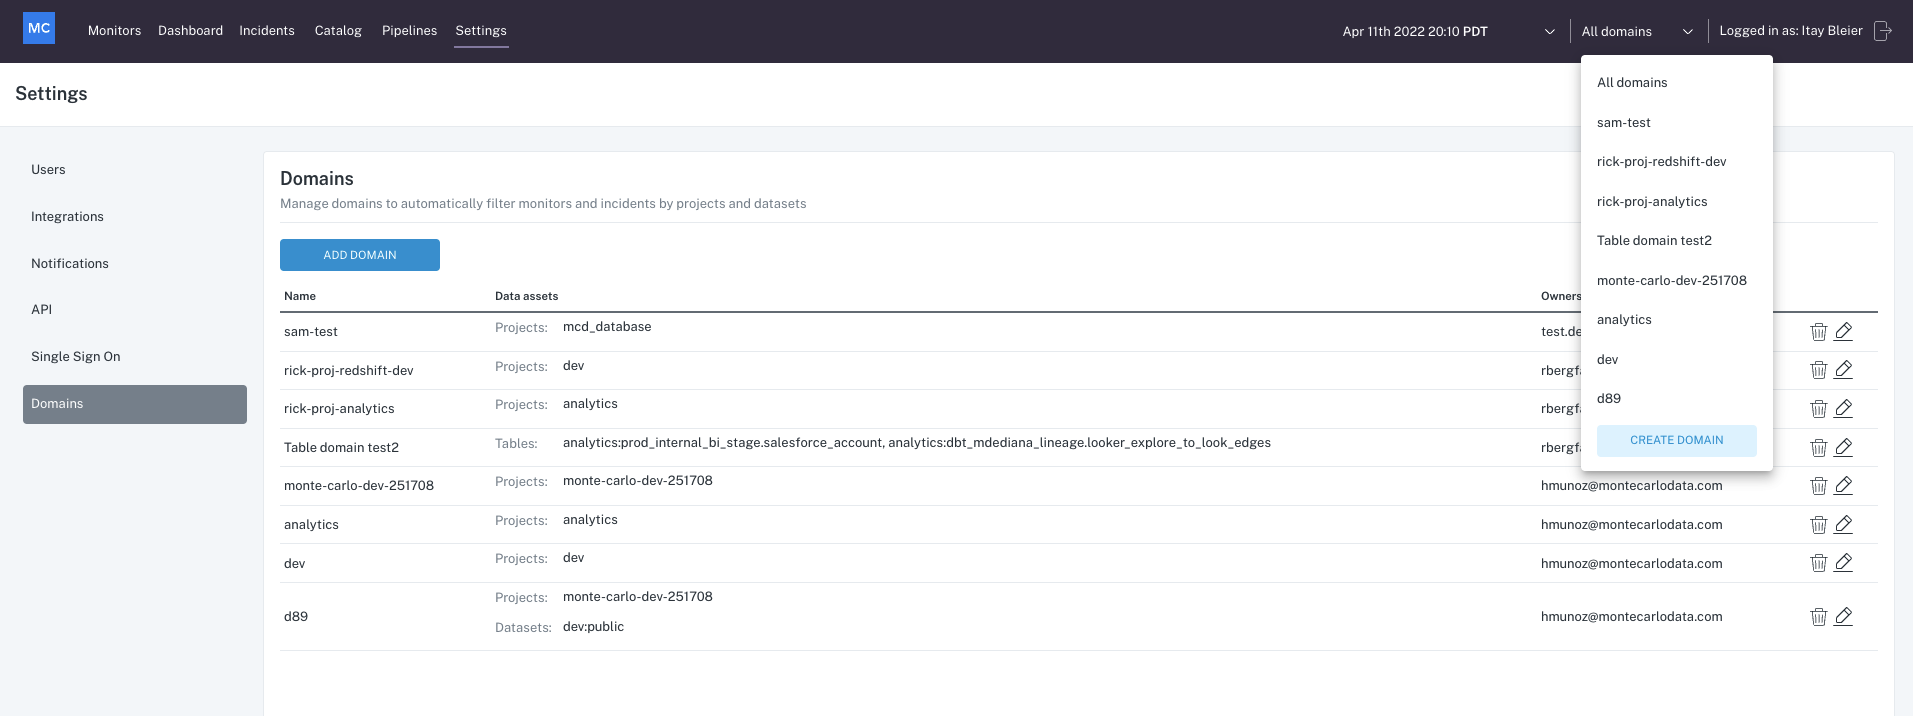
Domains
I hope this was helpful and please feel free to reach out to [email protected] or the chat bot in the lower right hand corner if you have any questions!
Updated 10 months ago
