Setting up JSON Schema Monitors
Last Updated: August 1, 2022
Please note JSON schema monitors are not supported on Athena or Spark clusters.
Transcript
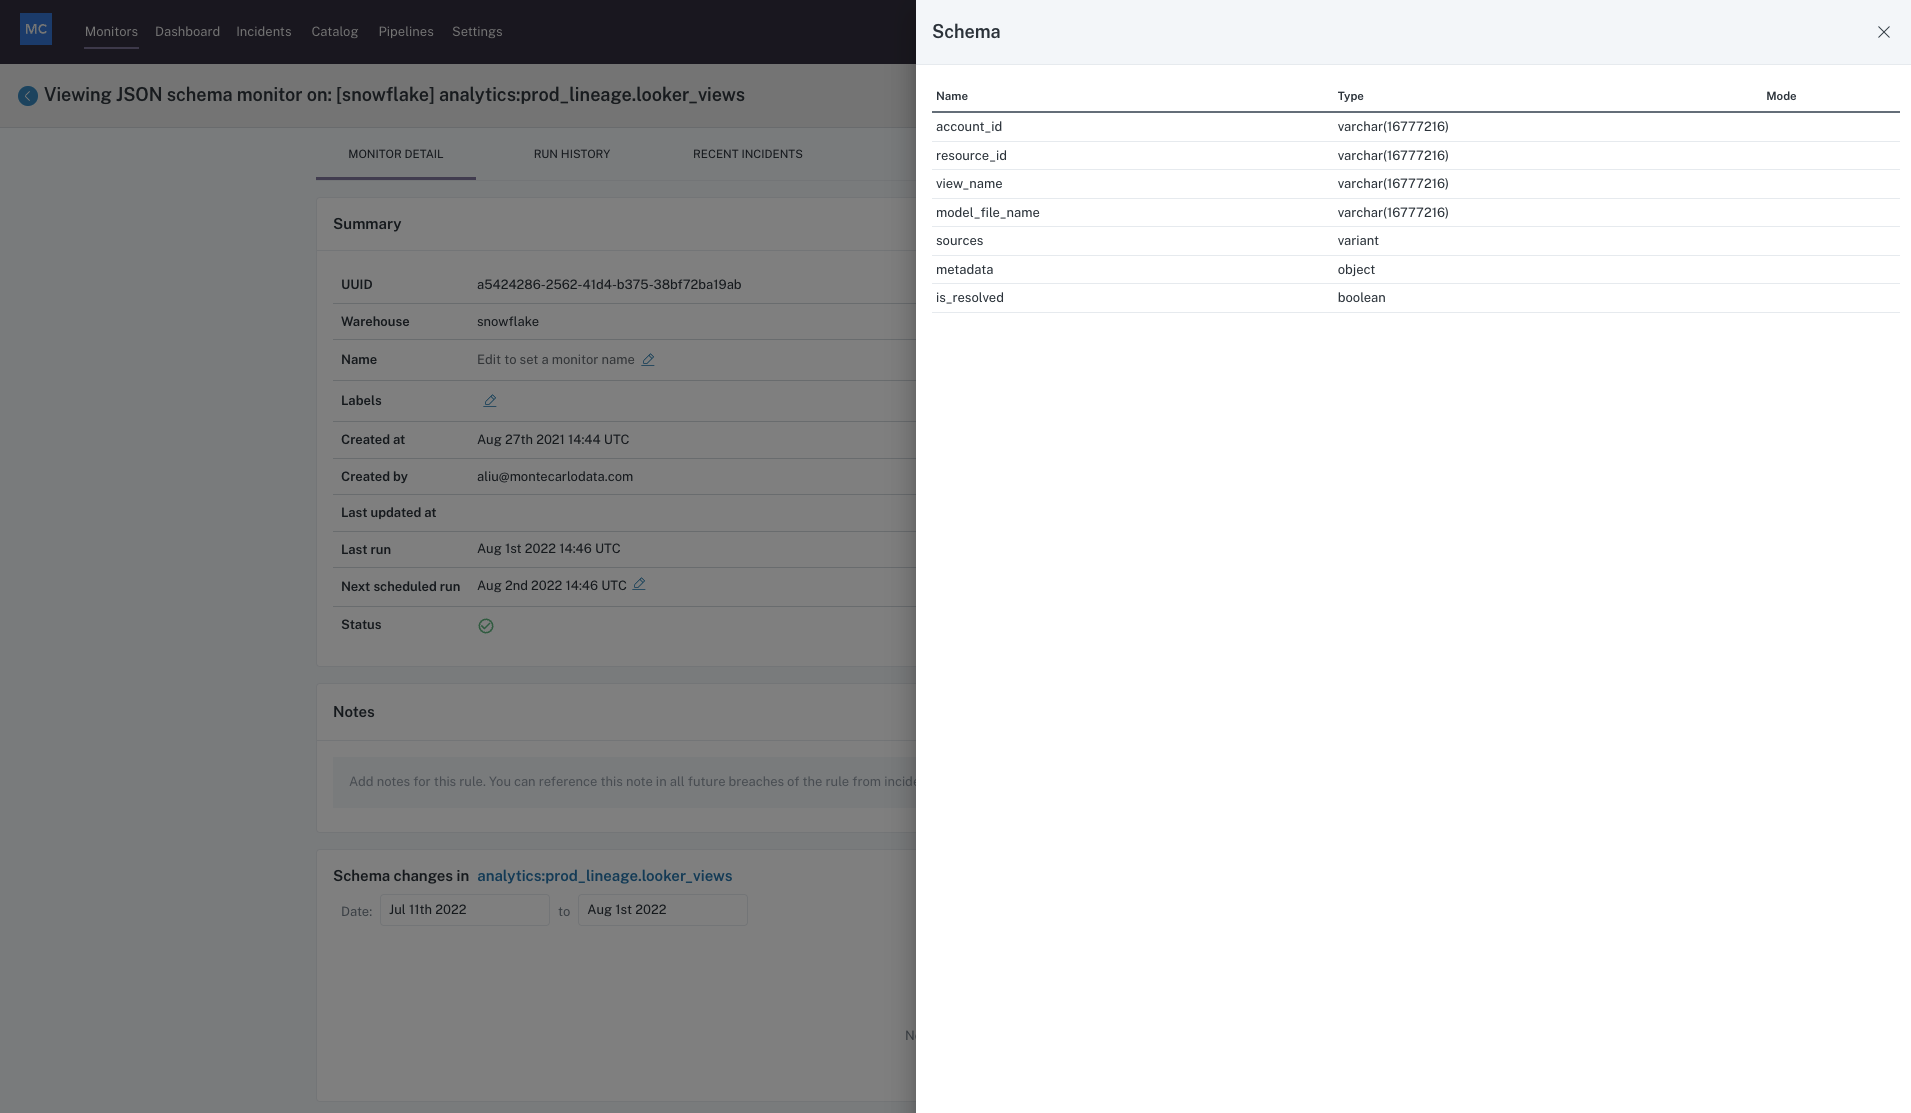
Welcome to Monte Carlo University! Today, I'll be going through our JSON schema monitor. With JSON schema monitors, you can actually monitor the nested JSON within a given field in your tables. When you set this up, we will parse the current schema based on the JSON within those tables and show you that here:

Schema of a table with JSON Monitoring Applied
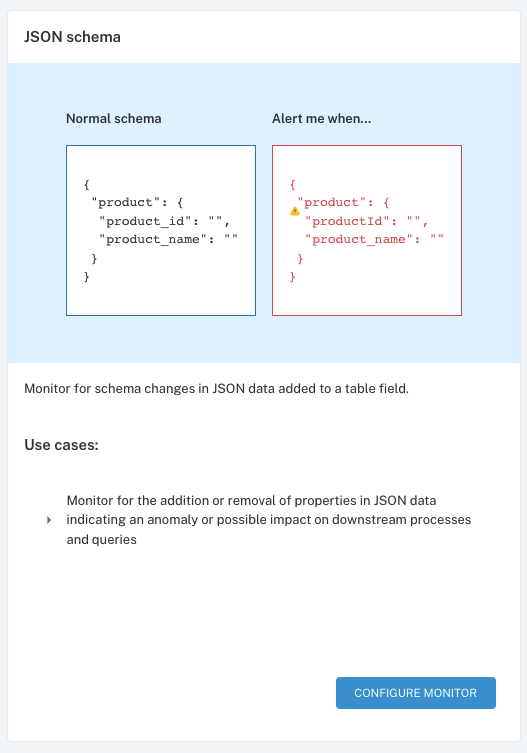
Over time, as we view any changes in distribution to the keys within that JSON, we will alert you in the case that the distribution changes, in the case that new keys appear, or keys that historically were available have disappeared in the newest day.
When setting up these monitors, you'll choose to create a new monitor and choose to configure monitor under the JSON schema option.

JSON Schema Monitor
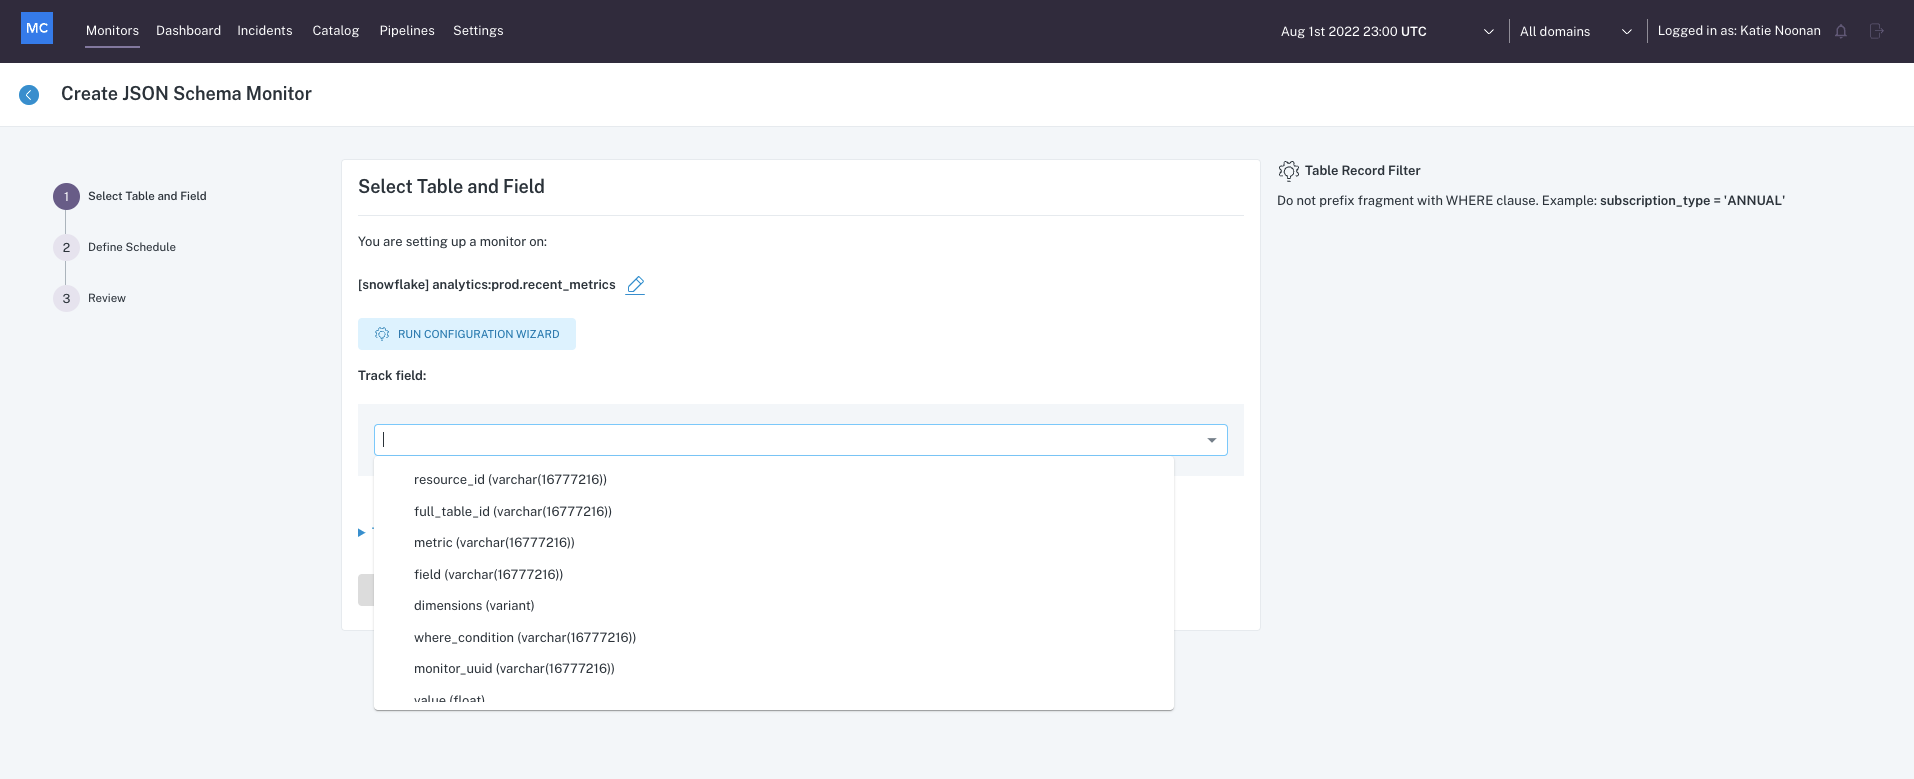
You first need to choose the table and then the field within that table that you want to monitor. Again, this will need to be a field that contains a JSON that you want to parse:

Column Options
Once you've chosen that field, you then have the option to choose a timestamp field on the table. This is leveraged to look at the newest data added to the table over time to alert you of those changes in the actual keys within the JSON and the distribution changes as well:

Timestamp Options
Hopefully this was helpful and feel free to reach out if you have any questions!
Updated 10 months ago
