Setting up Field Health Monitors
This tutorial will review the steps of making a Field Health monitor in Monte Carlo. Field Health monitors are a great way to add extra insurance and deeper statistical coverage on tables or views that are important to your pipeline. For example, if you are interested in better understanding the null rate or want to be alerted to any big fluctuations in the percent unique or percent negative or mean values for any columns in a table, Field Health monitors will help you do that!
Last Updated: April 11, 2022
Transcript
To add a Field Health monitor for any table or view in Monte Carlo, land on the "Monitors" tab and click on "Create New Monitor":
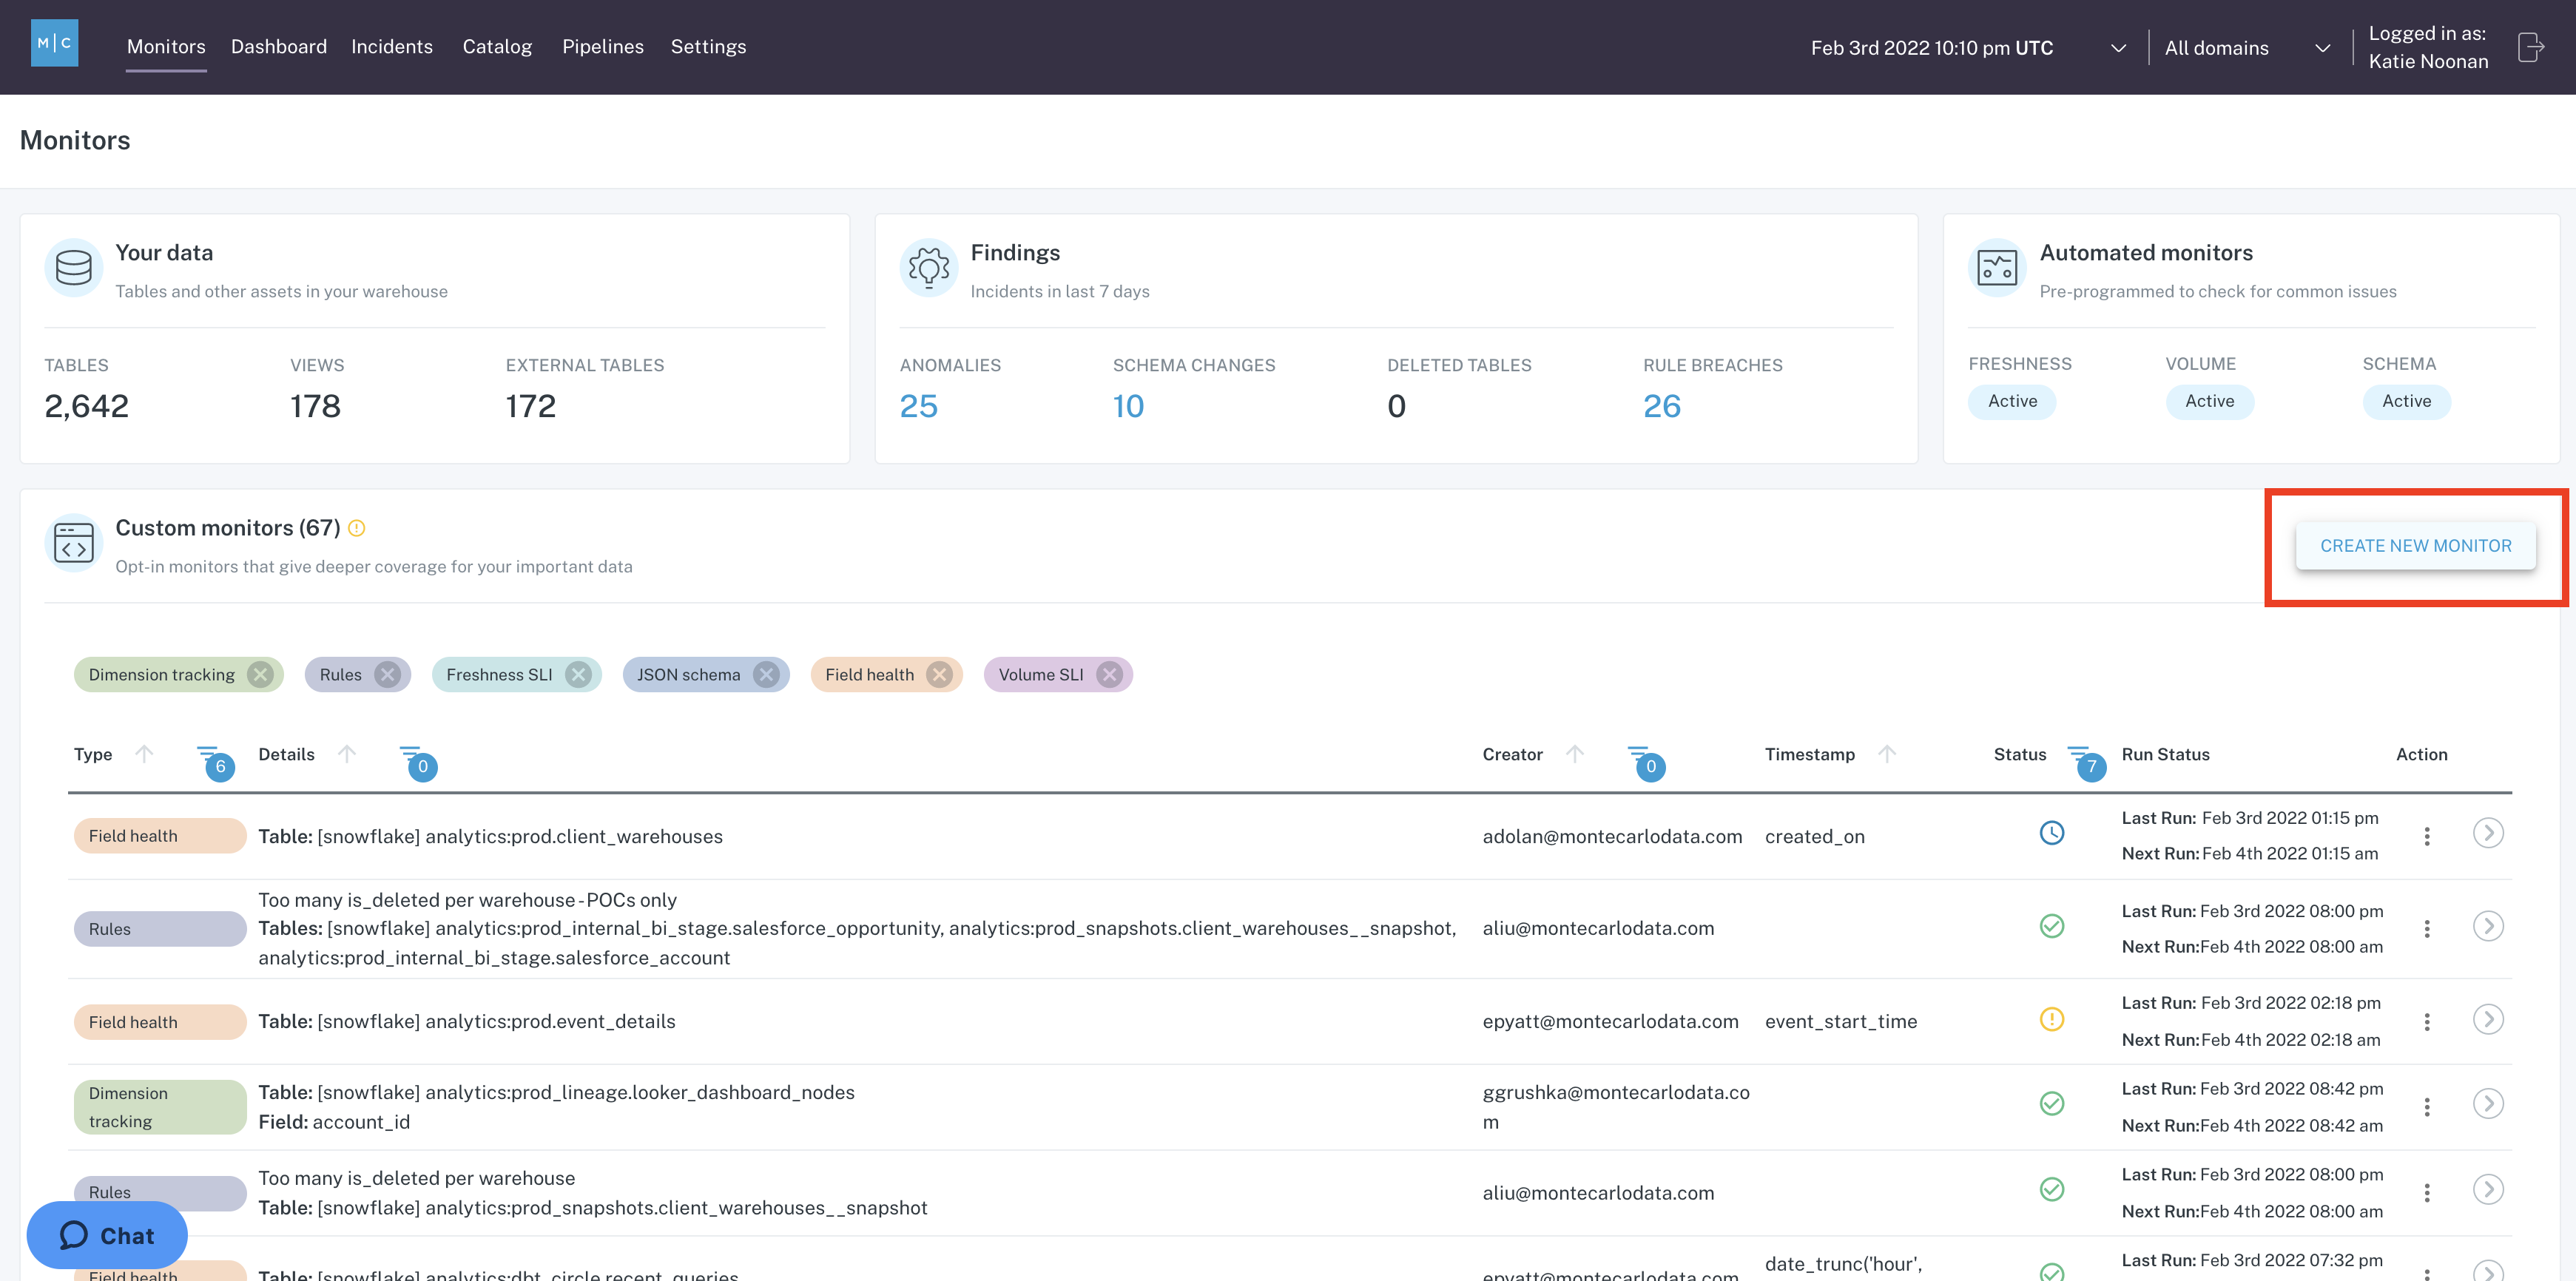
Monitors Tab
This is where you will be presented with the menu of options for different sorts of opt in monitors that you can add through Monte Carlo. In this case, we are going to add a Field Health monitor, which is great if you want to add extra insurance and deeper statistical coverage on tables or views that are very important to you. For example, if you are really interested in better understanding the null rate or want to be alerted to any big fluctuations in the percent unique or percent negative, or mean values for any columns in a table, Field Health is great.
Click "Configure Monitor" in the Field Health card:
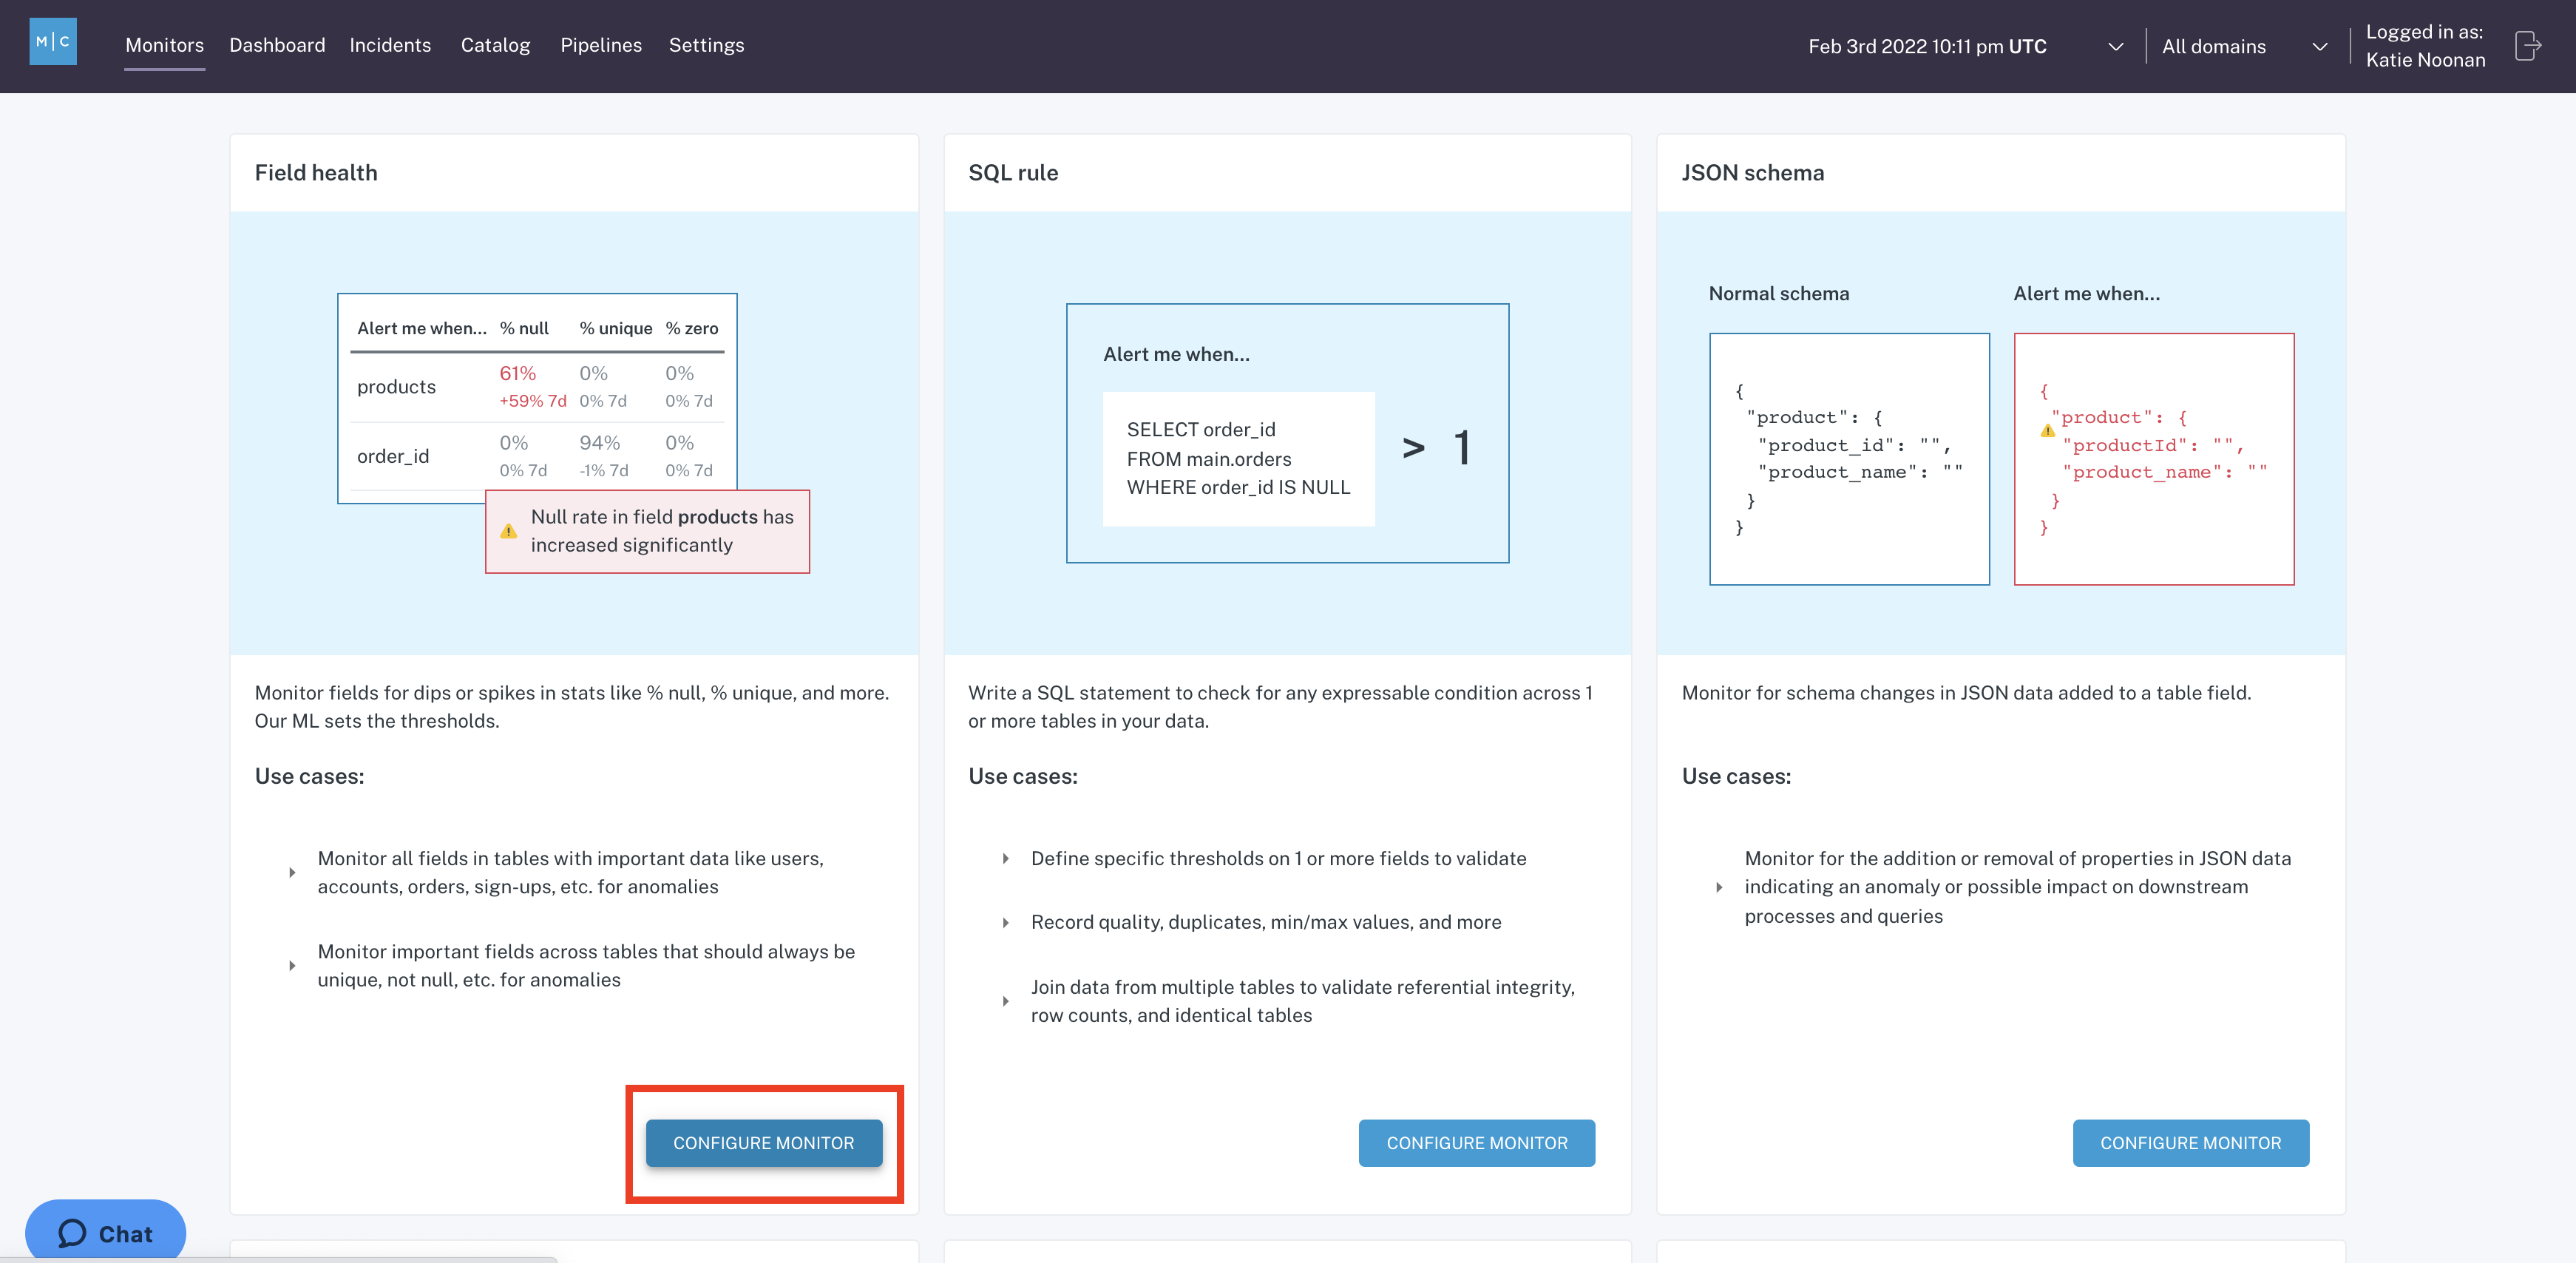
Advanced Monitors Tab
Next, select the table you want to add this monitor to. In this case, we are going to add it to a table that is really important to us, which is the customer360 table. It's where we unify a lot of our customer data, and you can click "Continue":
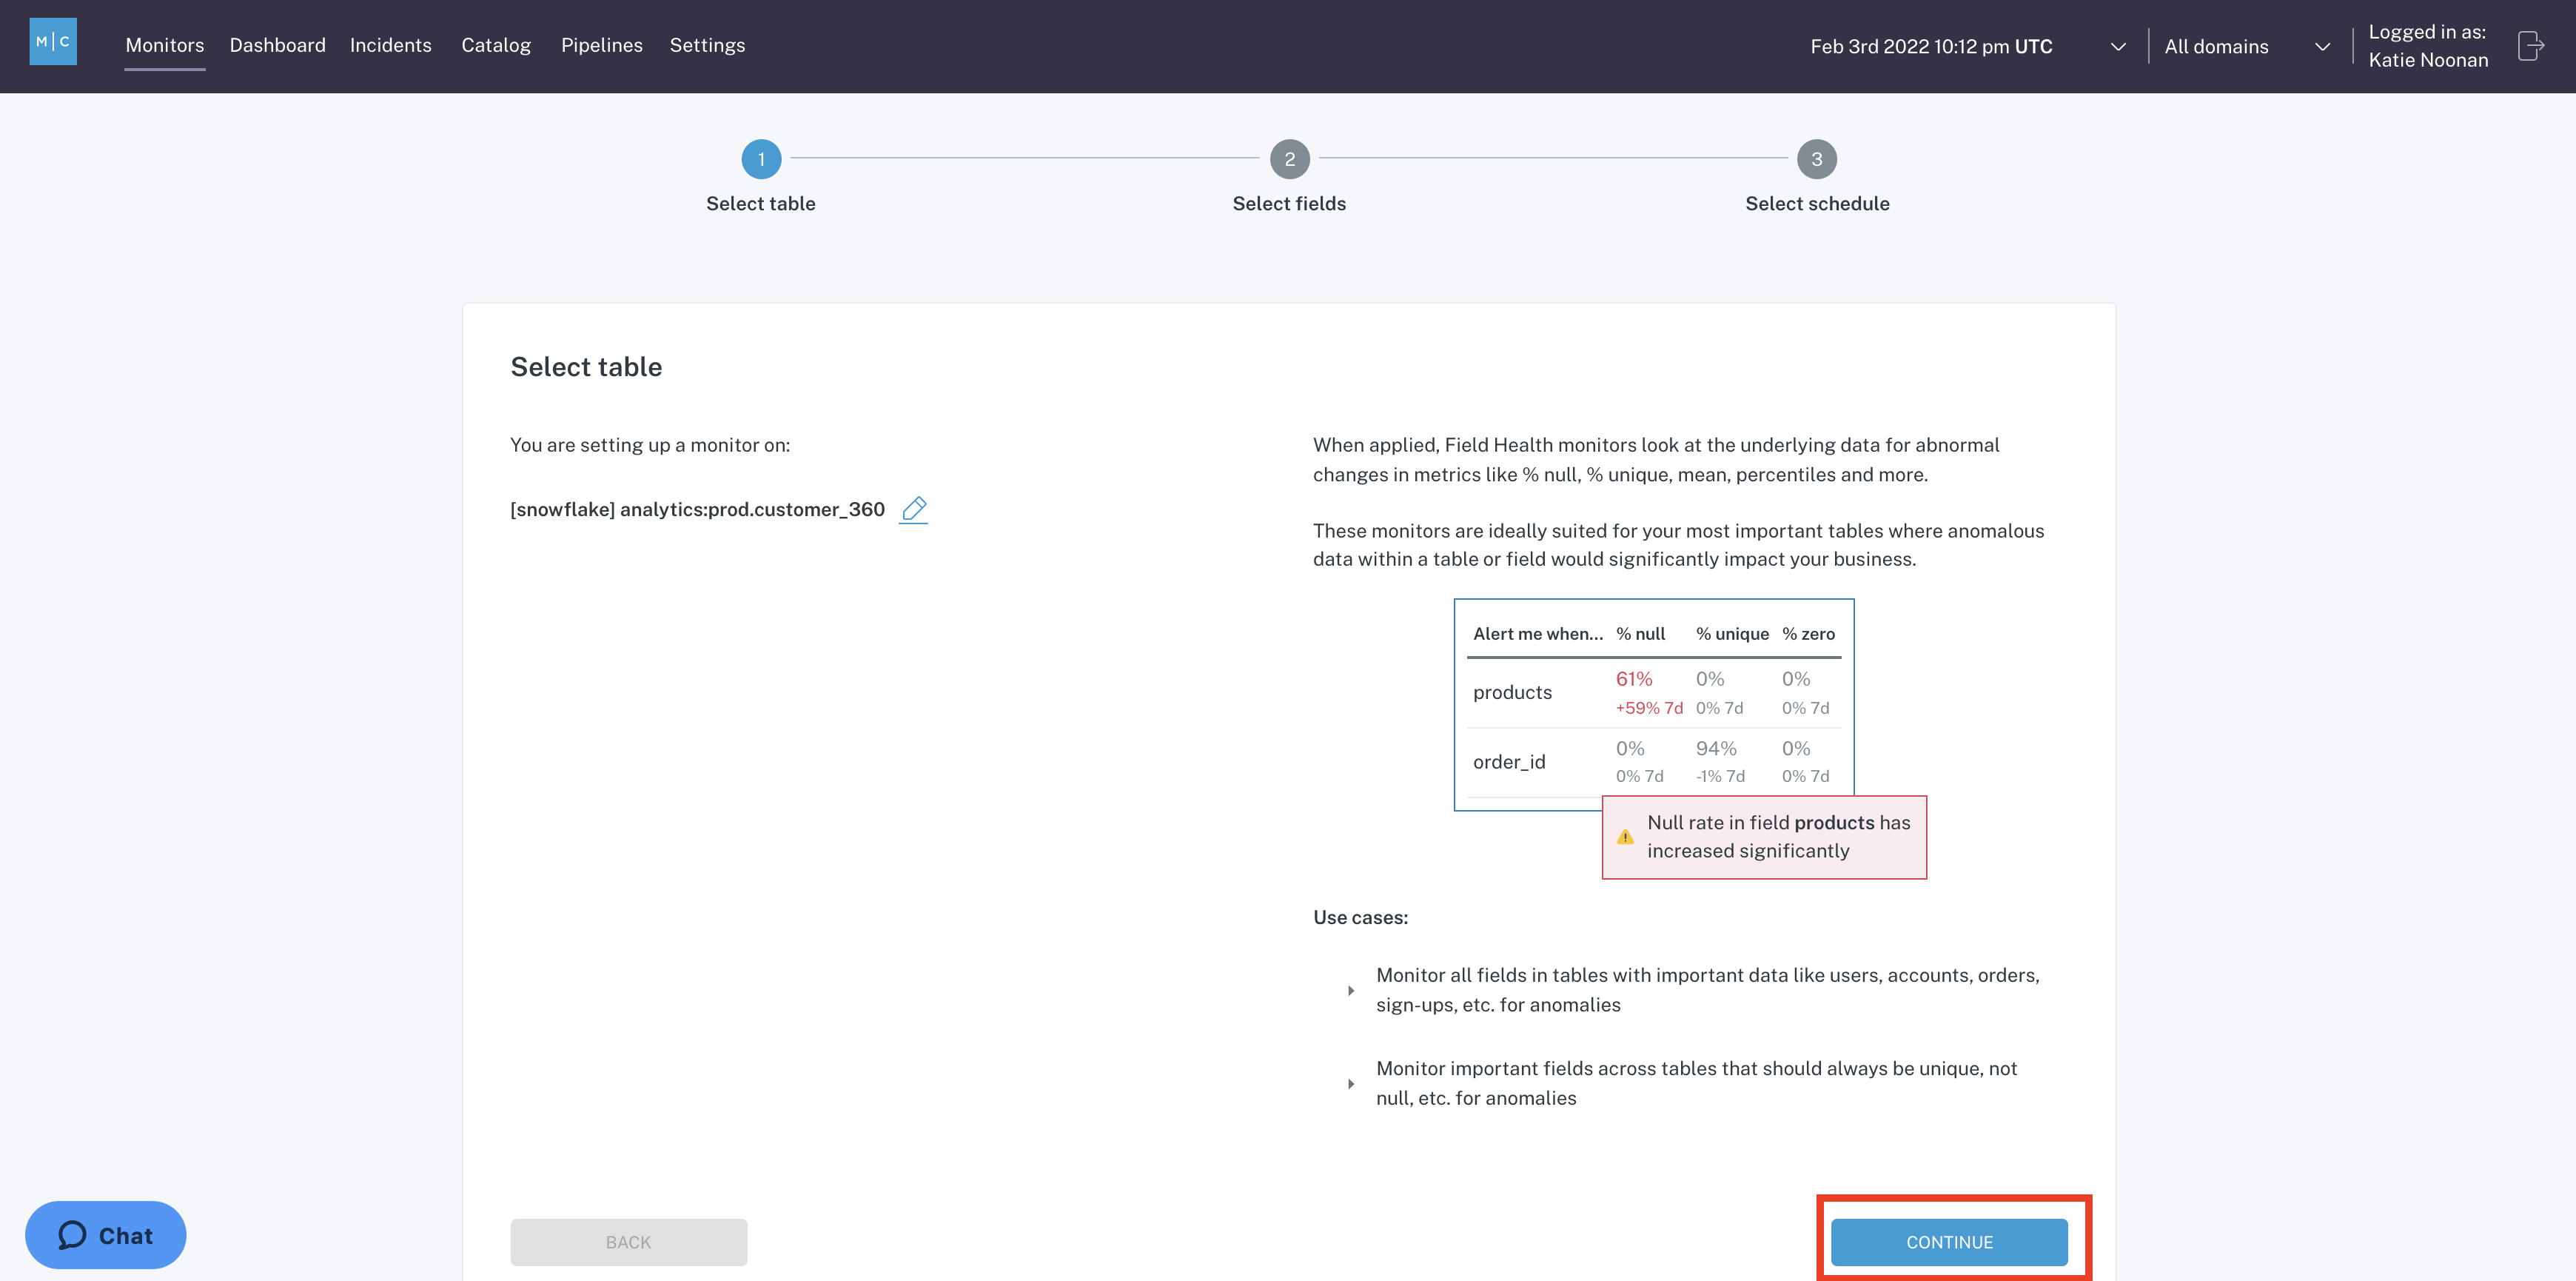
Select a table or view
Our default approach is to monitor all fields within the selected table. We do this because oftentimes it can be difficult to predict when and where data issues might emerge, and so we think providing coverage on all fields is a good way to handle that sort of issue. If you do want to apply Field Health to very specific columns, unclick the "Monitor all fields" box and then you can opt in specific fields that you'd want to monitor, which is good if you have an exceptionally wide table with perhaps many hundreds of columns, and so you want to monitor a handful of your most important ones:
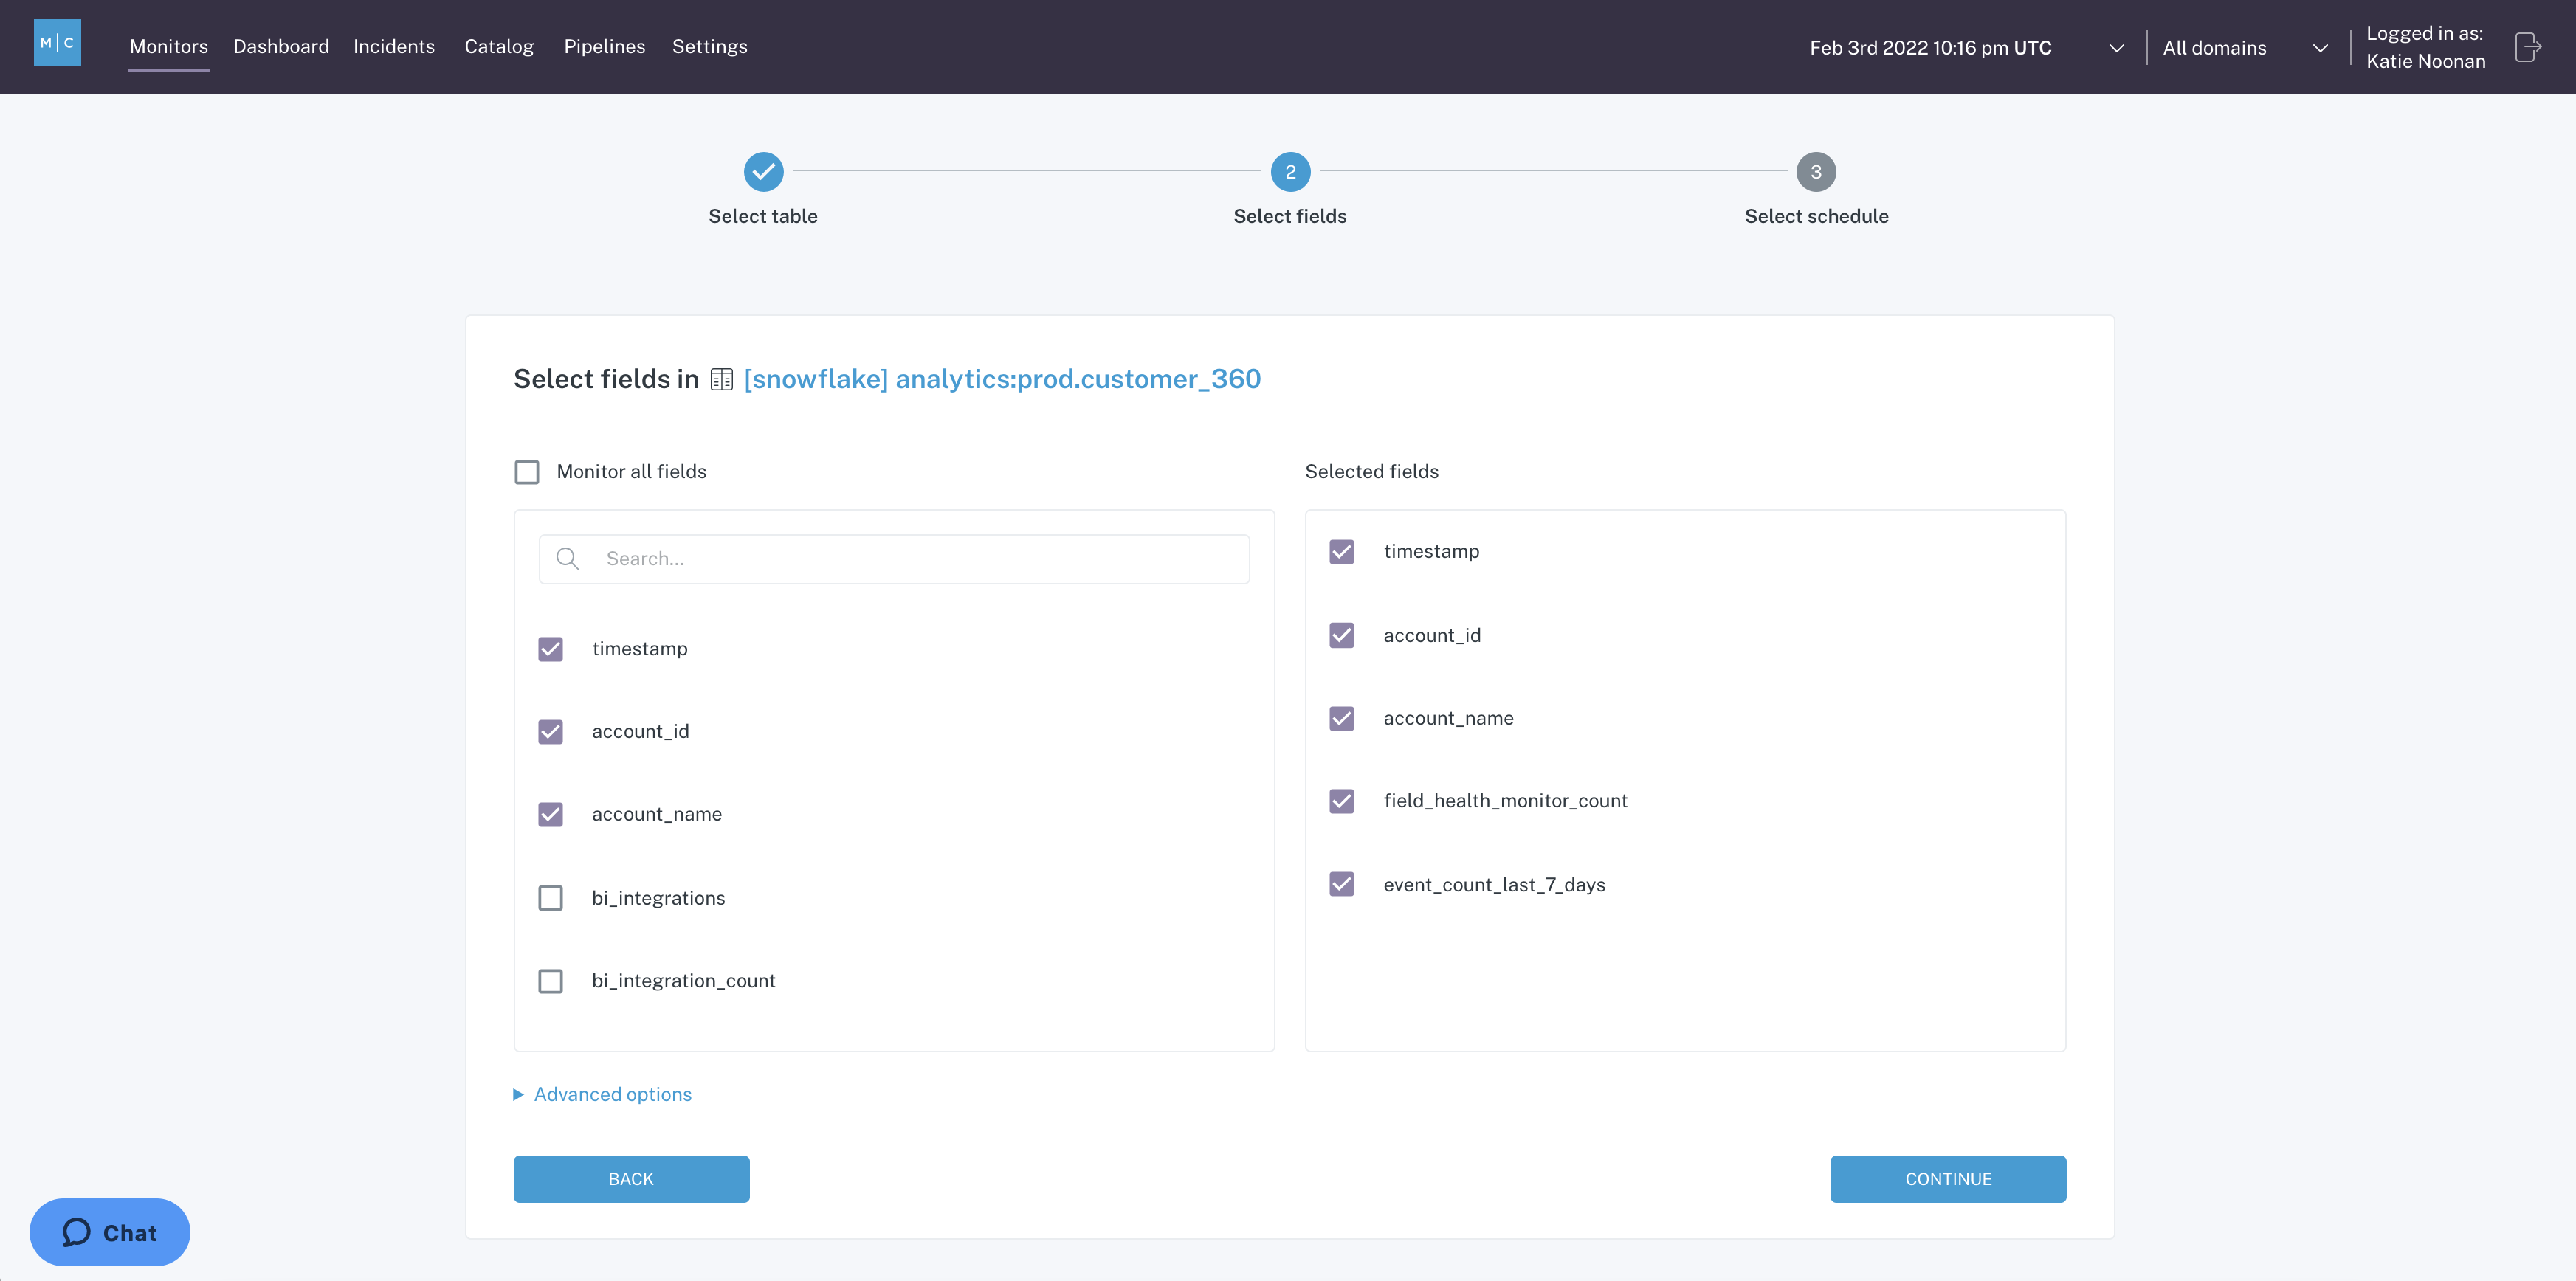
Select fields
In most cases, it's appropriate to leave it on "Monitors all fields". You also have the option here if you wanted to zero in on a segment of your data. You can apply a SQL "where" clause to monitor a portion of the data:
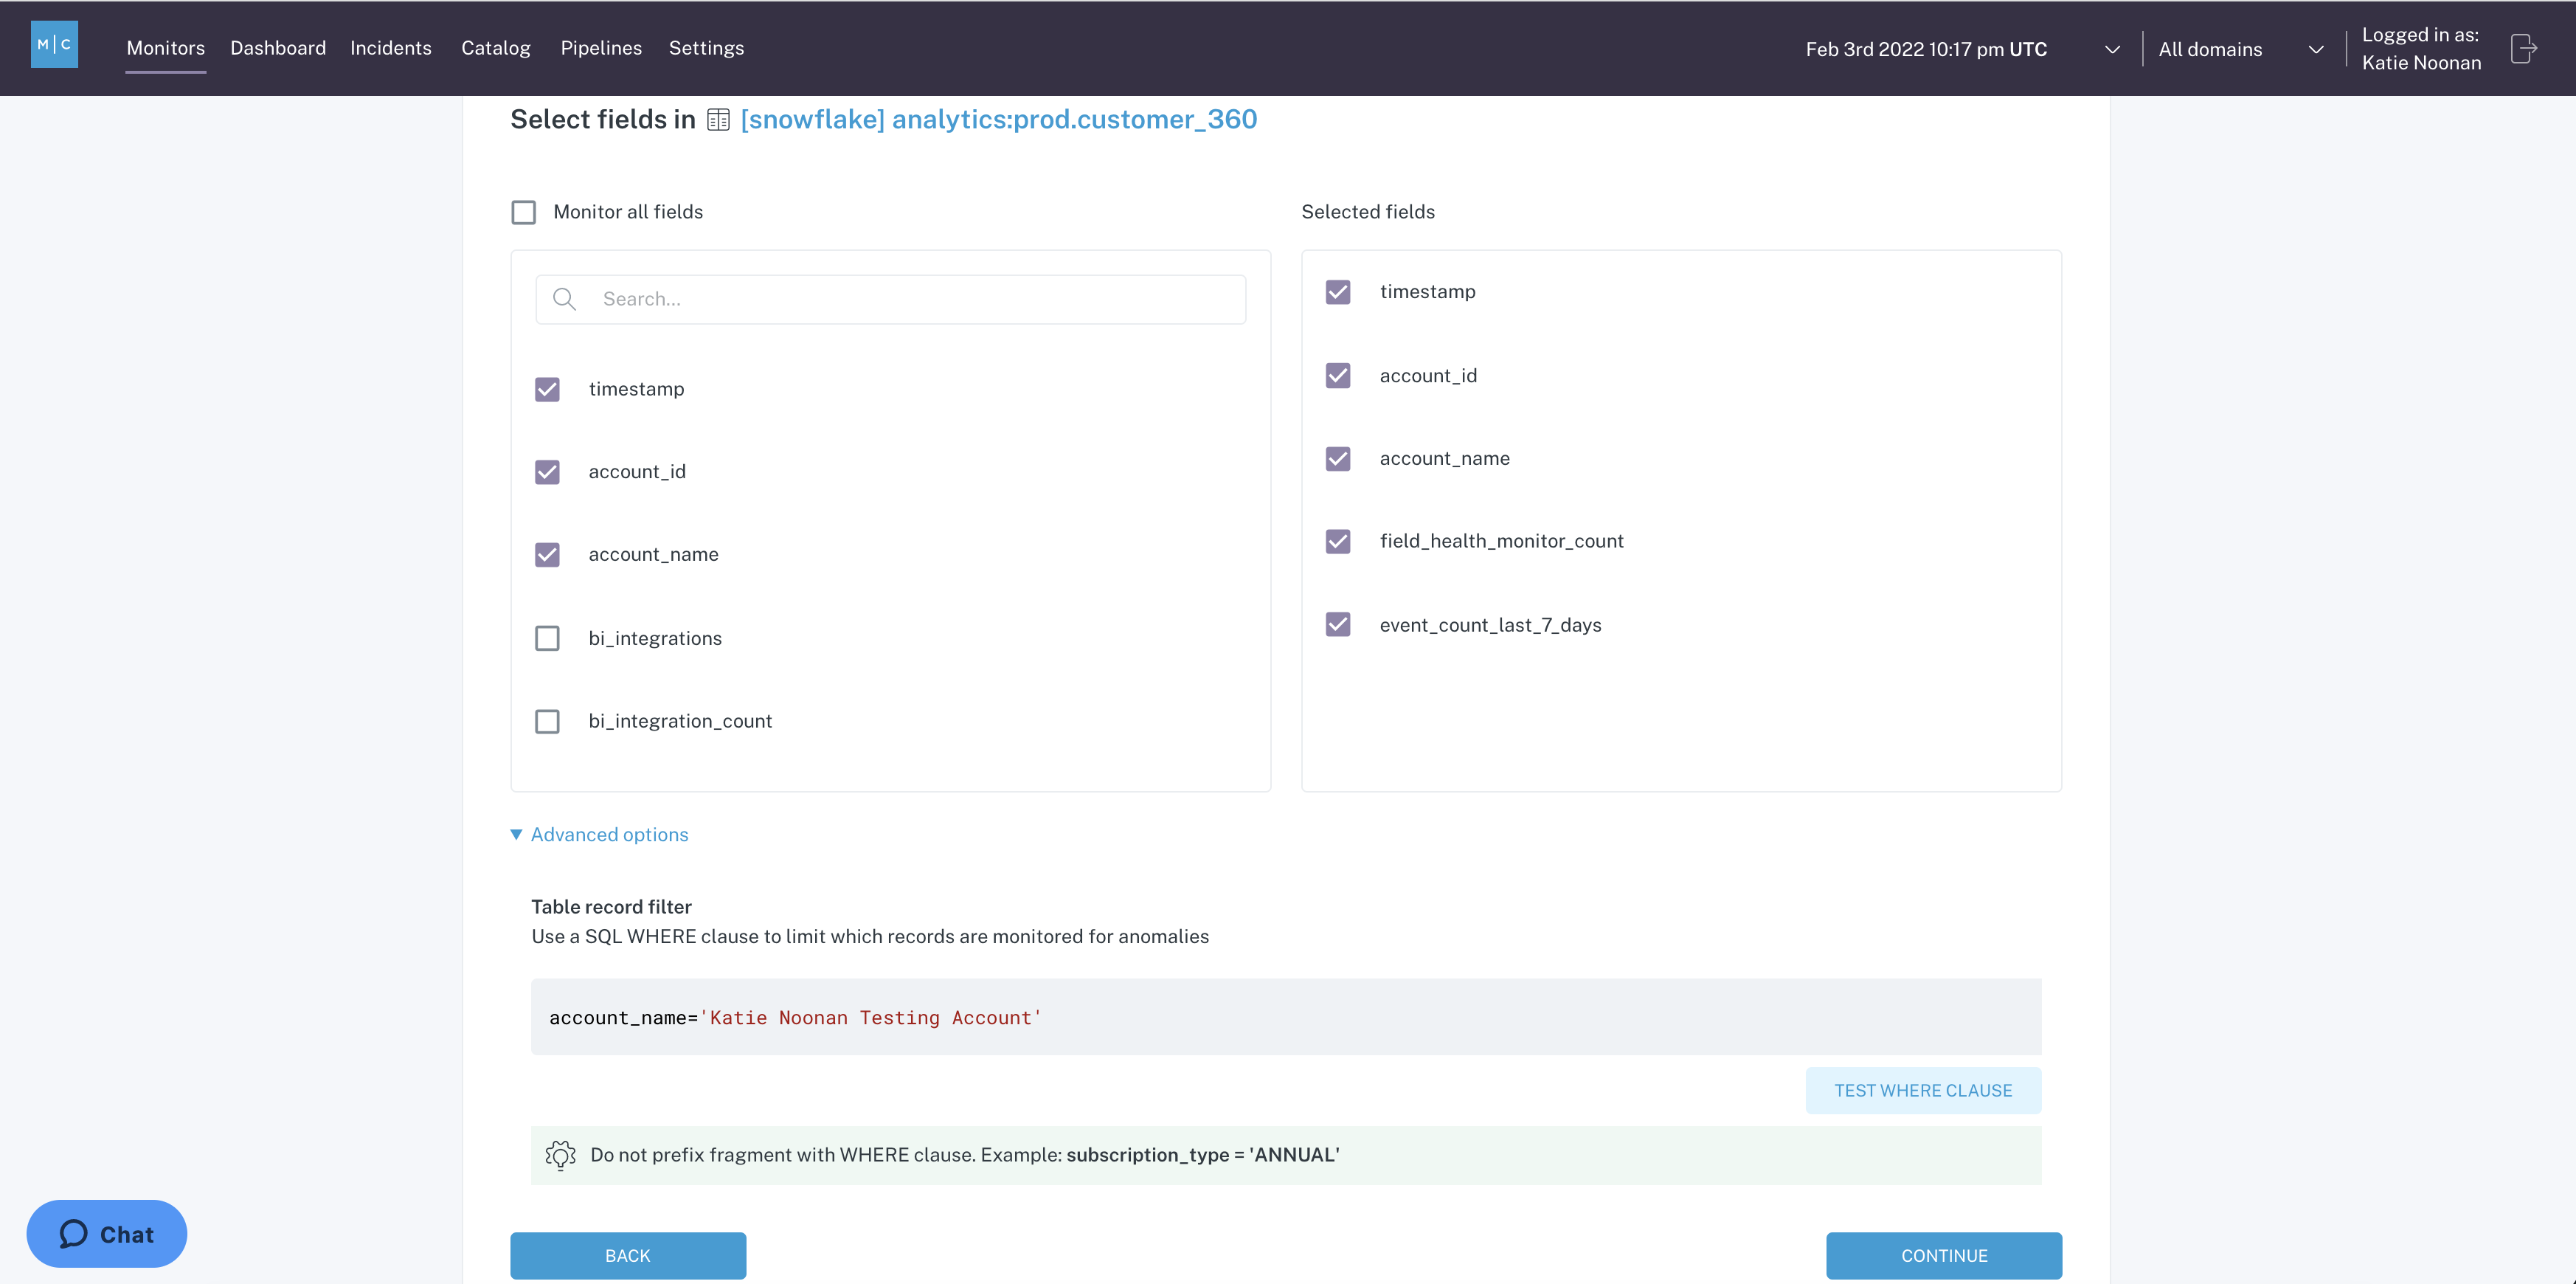
Apply WHERE clause
Click "Continue", and then you are prompted to select a field that will represent the row creation time. This is essentially going to be the x-axis in the statistical understanding Monte Carlo is going to develop for your data. It's the way that Monte Carlo can understand the data that is from today versus the data from the trailing days and weeks. That way, Monte Carlo can isolate and understand if the null rate or the percent unique or percentiles or mean values on today's data or this hour's data are much different from the data that's come in historically. In this case, there is just one-time field that we know does represent the row creation time and so we'll select that:
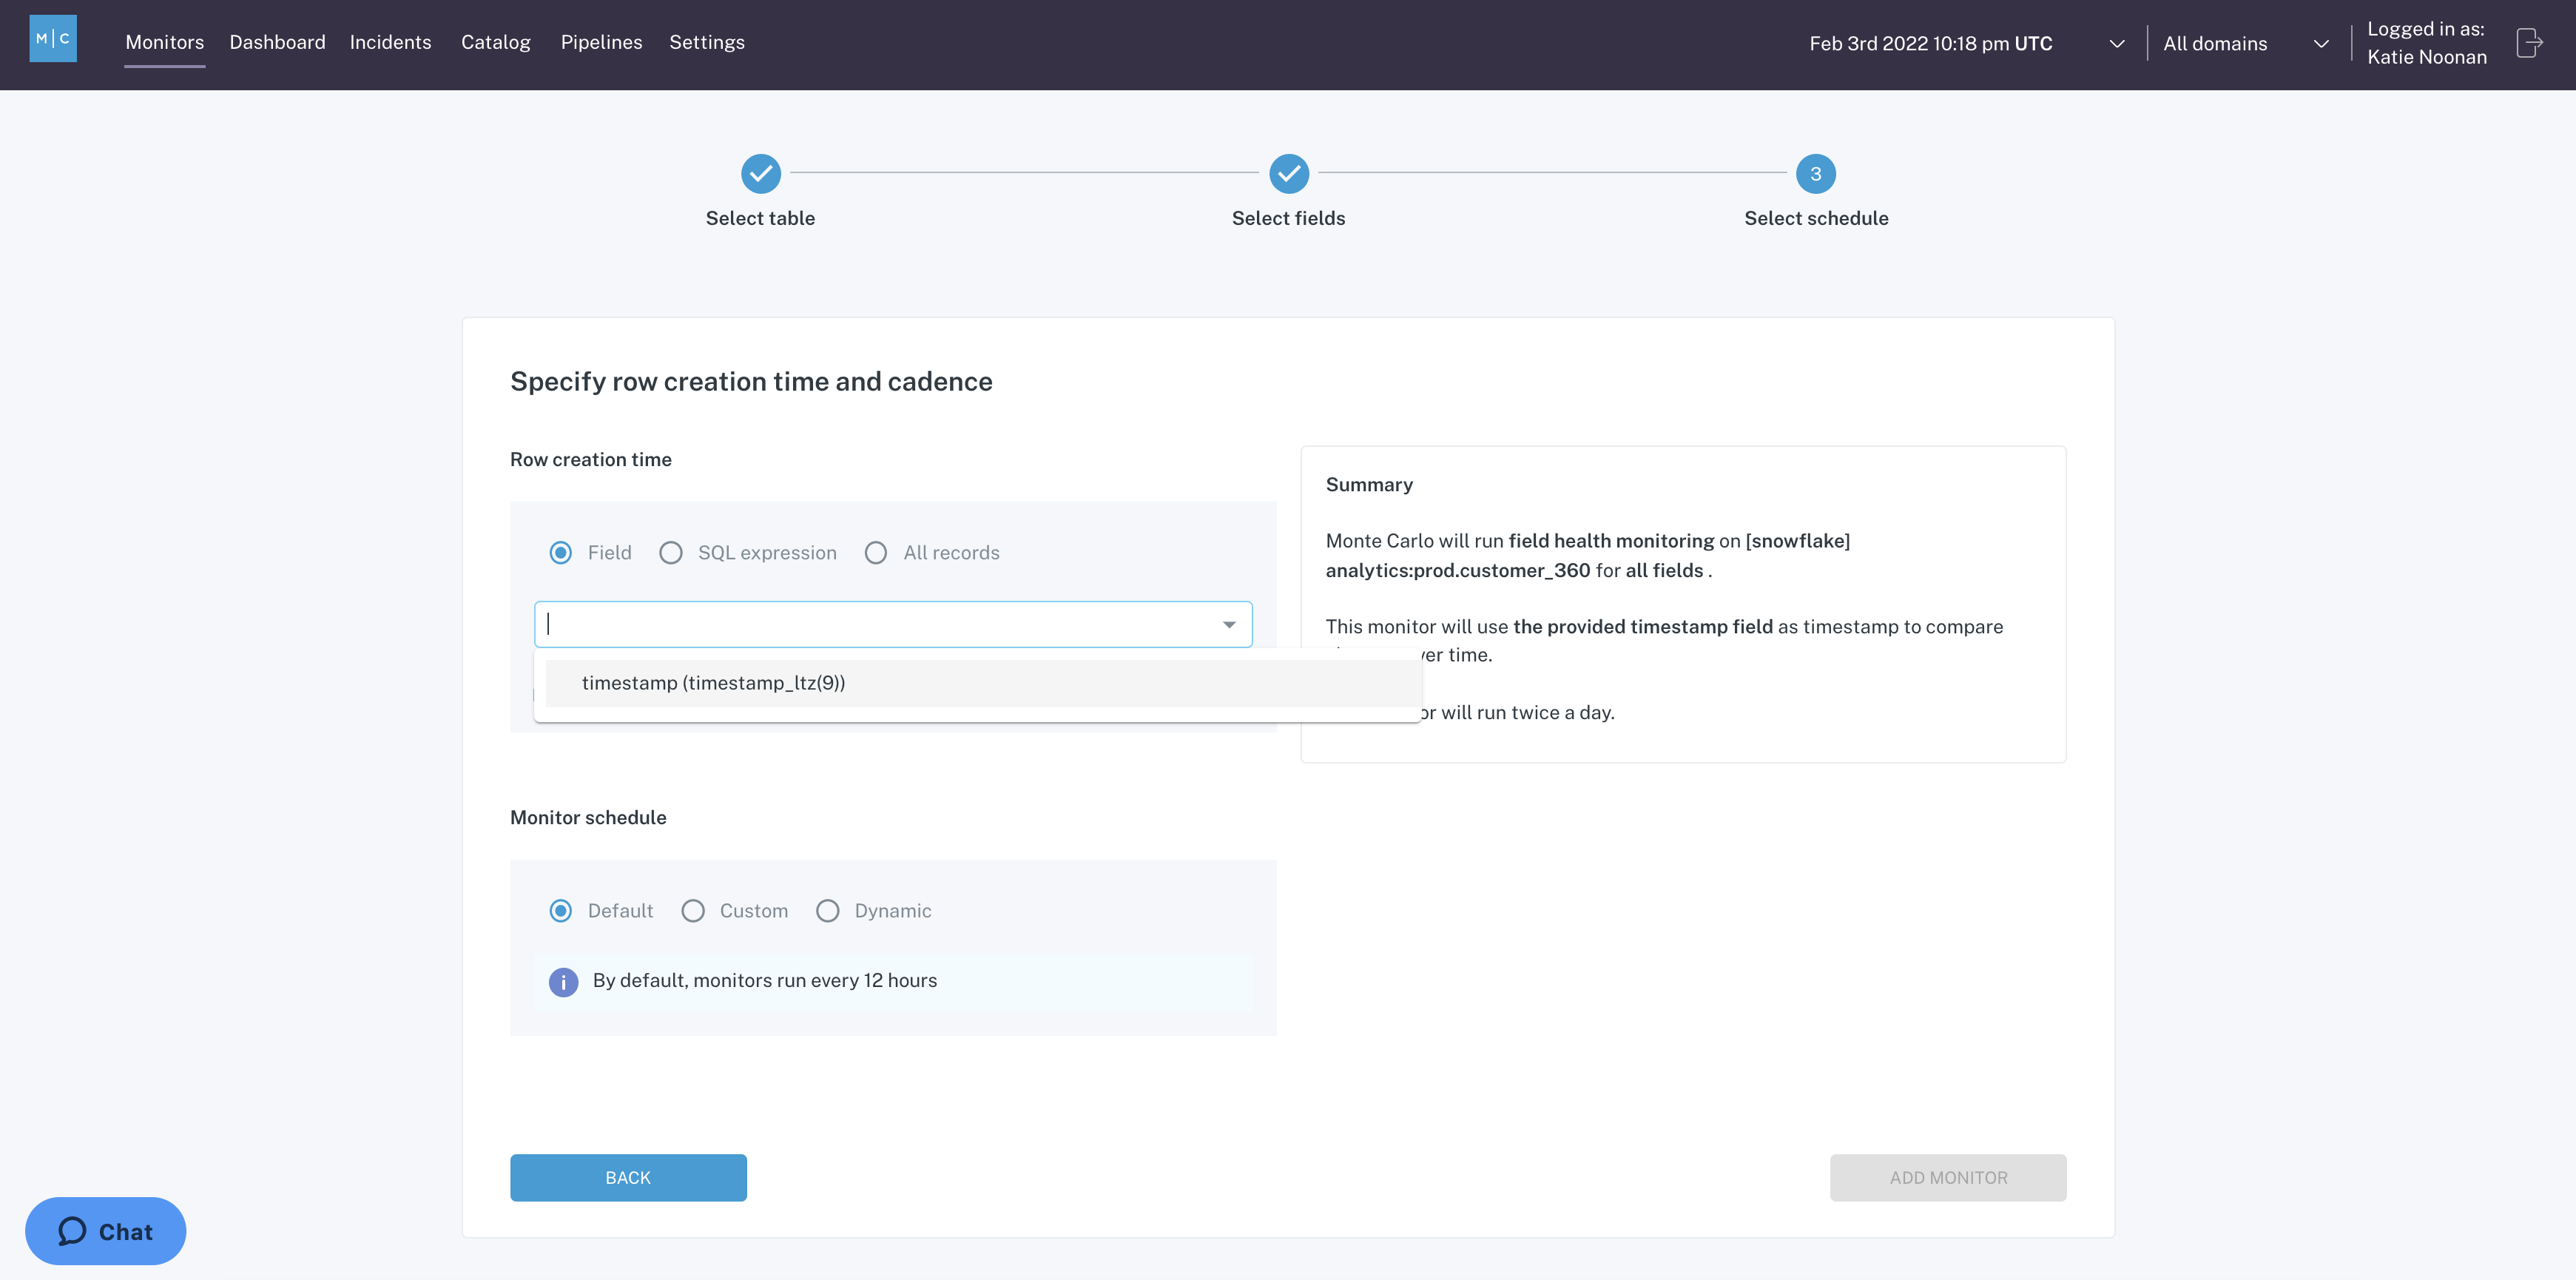
Pick a timestamp
Know you also have the option to stitch together a time field with a SQL expression, or you have the option to click "All records" which will do a full column scan each time the monitor runs:
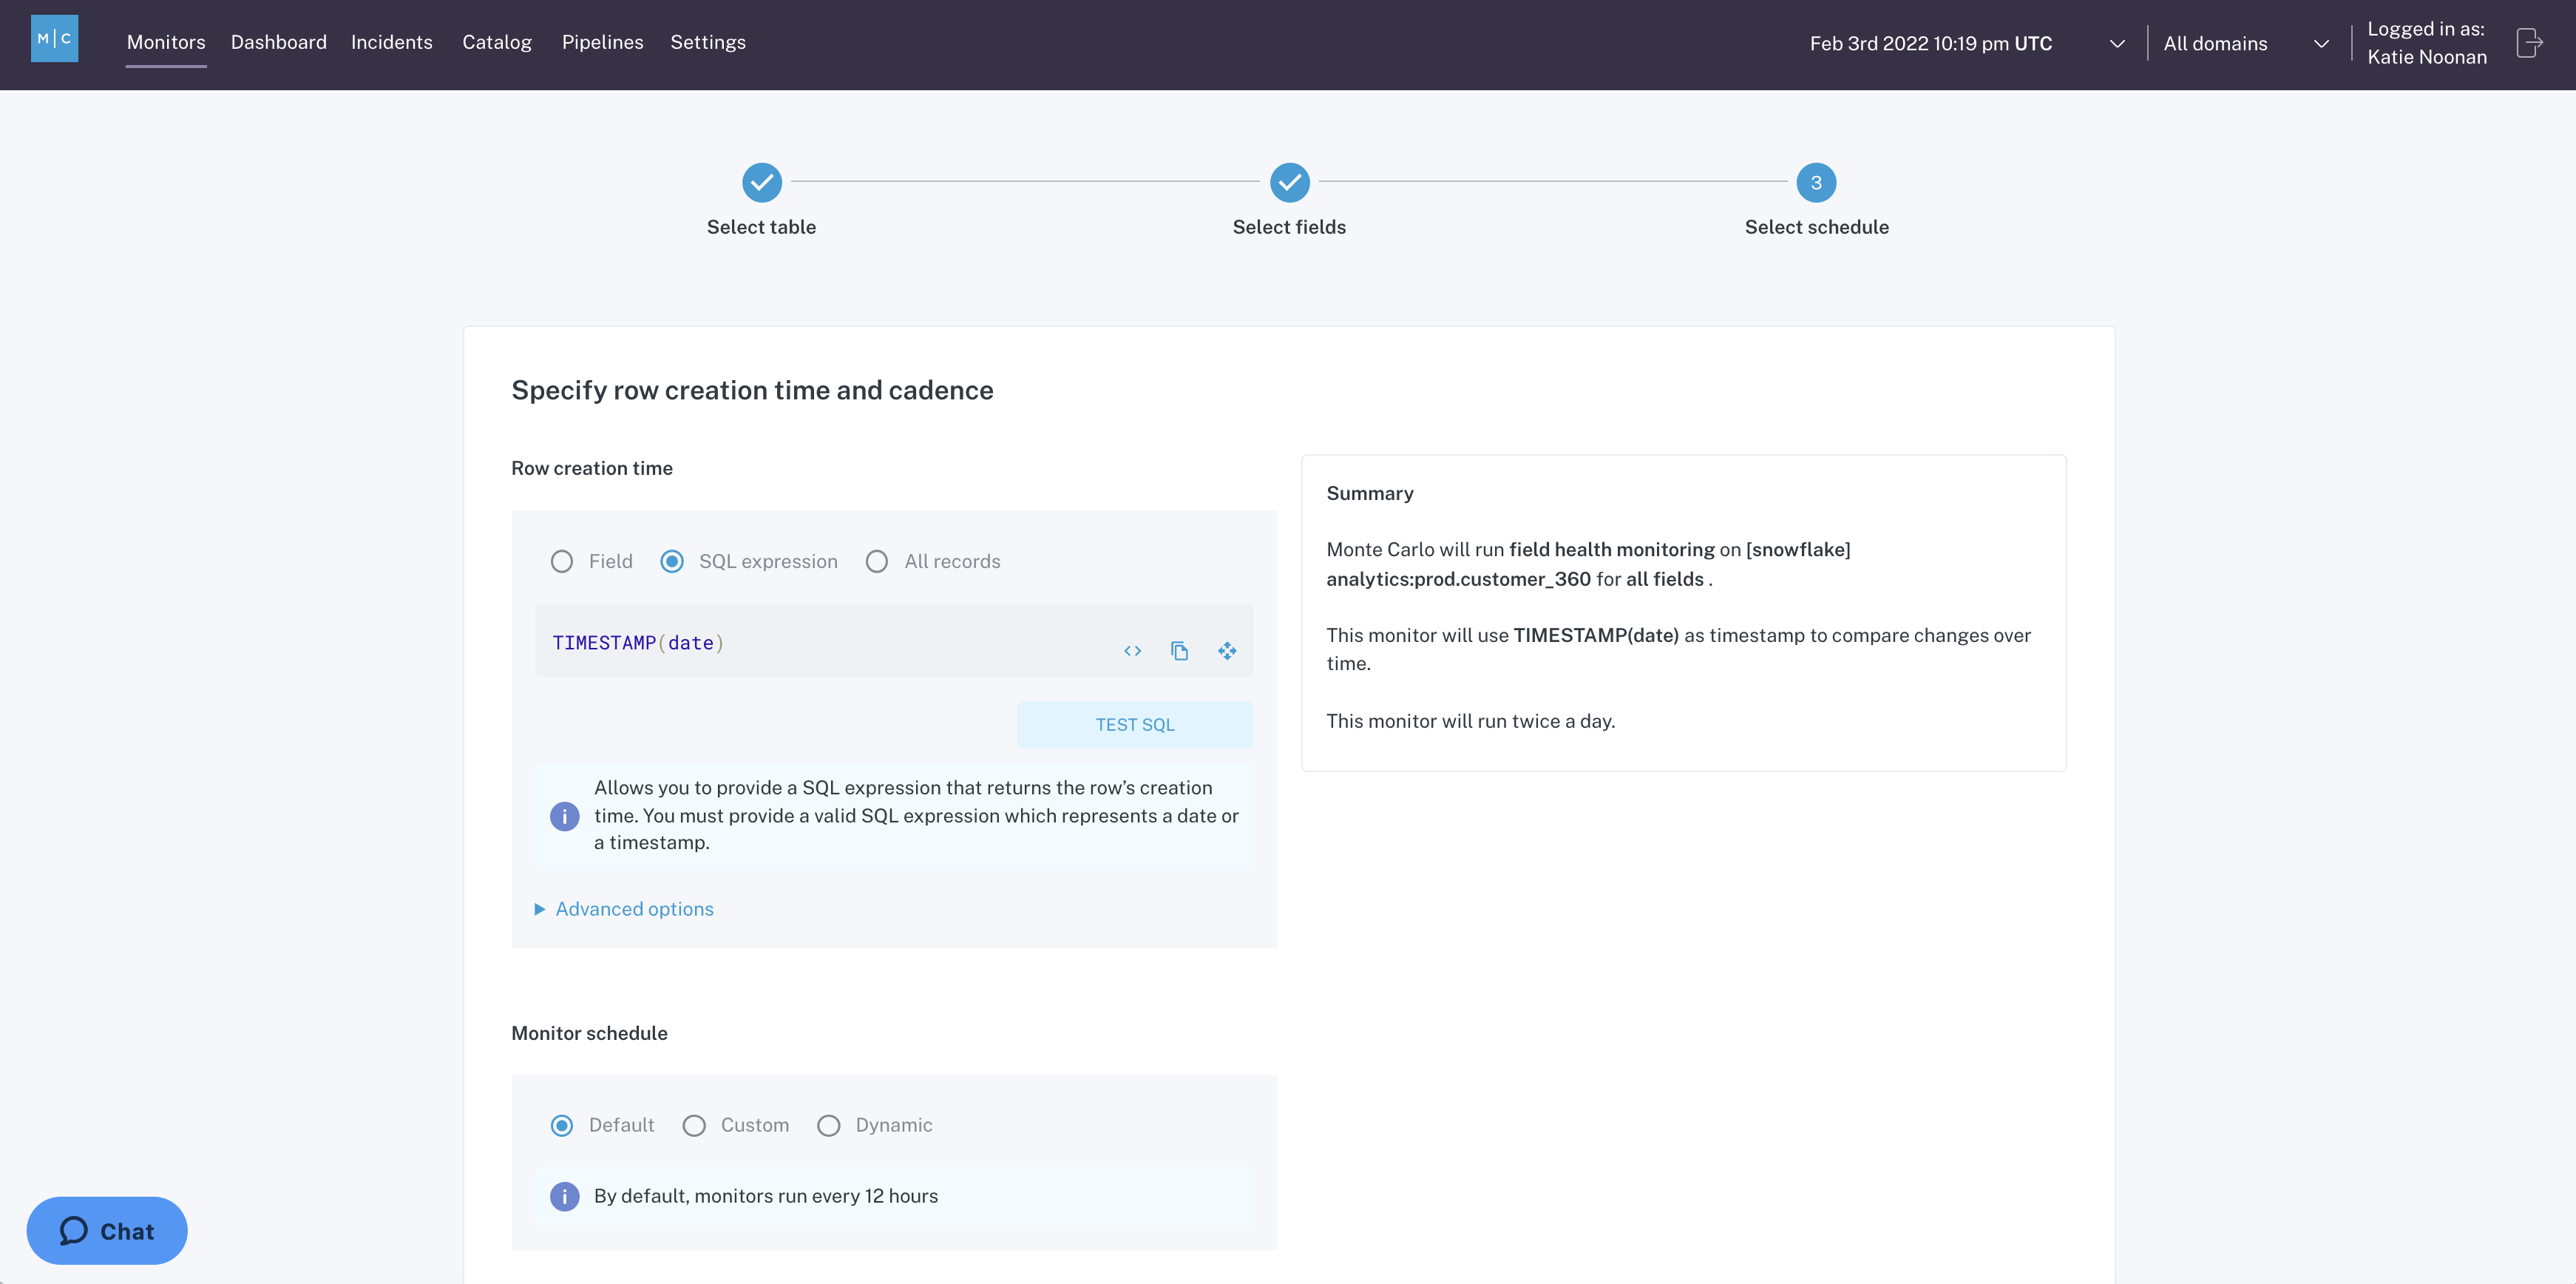
SQL time expression
All recordsCareful picking "All Records"! This will result in Monte Carlo scanning your entire table for data, which can incur significant cost and cause the queries to fail due to timeouts.
You also have some advanced options that allow you to play with the aggregation window, and this will say if you want to bucket the statistics by day or by hour. I'm going to leave it on the default:
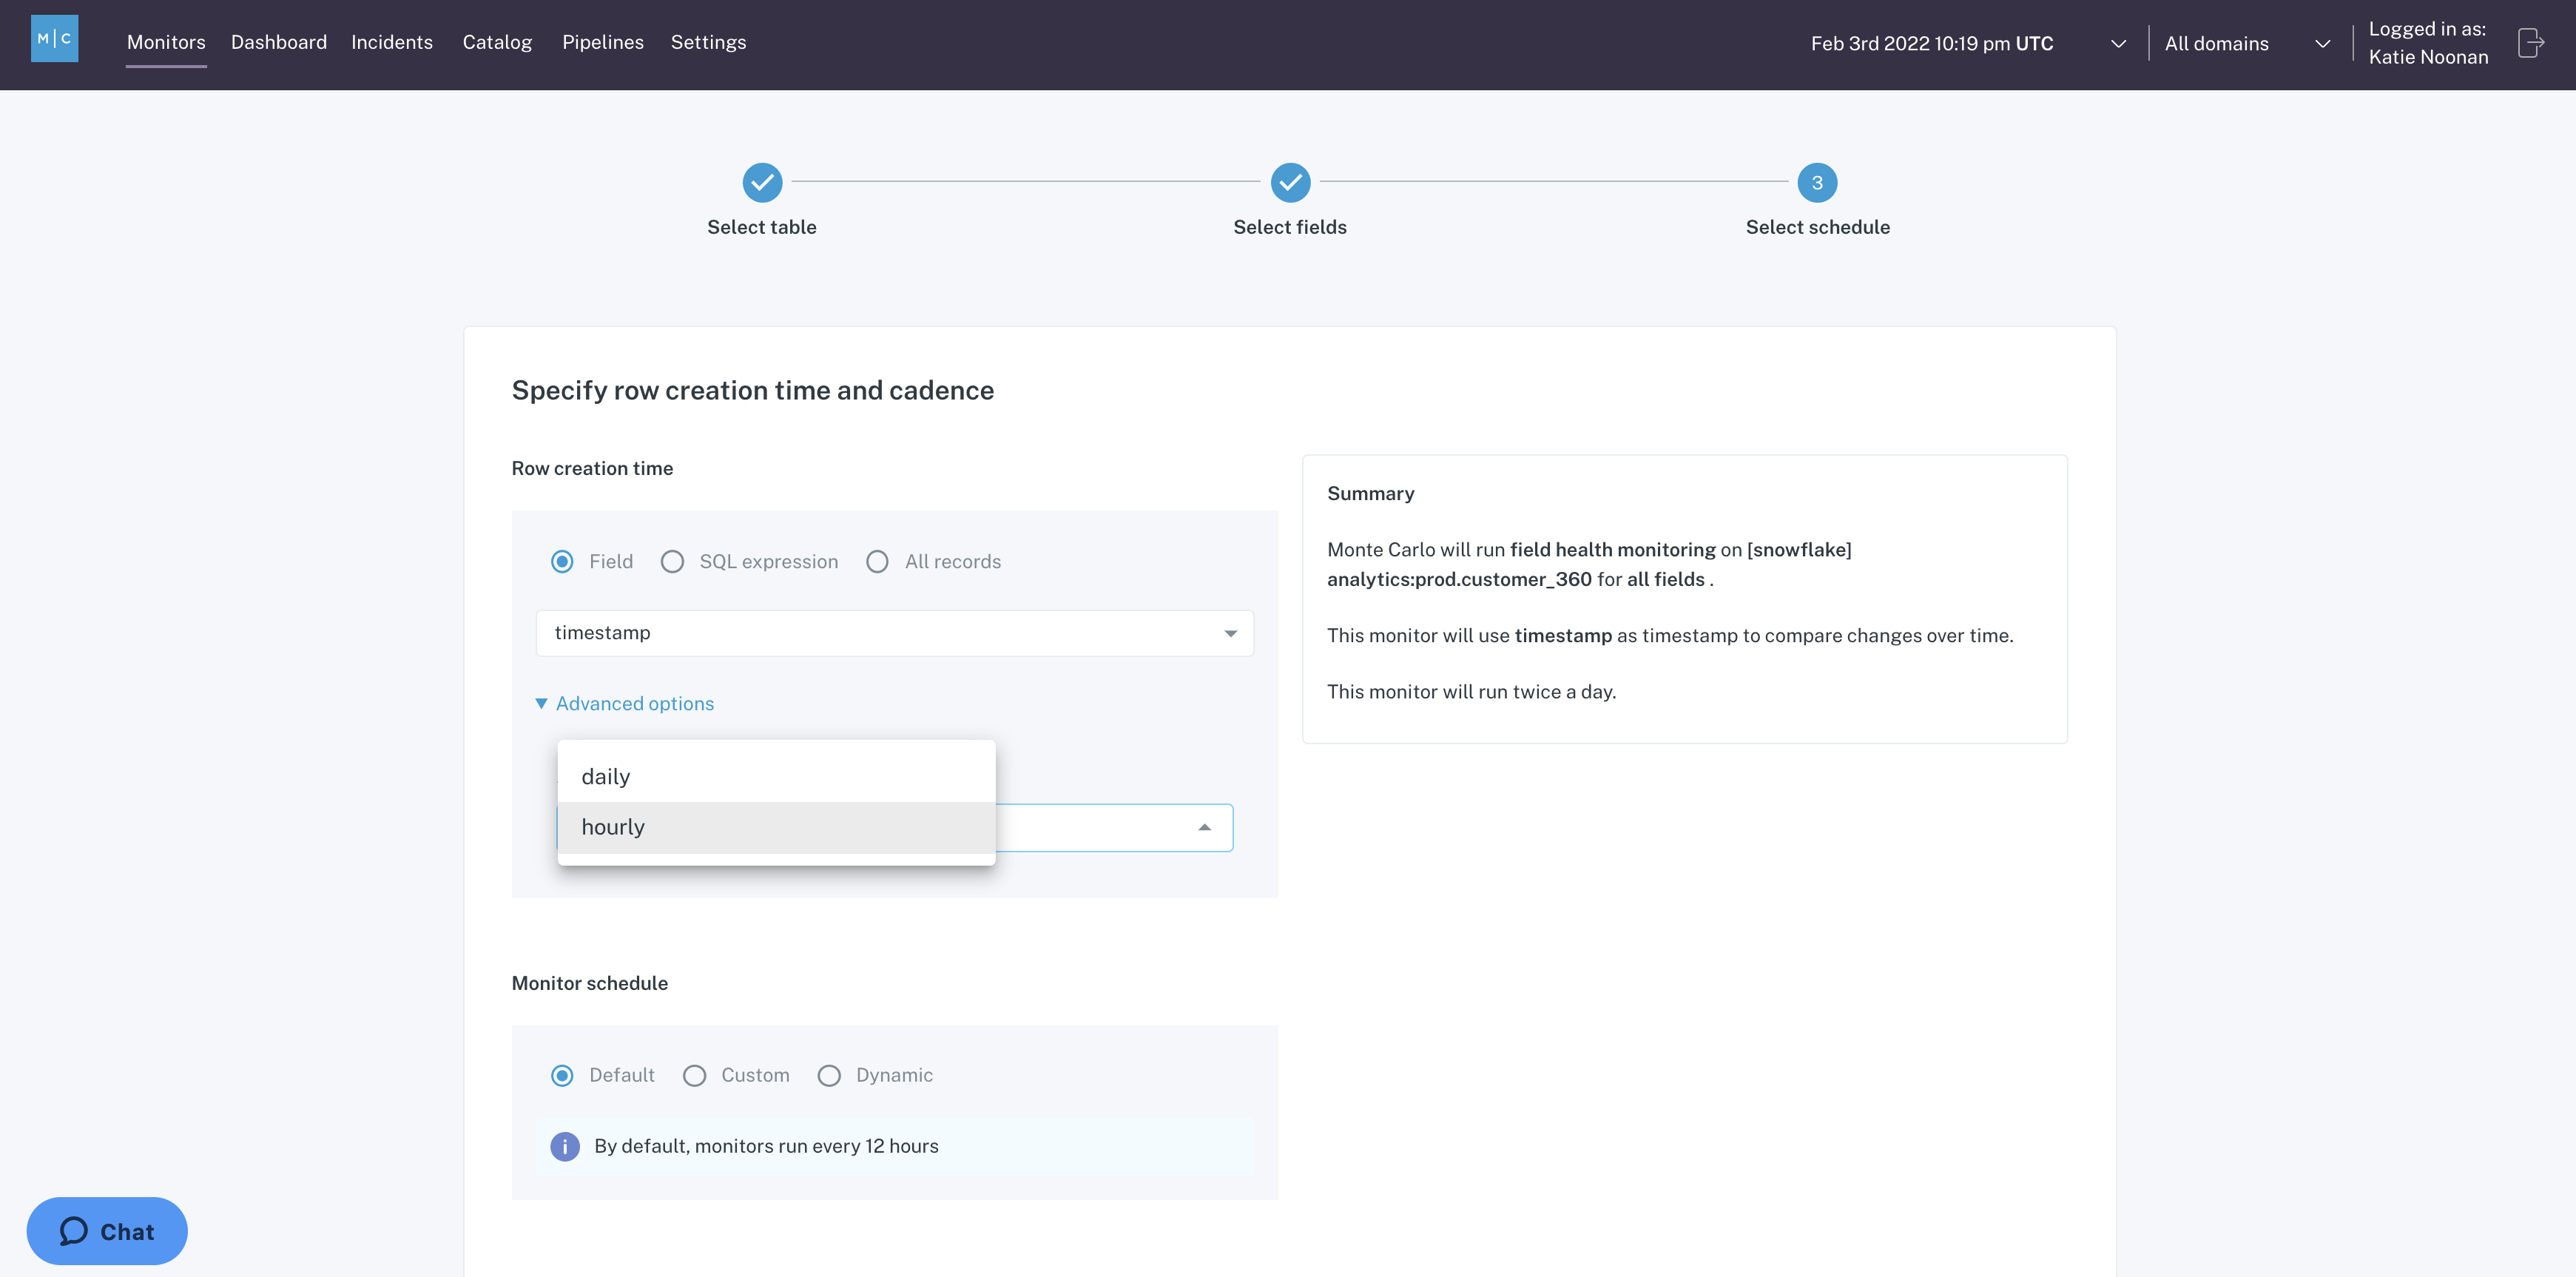
Data aggregation options
Lastly, you have the ability to configure the monitor's schedule. In most cases, it's appropriate to leave it on the default which will run the monitor every twelve hours, but you do have the option to run it more frequently or less frequently if you click "Custom":
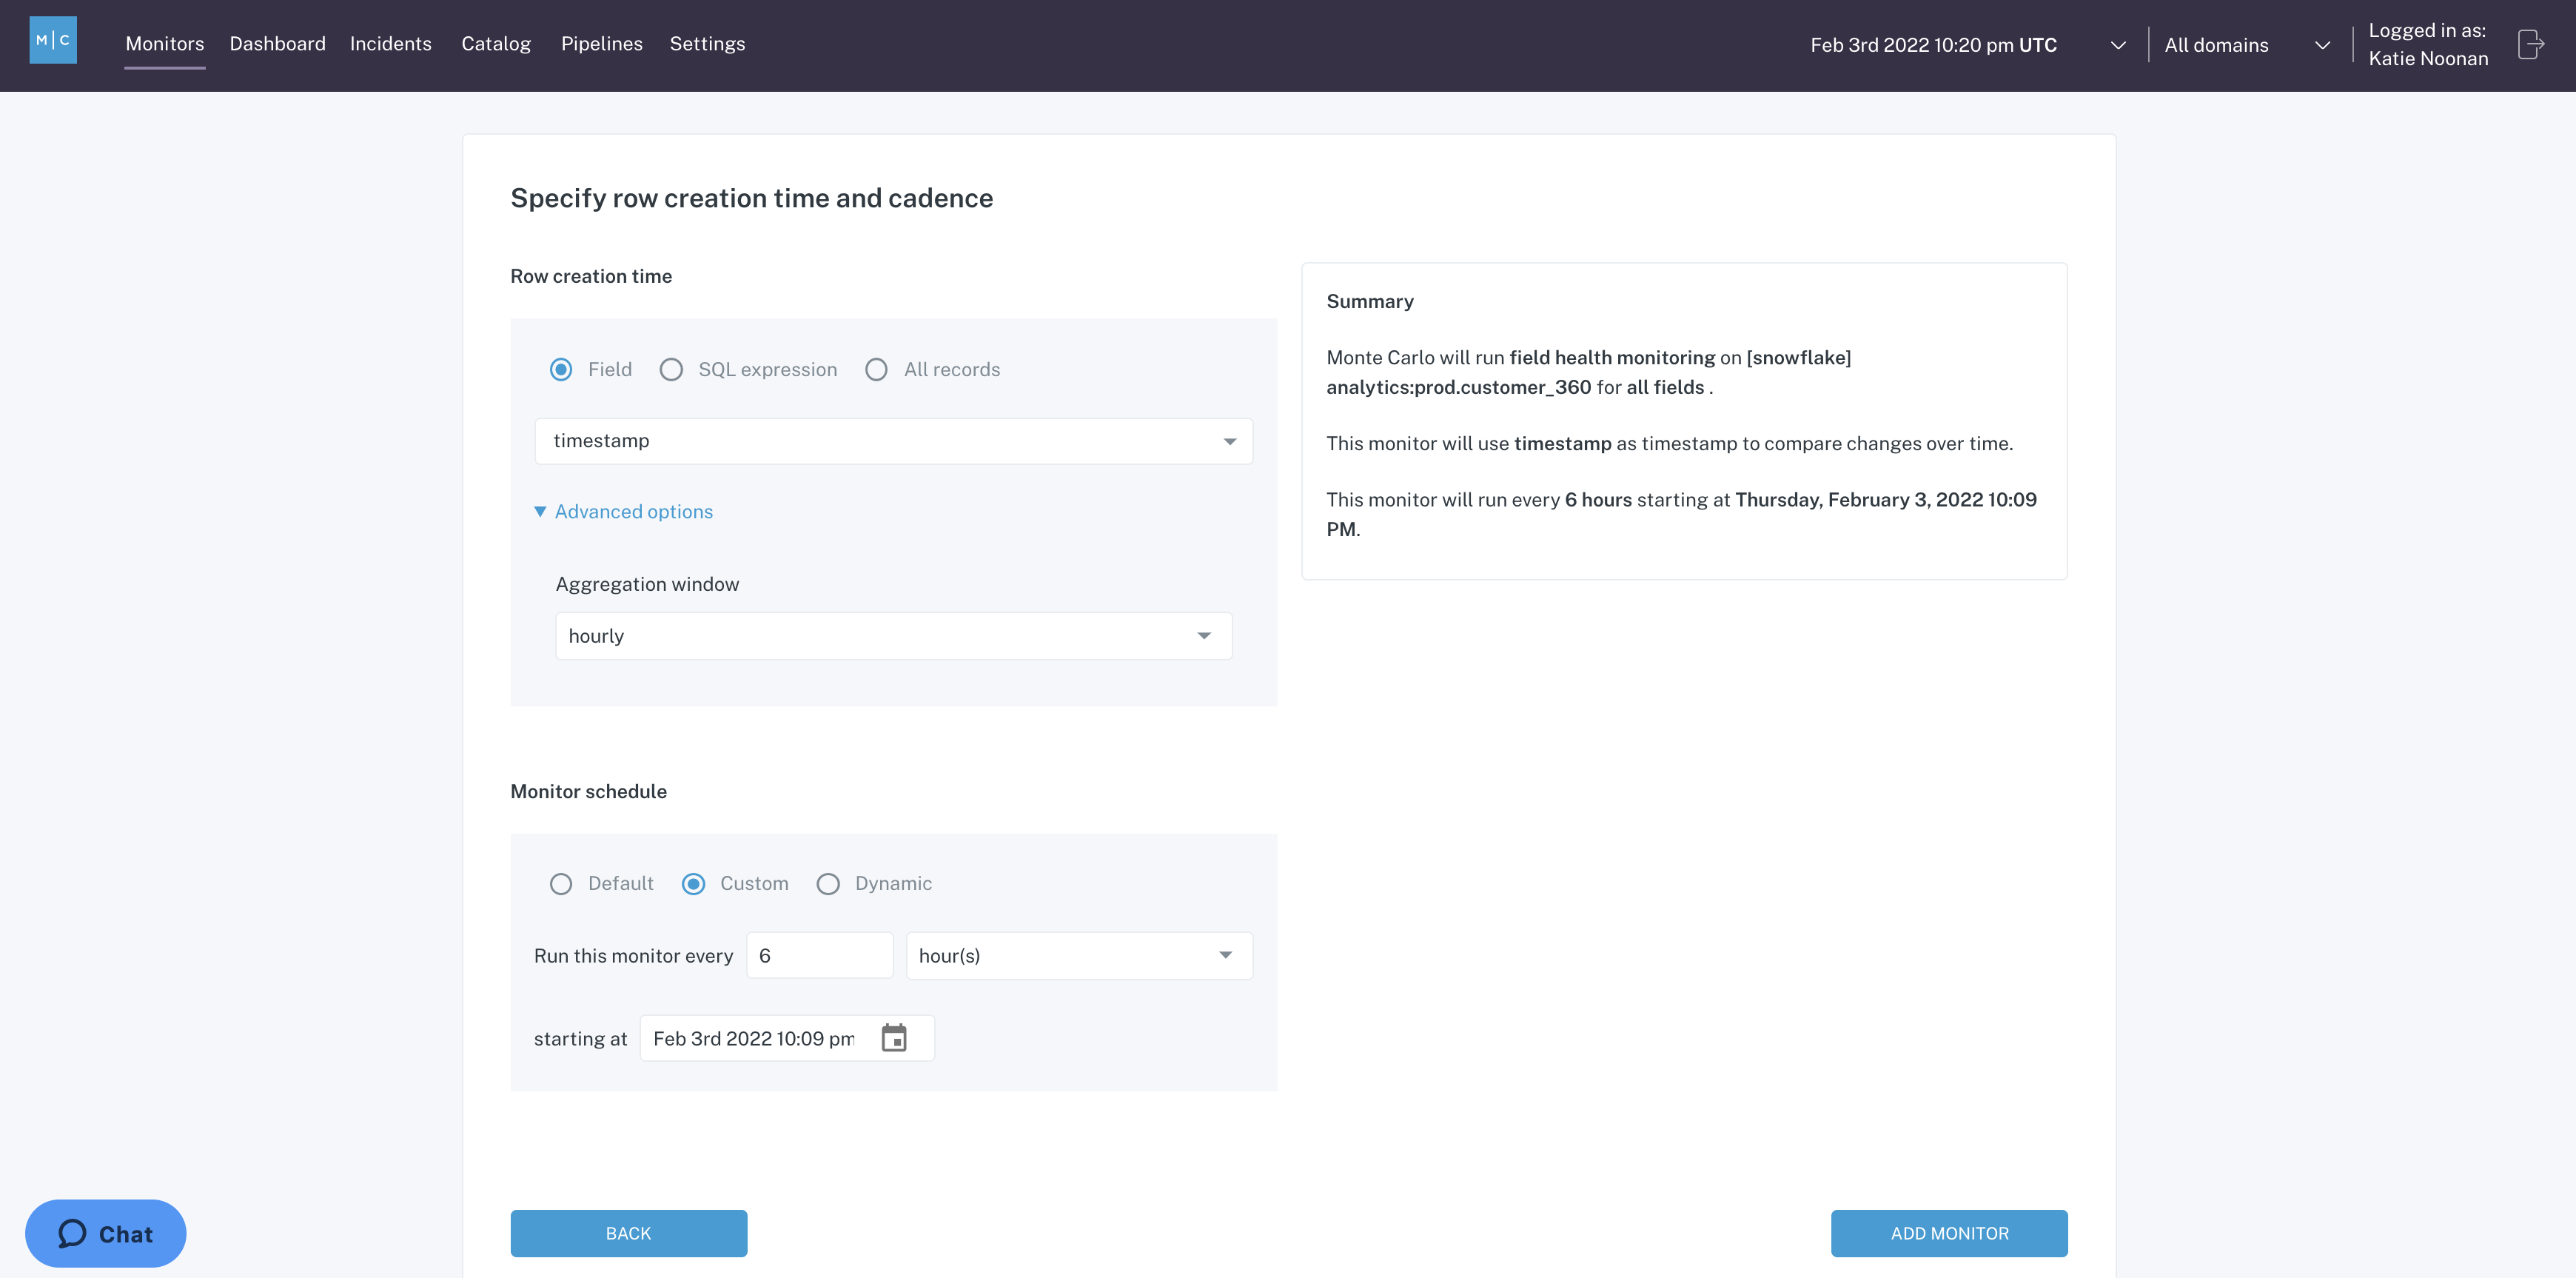
Custom schedule
You also have the option to select "Dynamic" scheduling which will mean the monitor will run when Monte Carlo has recognized that the table has received an update. Again, in most settings it's appropriate to leave it on the default, and so I'll leave it there which runs the monitor every 12 hours:
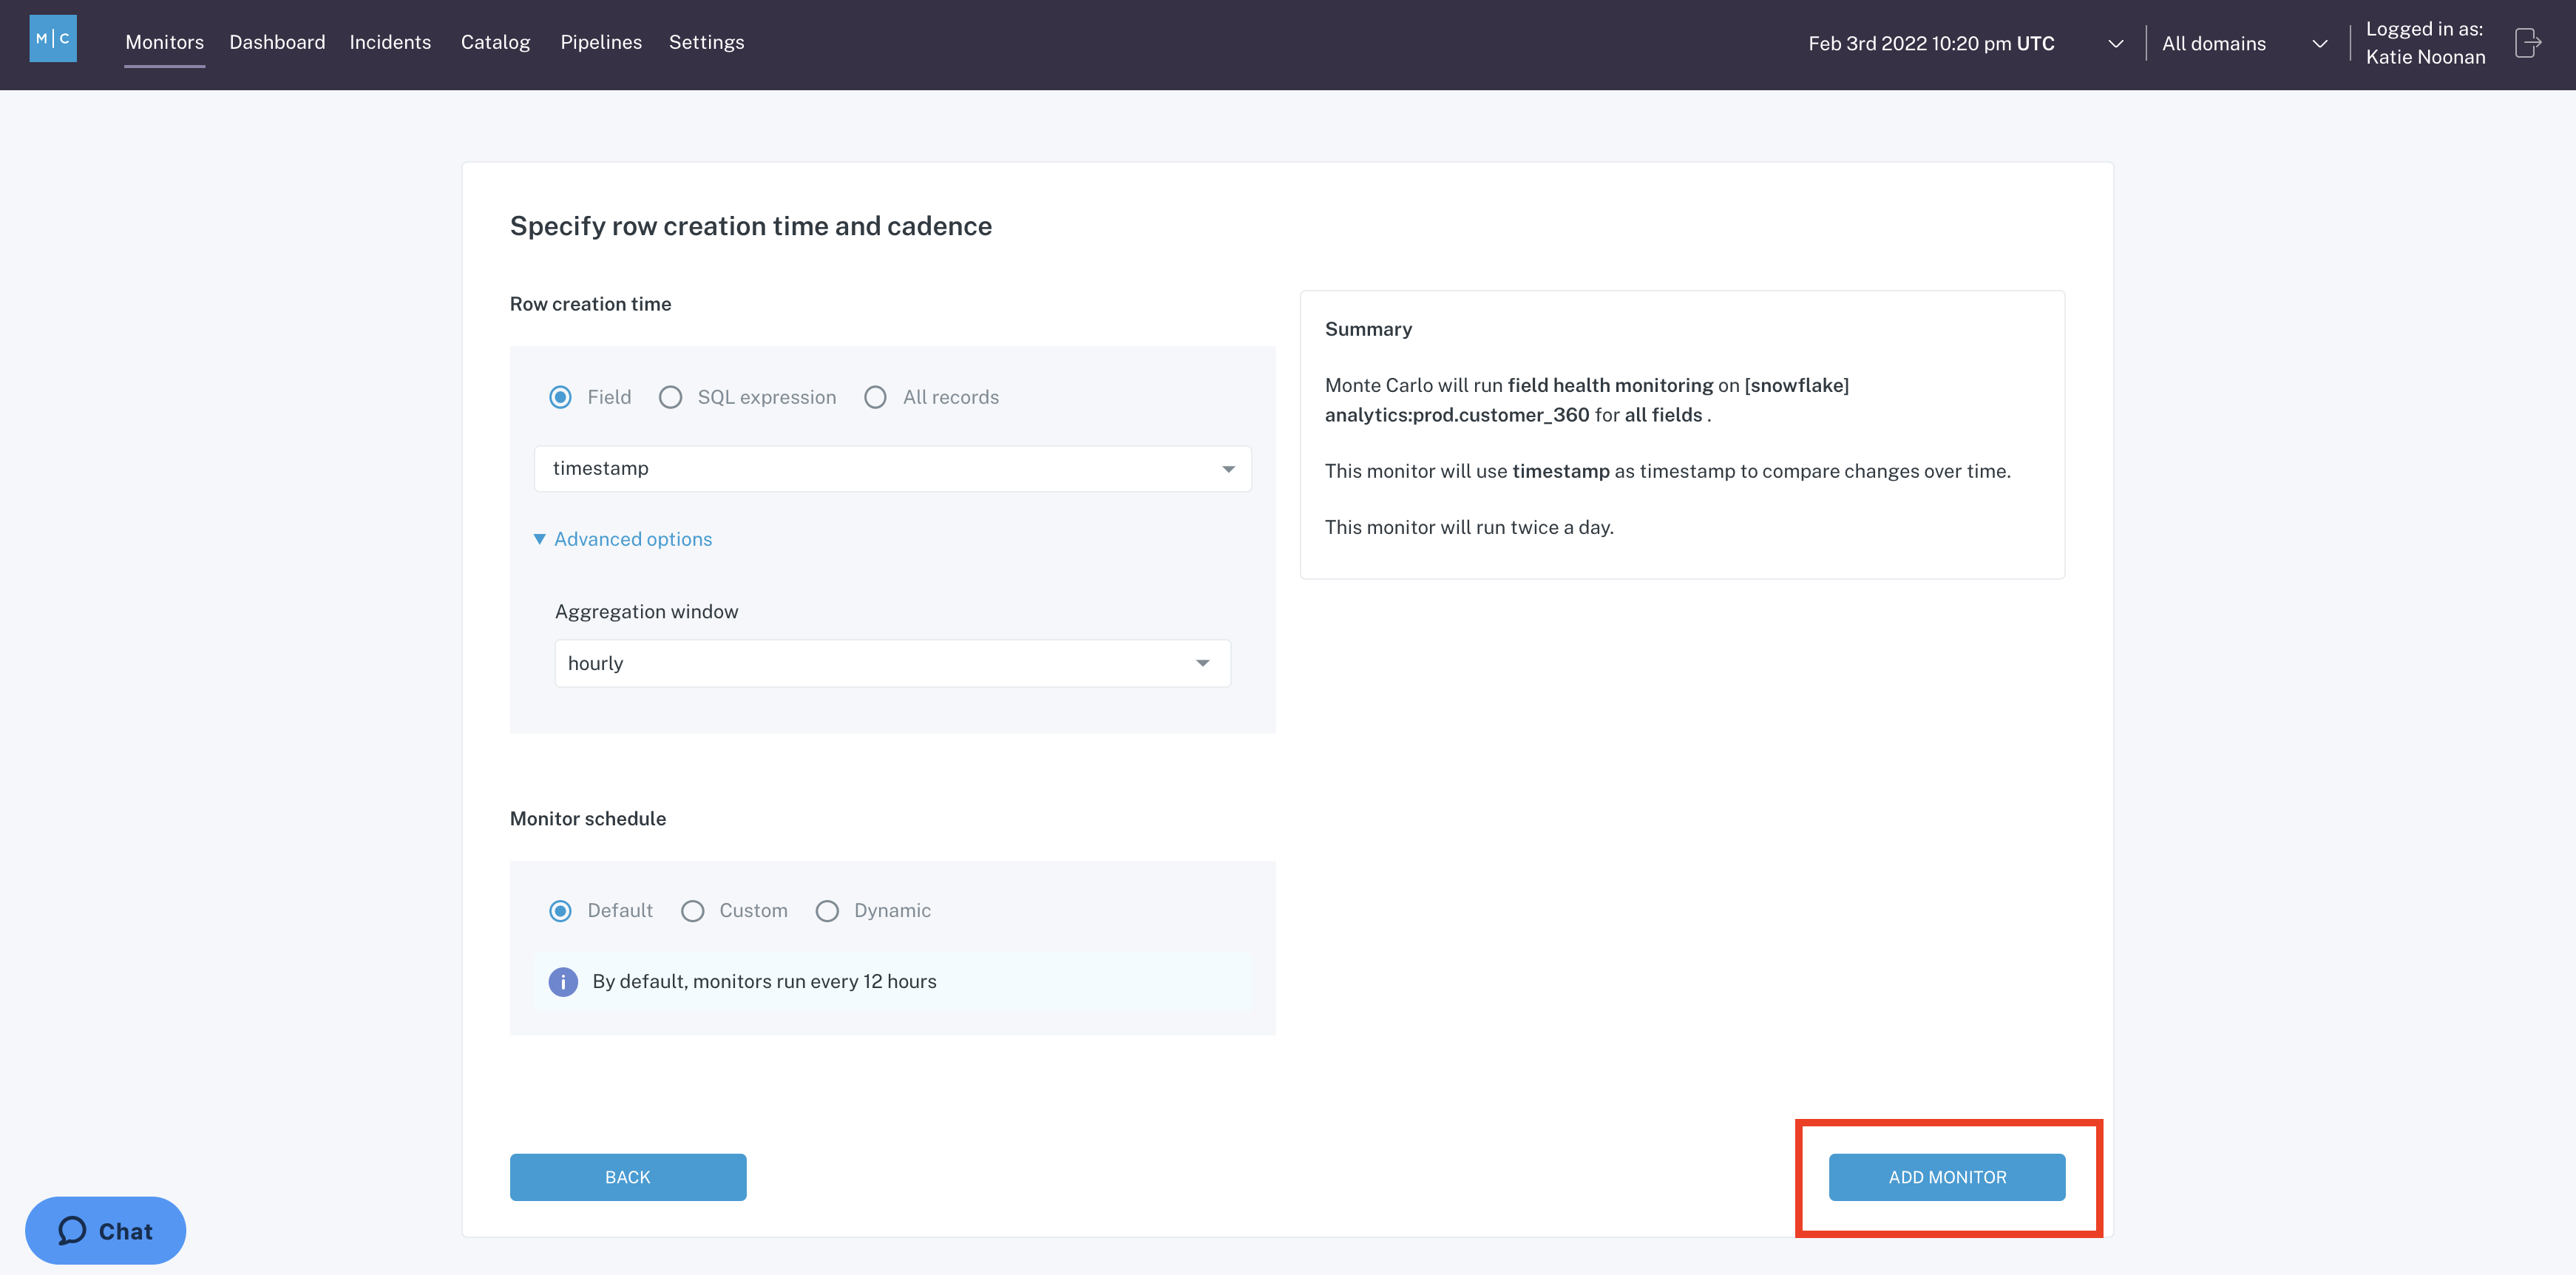
Add monitor
Then all you need to do is click "Add Monitor", and Monte Carlo will go and develop a benchmark for all those different statistics in this table. That initial benchmark will look back 14 days, and then each time the monitor runs, it's looking back 4 hours from here on out. Any alerts that this monitor generates will follow the existing notification settings and notification routing that you have set for the schema or the table that you have applied this Field Health monitor to.
That's it! 🎉 I hope this was helpful and please feel free to reach out to [email protected] or the chat bot in the lower right hand corner if you have any questions!
Updated 8 days ago
