Understanding Field Health Monitors
This tutorial will go over the basics of Field Health monitors to help better understand its applications for data quality monitoring.
Last Updated: August 1, 2022
Transcript
Field health monitors provide an added layer of machine learning based data quality checks on the field level for your most important tables, ranging from null and unique percentage of field values to the mean, min, or max for numeric fields.
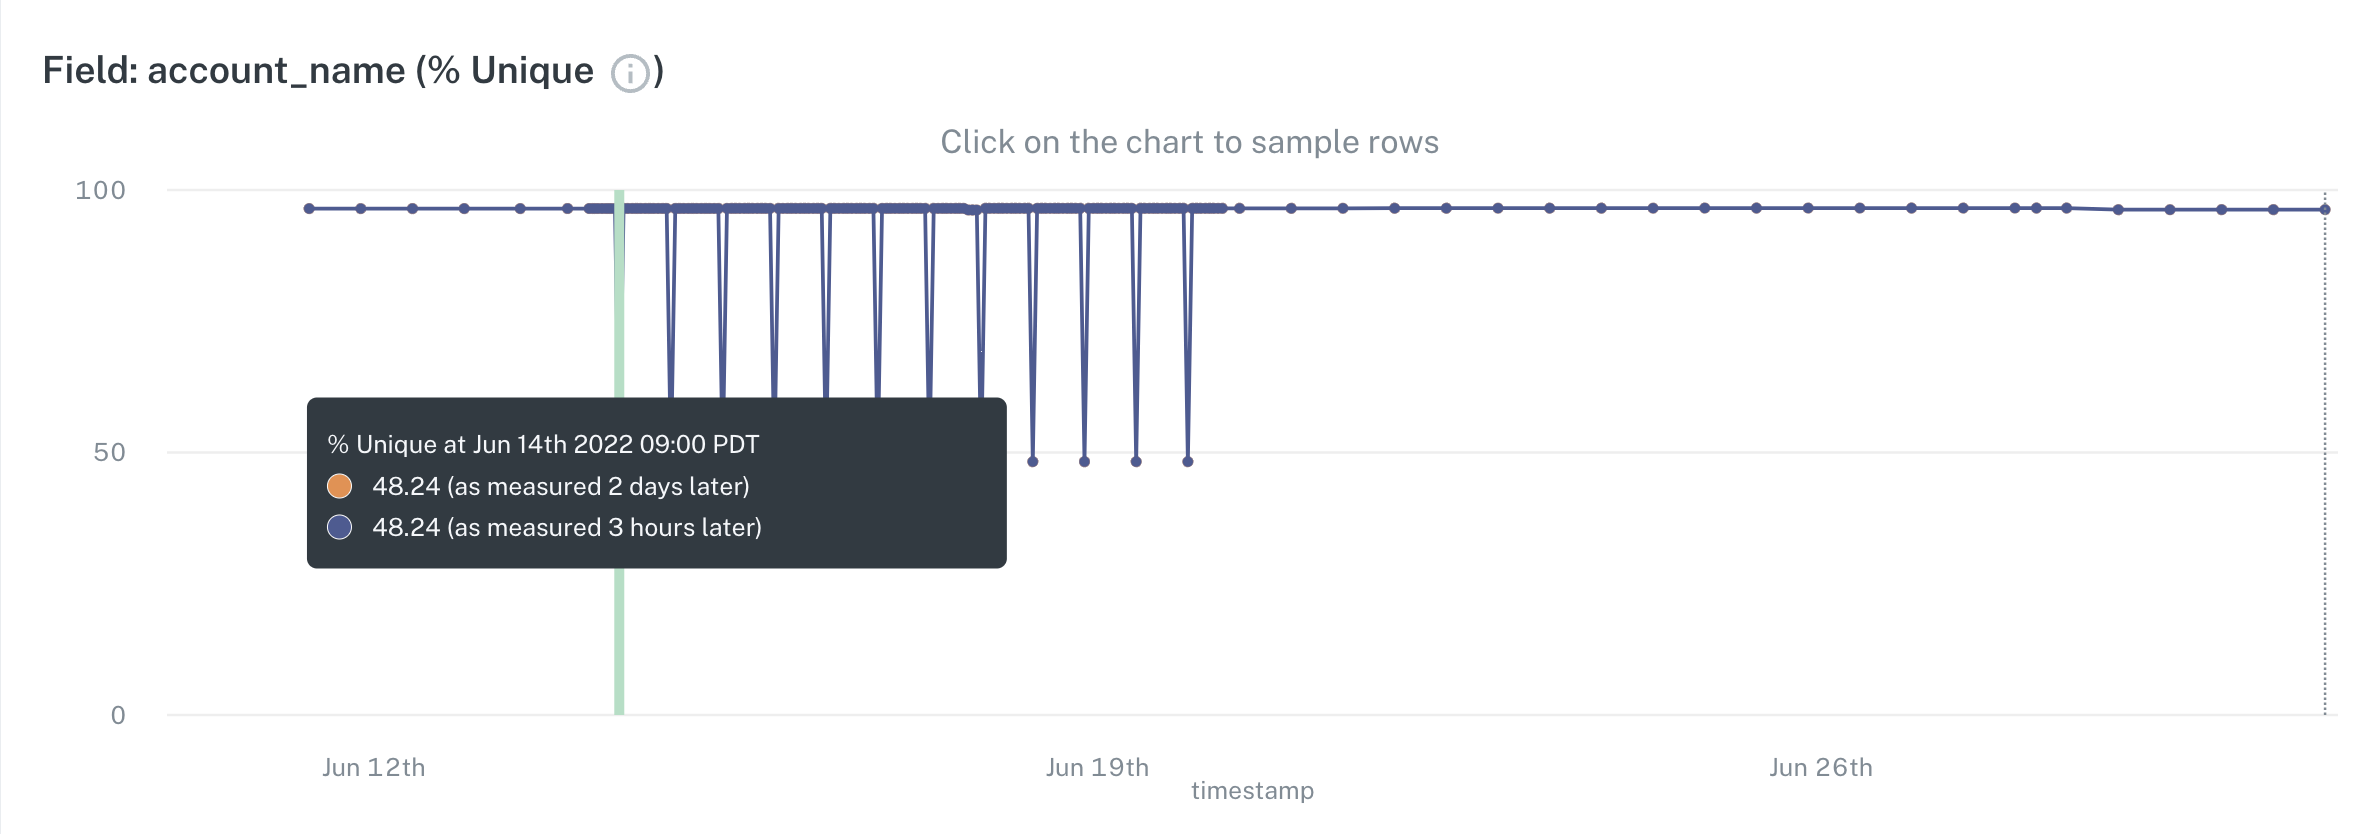
In this specific example, we are looking at an incident in which the number of different fields within a given table were actually flagged and shown an anomalous unique percentage of values in the most recent data.
If I click in to this specific example, we can actually see the historic unique percentage of values for this specific account name field.

We can also hover over and see what those percentages are, in this case on a daily basis. As we can see there was a large drop here in the unique percentage on this specific day, and so this incident was raised. On top of the unique percentage, there is a wide range of different metrics that we will track out of the box and baseline based on machine learning and the historical values. We create all of these thresholds, and based on the thresholding based on the historical values on the timestamp that you provide us, we will then alert you in the case that there are any deviations outside of that threshold that we begin to expect.
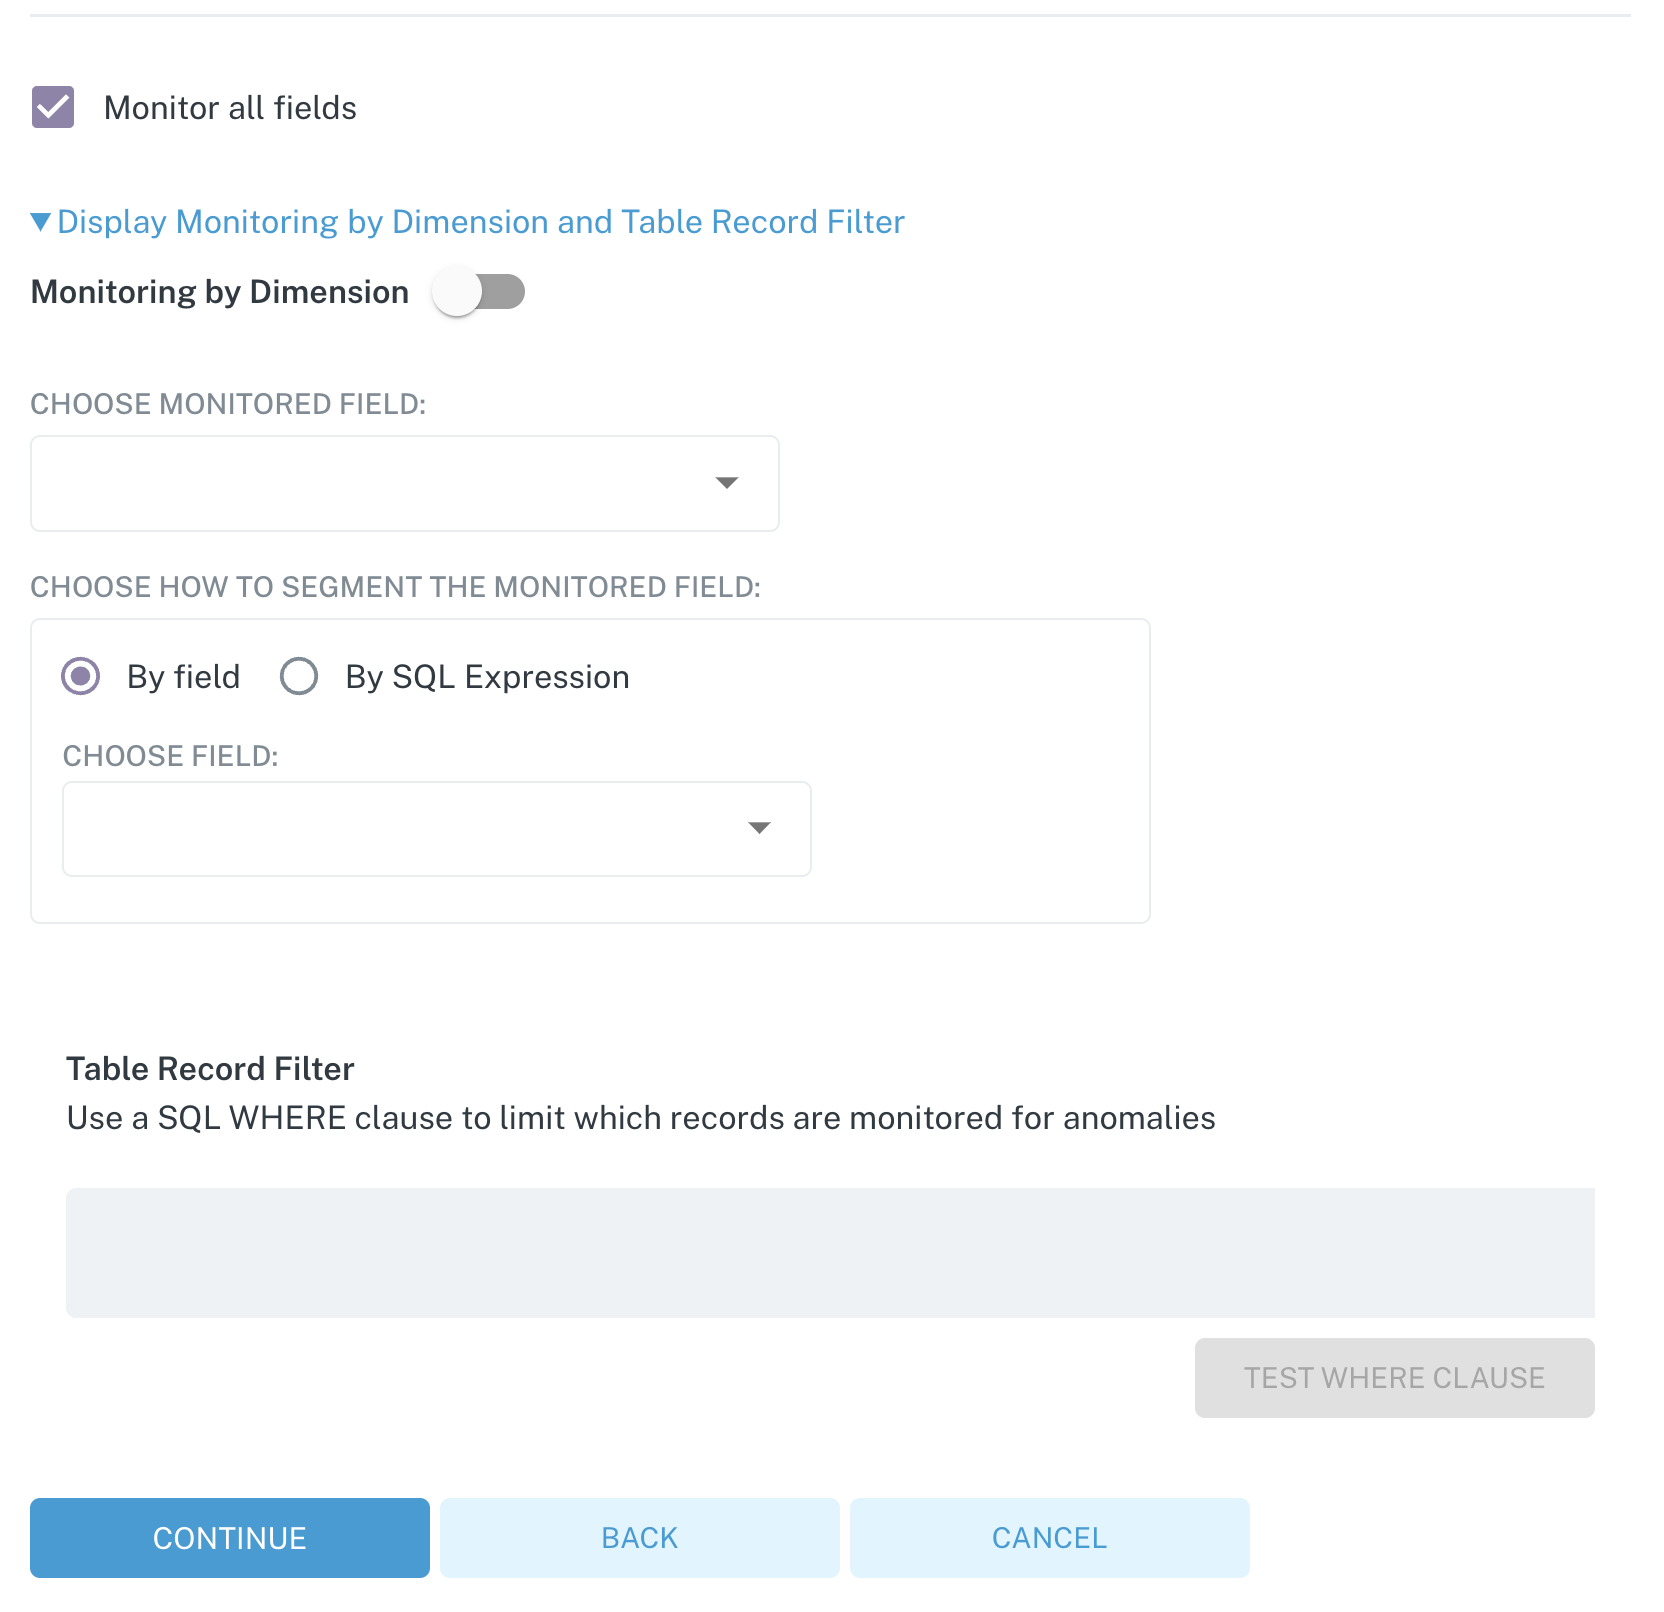
If I jump to the creation process of the field health monitors, there's a number of different options that can be chosen. When I go through to create a monitor, I can choose here to configure a field health monitor. Once I've chosen the specific table I want to create a monitor for, I can continue. By default, we will choose to monitor all fields within the table. You alternatively have the option to unselect that and choose specific fields if there are only certain important fields that you choose to monitor.

Once this has been set up, we also have a number of advanced options.
These options range from the ability to add a SQL where clause logic to reduce the scope of the field health monitor or alternatively to monitor by dimension, in which case we will actually look at a given field and break down those metric results such as null rate and unique percentage among others, based on the values of a different field.

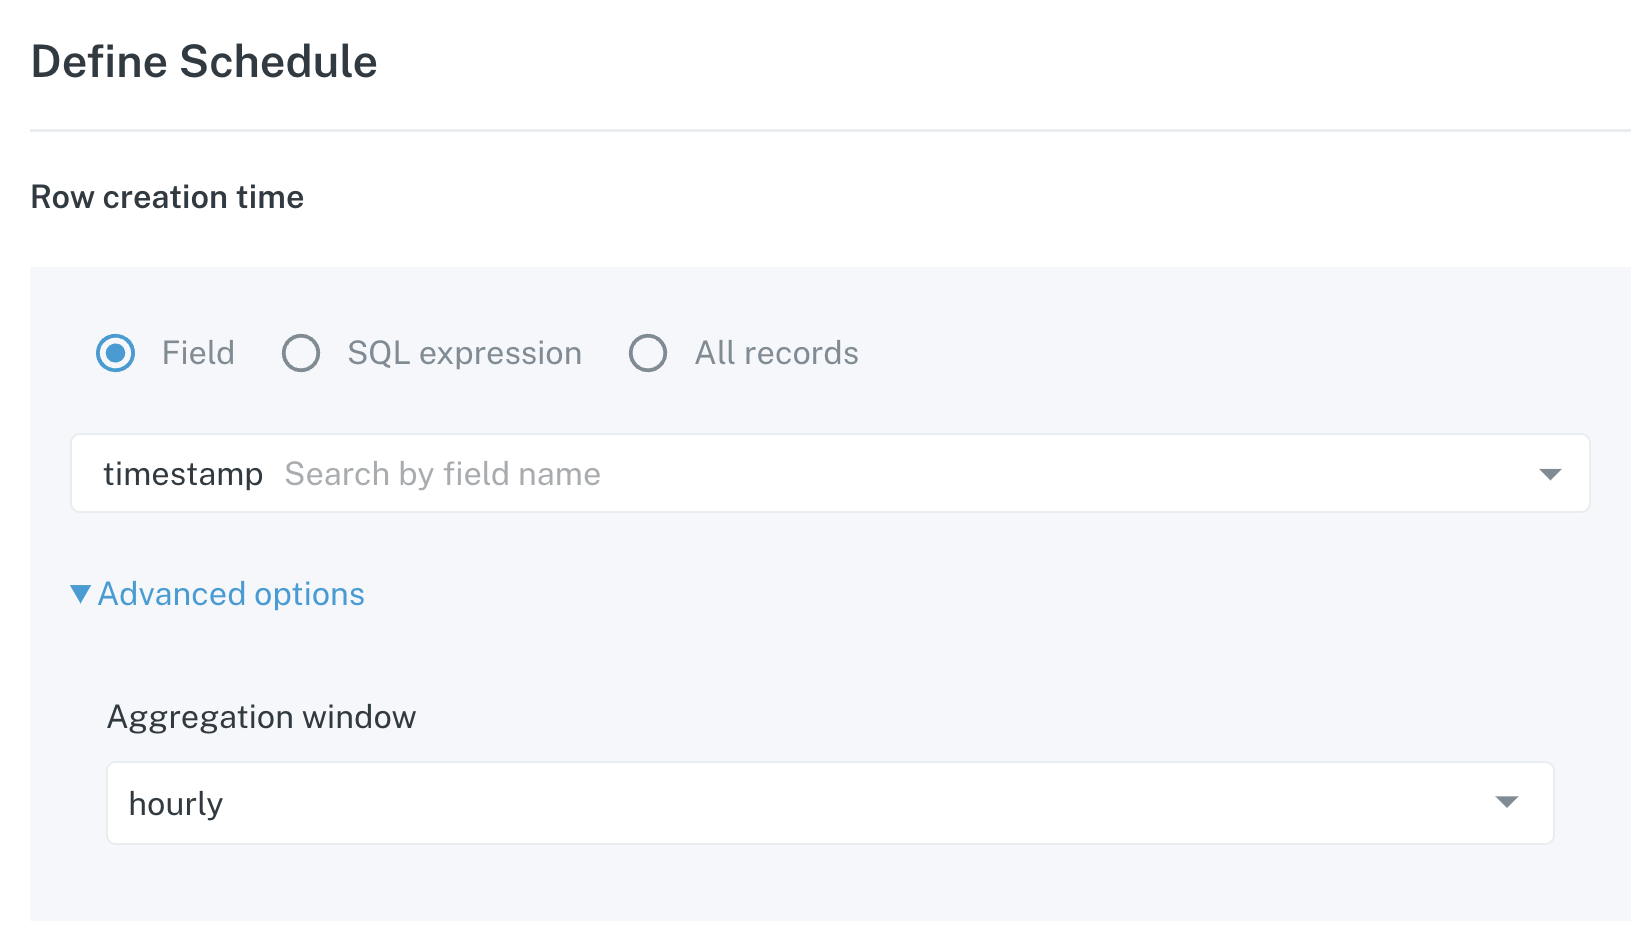
Once you've made your decisions there and you press to continue, there are a number of other options that you need to include as well. First we ask for the row creation time, this is the timestamp that we will use to graph and set the baseline for all thresholds on these metrics over time. In this example, we have the measurement timestamp or just a timestamp field within this table. Based on which one I choose, I will then be collecting data and bucketing it based on that timestamp either on an hourly basis or a daily basis, which is one of the next options.
I alternatively, in the case that there is no custom timestamp, could also put in my own custom SQL expression to convert any field within the table that might be convertible to a timestamp.
The last option here is all records. If this is chosen, we will check the entire table every time and graph it as such. In most cases, the field will be the option you'll want to choose. And we have a number of advanced options as well.
Within the advanced options, you have the choice to aggregate on a daily basis or an hourly basis. This is an important factor because this is how we are then baselining all of our machine learning. If you choose to look hourly, we will bucket all of the data and all of the metrics on an hourly basis based on this timestamp. Alternatively, if you choose daily, we will then bucket it daily.

You have the options to choose different monitor schedules. By default, we'll run this monitor every 12 hours to collect new data, or alternatively, you can choose your own custom monitor schedule or dynamic. With dynamic we will actually leverage our out of the box freshness monitors to see when the table is updated. When it is updated, we will automatically trigger to pull the newest data for this table. One thing worth noting here is for tables that are updated quite frequently we generally recommend against this option.
I hope this was helpful and please feel free to reach out via our Support Agent if you have any more questions!
Updated 2 days ago
Check out setting up Field Health Monitors
