Using Monte Carlo's Incident IQ
The goal of this guide is to provide insight into how the available tools in Incident IQ can be used for easy triaging, root cause analysis, and understanding downstream impact of anomalies detected.
The Incident IQ page is accessible from the Incident feed by clicking "View Incident IQ" on any of the Incident cards.
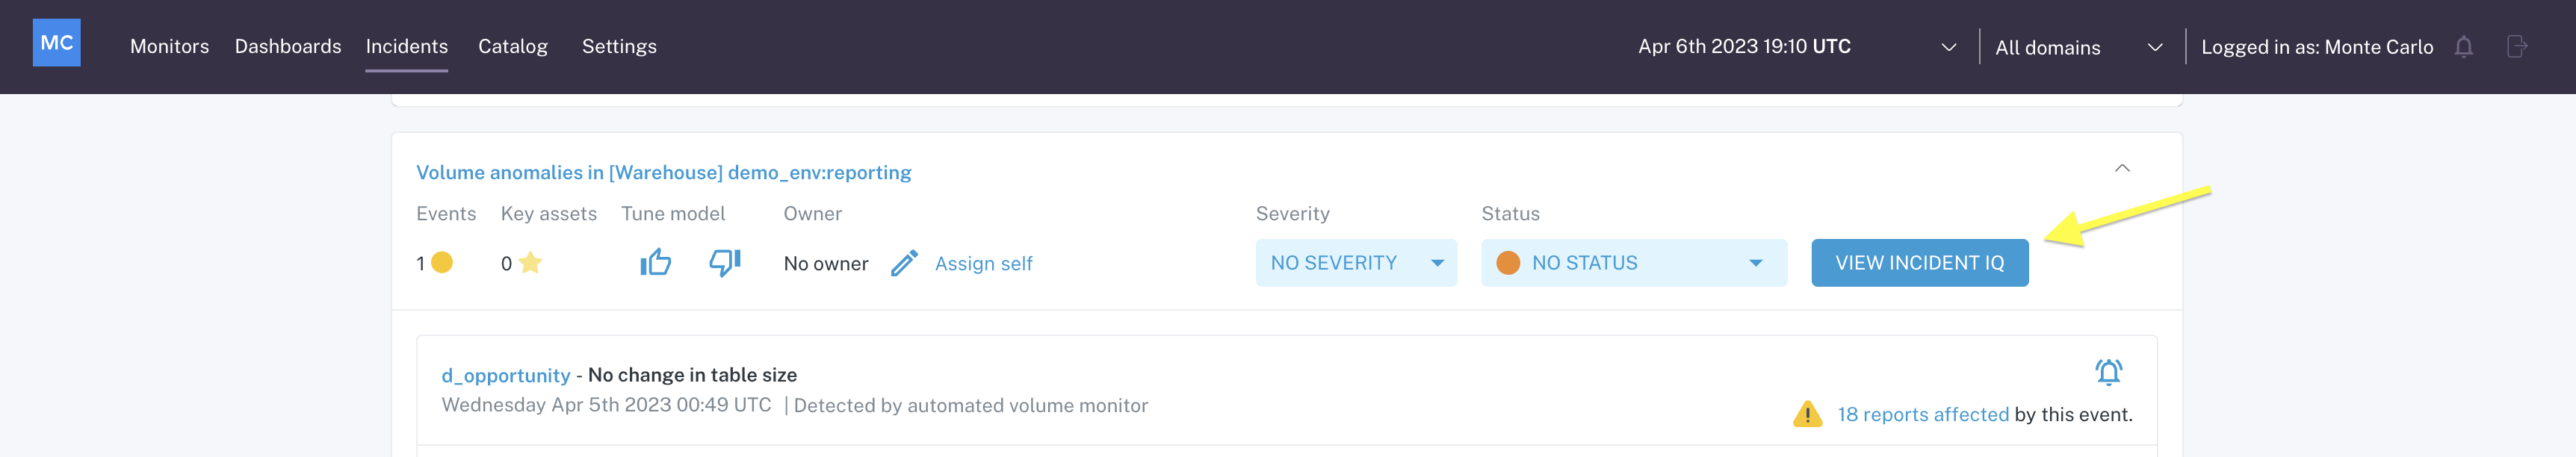
Incident card in Incident Feed
Upon click, you are taken to the Summary page in the Incident IQ.
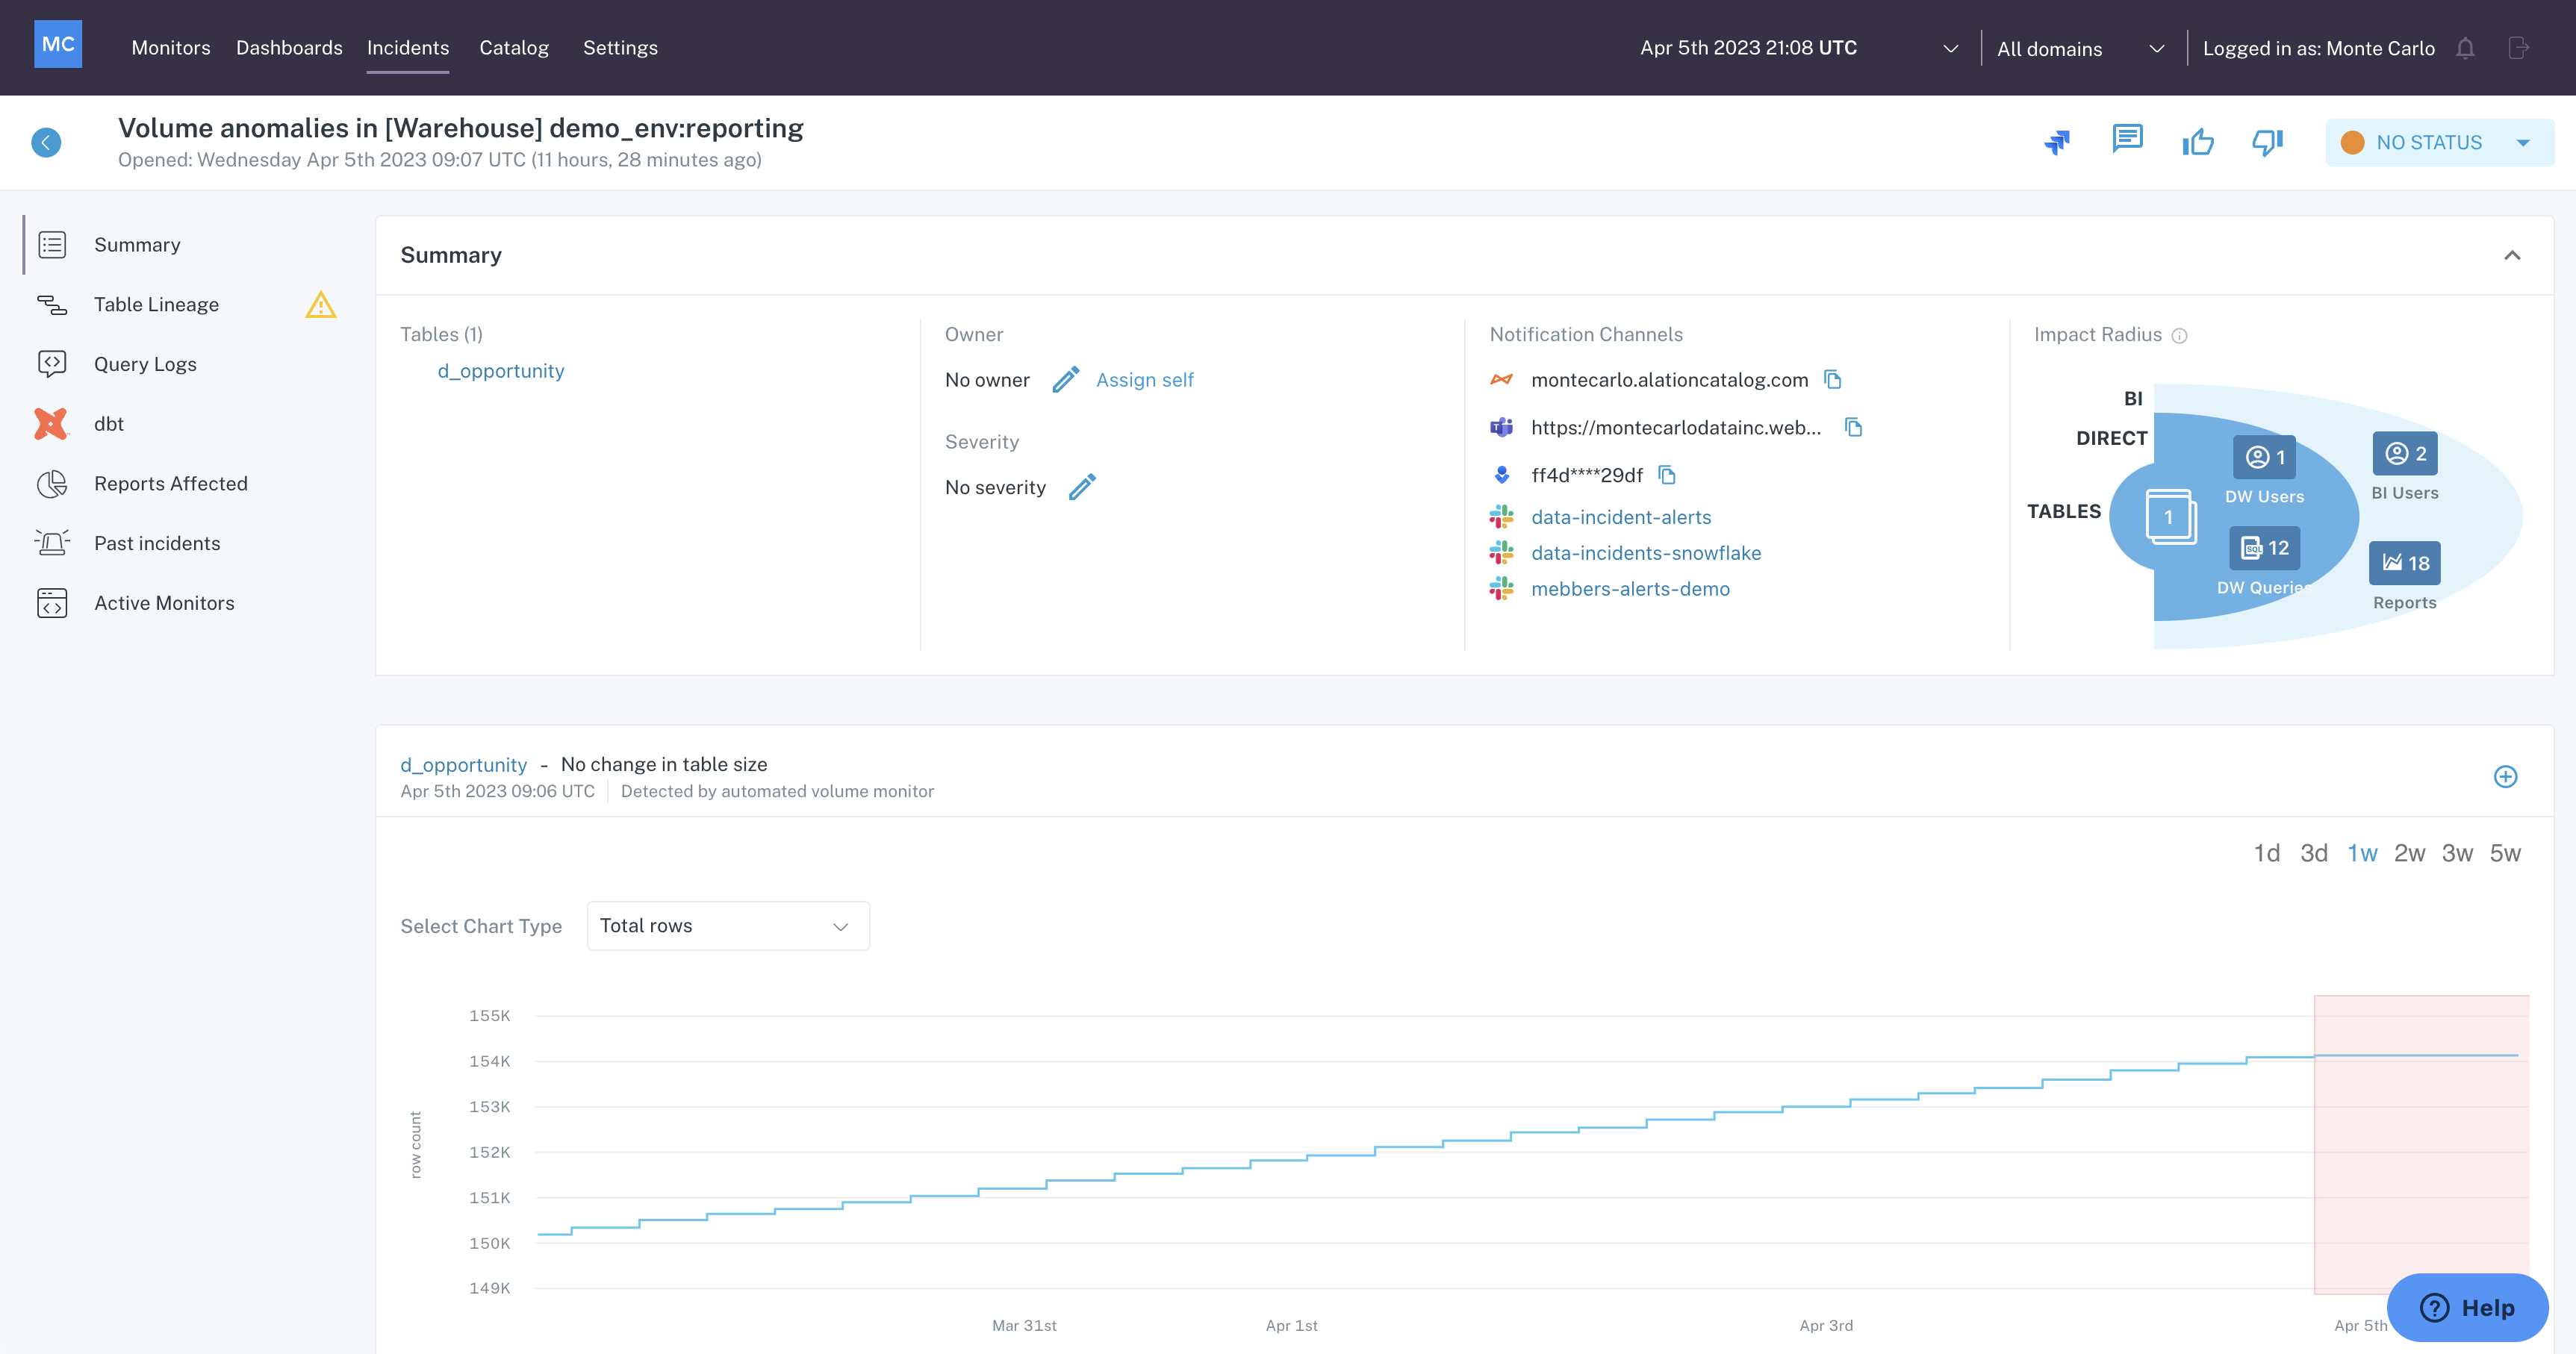
Incident IQ page
In the left hand navigation are many tools that enable research into the incident. The sections below describe each of the options and how they can be used.
Summary
The Summary menu is the landing page of Incident IQ and contains a quick view of the incident details.
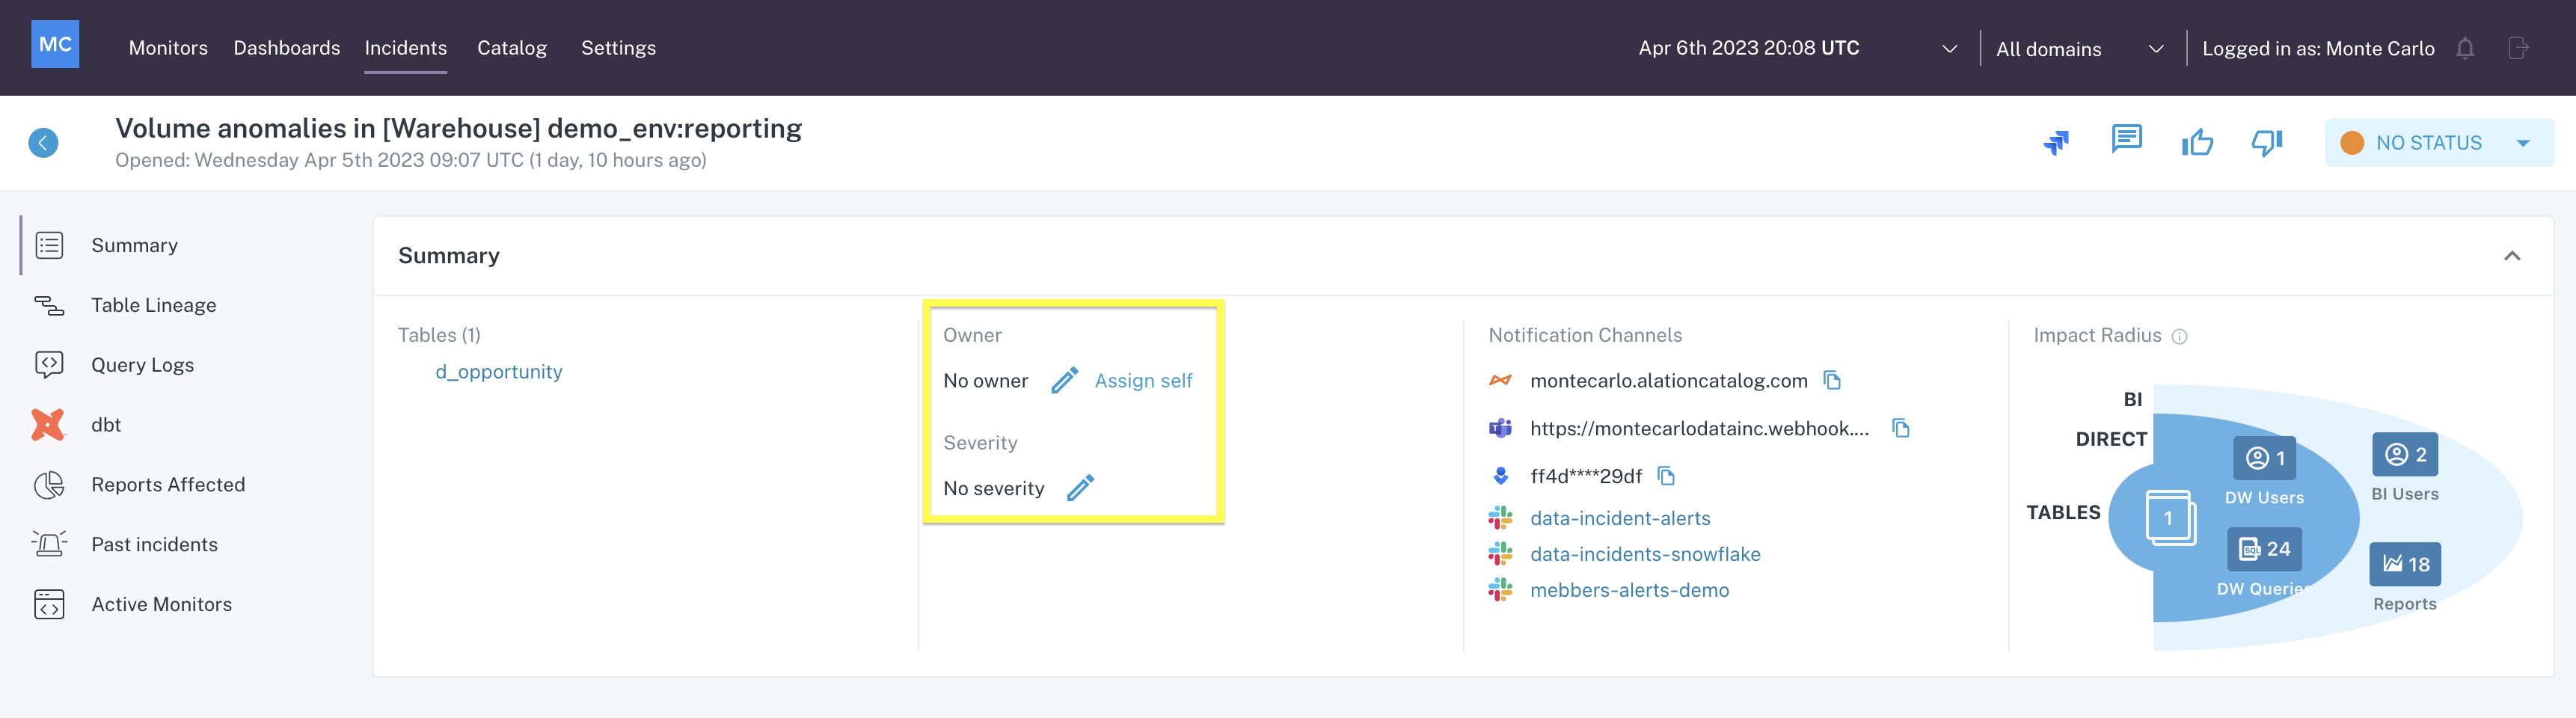
Within the top Summary section of the Summary menu, you can see the high-level details about the incident.
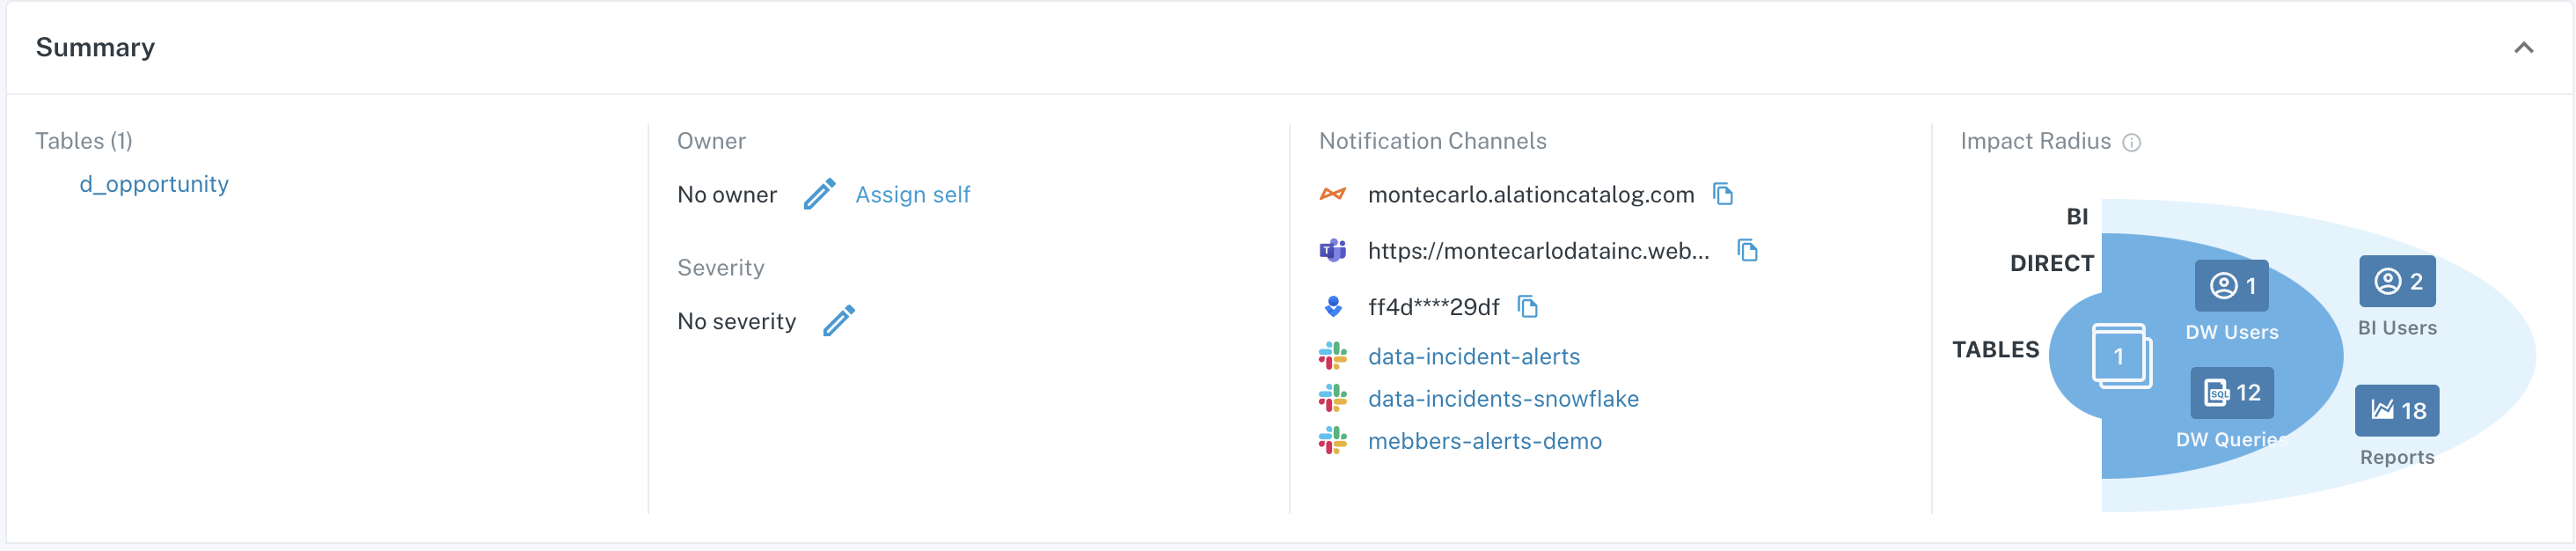
Summary section on Incident IQ
Here, the following information is provided:
- Tables - a list of tables involved in the incident. Clicking on a table in this list will take you to the Catalog page for that table.
- Owner - the person responsible for investigating the incident. Manage ownership of the incident by clicking the edit icon, selecting an owner, and clicking Save.
- Severity - the severity of the incident as indicated by No Severity or SEV-0:4. Typically, SEV-0 indicates highest level of impact, and SEV-4 indicates least impactful. Manage severity of the incident by clicking the edit icon, selecting a severity, and clicking Save.
- Notification Channels - a list of Notification Channels which were alerted to this incident. Clicking on a Slack Notification Channel will take you to that channel in your Slack instance.
- Impact Radius - a visualization of the impact of the incident as it relates to Users/Queries/Reports which are dependent on the affected table(s), based on data in Query logs for the table. Clicking on the tiles within this visualization will open a drawer in the UI where you can see the Users/Queries/Reports potentially affected by the incident.
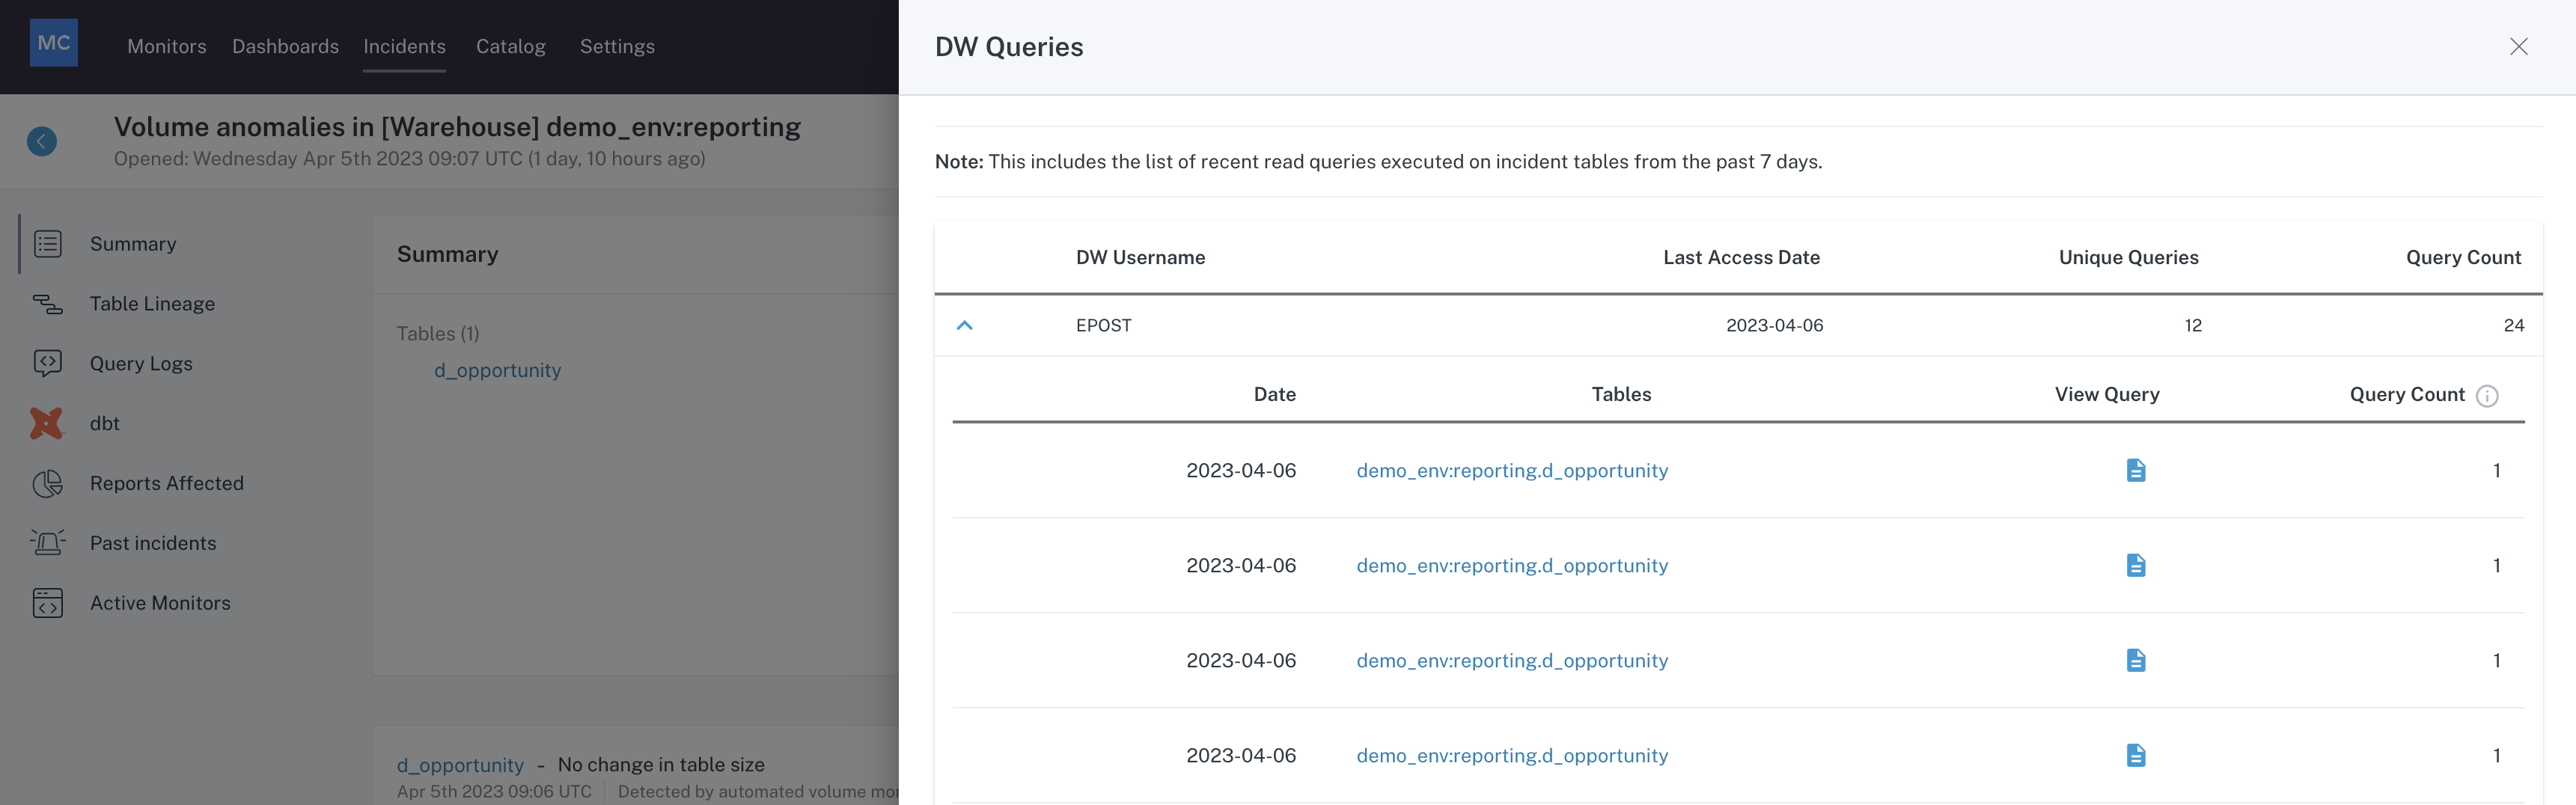
Impact Radius drawer
Below the top Summary section is a graph which provides visual insight into why the incident was raised.
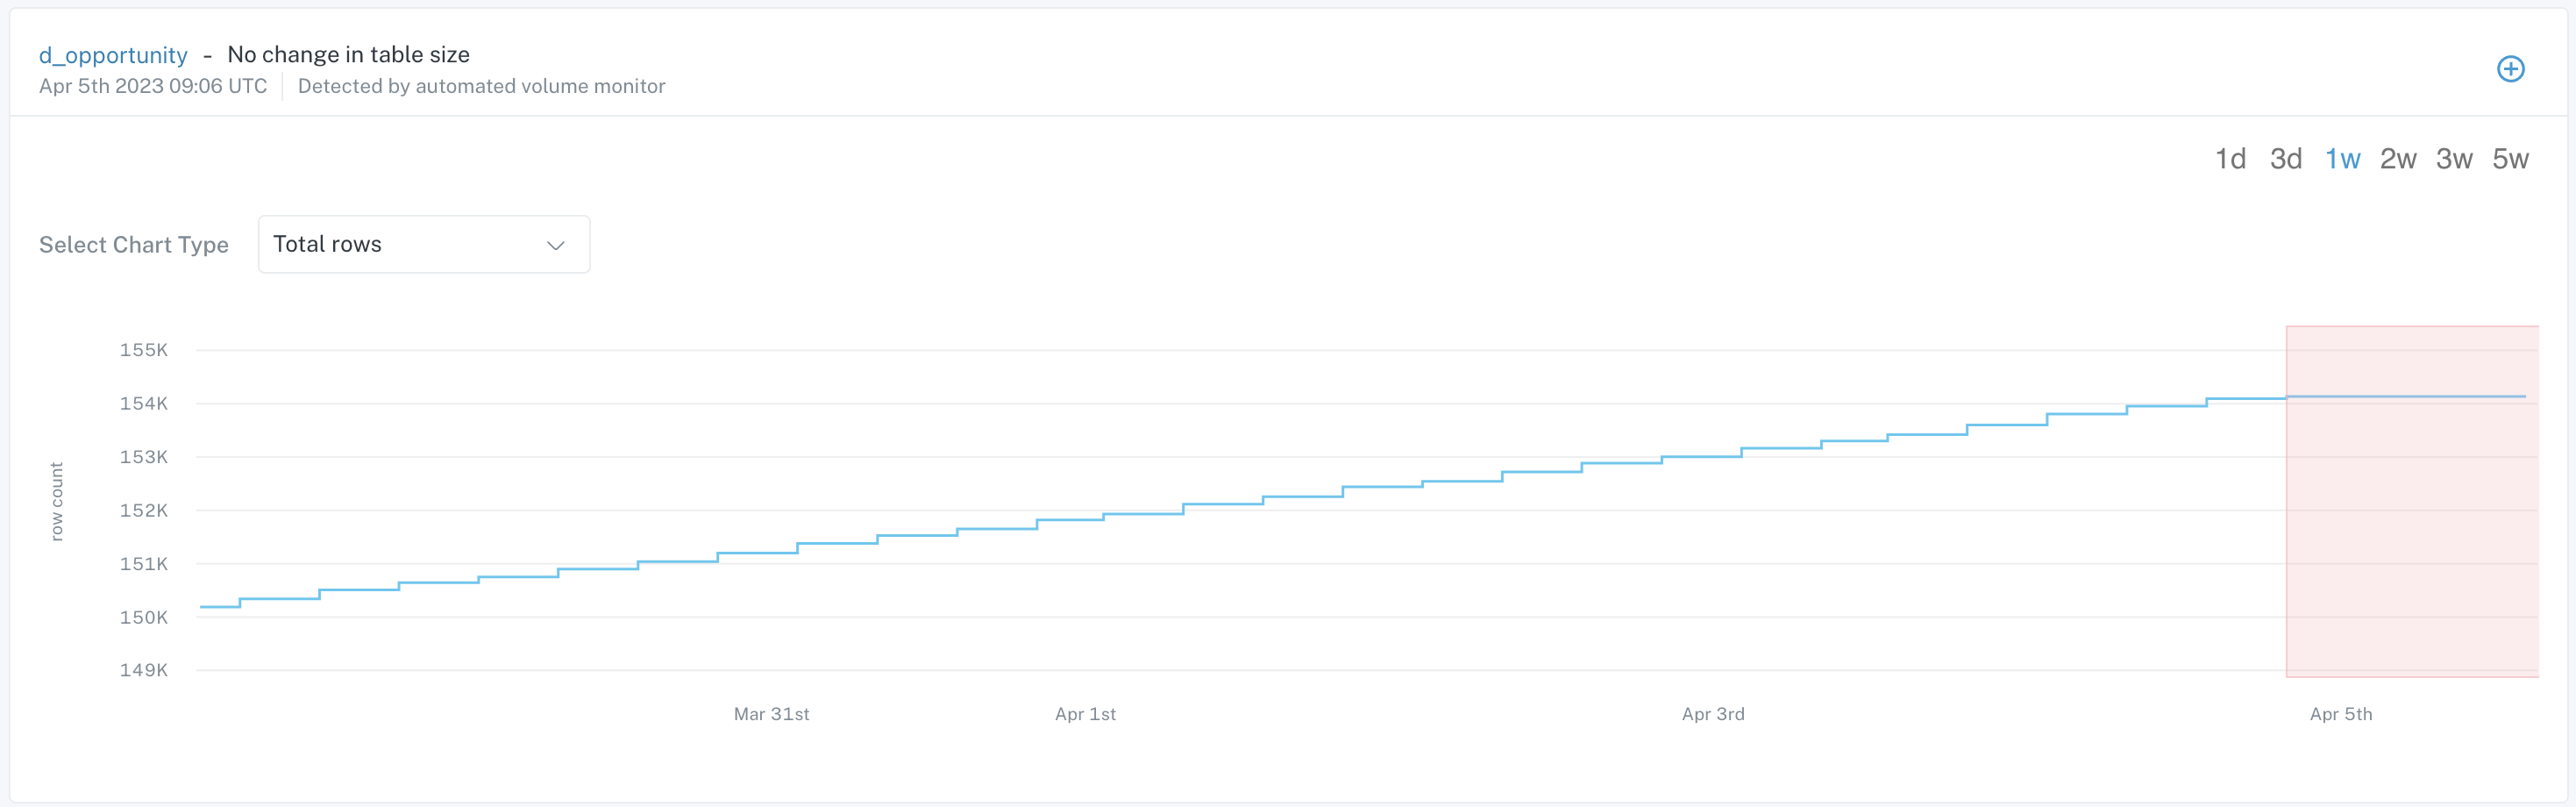
Graph on Summary menu of Incident IQ
In this example, the incident originated from an automated (out of the box) monitor which tracks patterns in Volume change -
- The blue line on the graph represents the change in Volume over the previous week.
- The section highlighted in red indicates a deviation from the normal pattern.
In this case, the deviation is a halt in Volume changes. In other words, the table has not changed in size as expected based on historical trends.
Table Lineage
The Table Lineage menu of Incident IQ provides insight into tables upstream and downstream of the affected table.
From here you can trace data upstream, to investigate root cause...
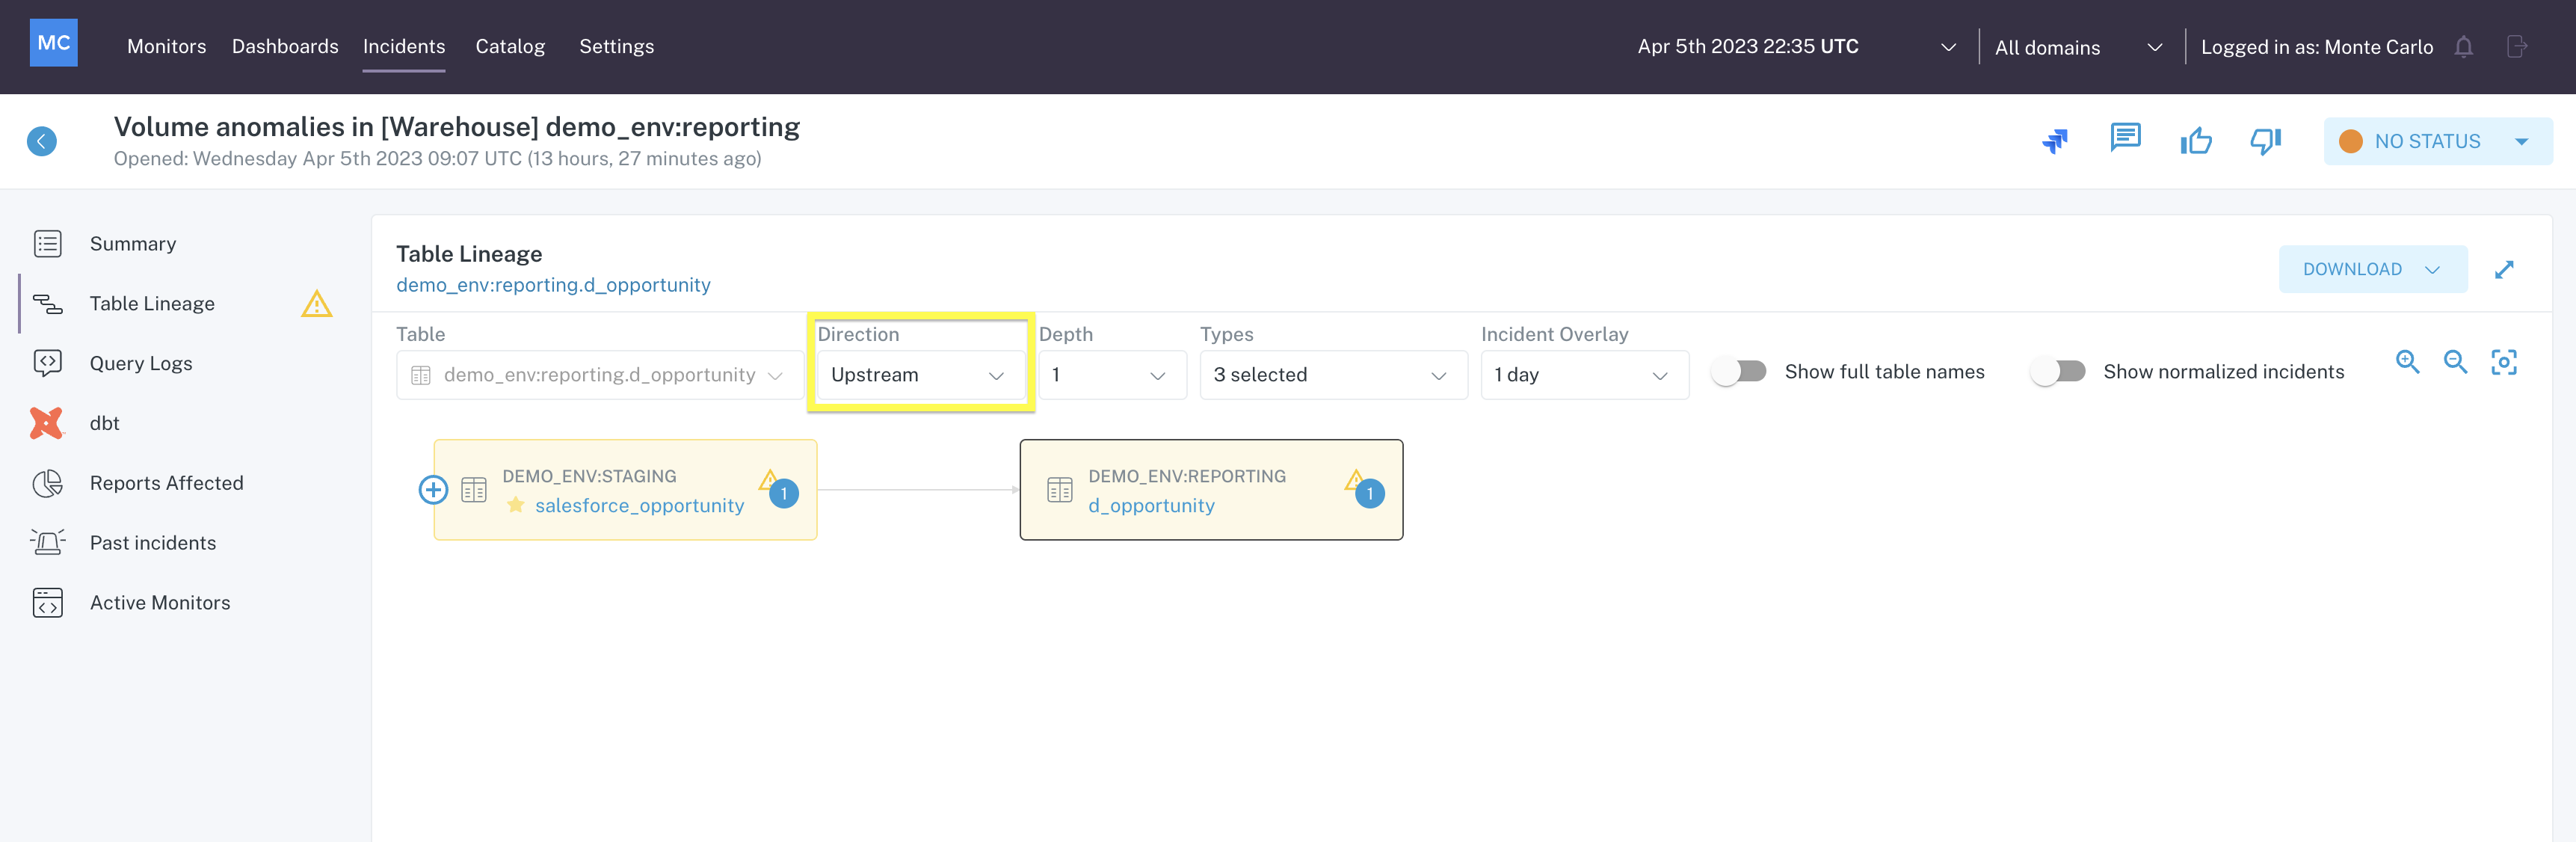
Table Lineage menu in Incident IQ showing Upstream nodes
... and downstream, to understand the impact of the incident.
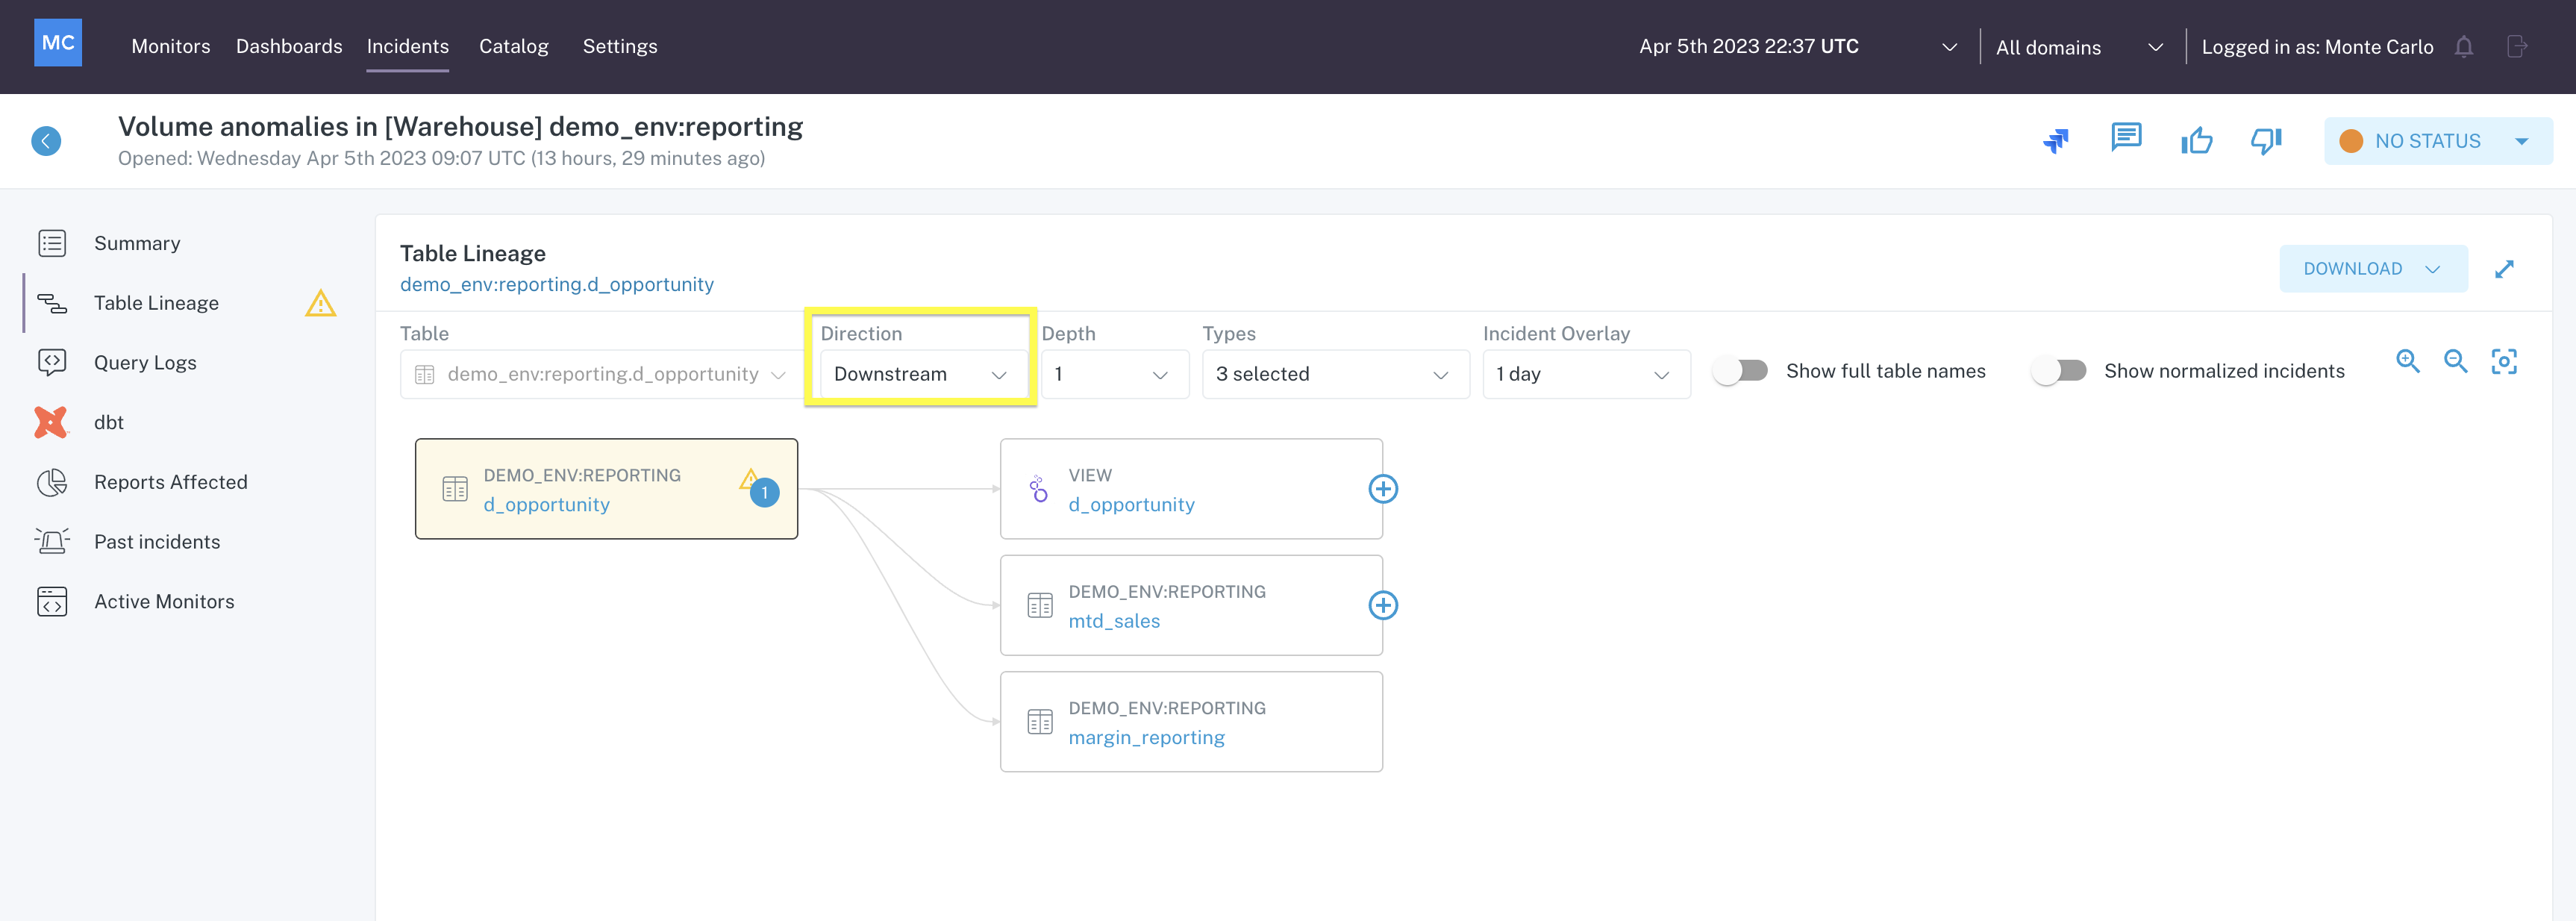
Table Lineage menu in Incident IQ showing Downstream nodes
In the example, some nodes are filled in yellow indicating that an Incident exists on that node.
Hovering over the node provides some detail about the Incident related to that node as well as a link to the Incident.
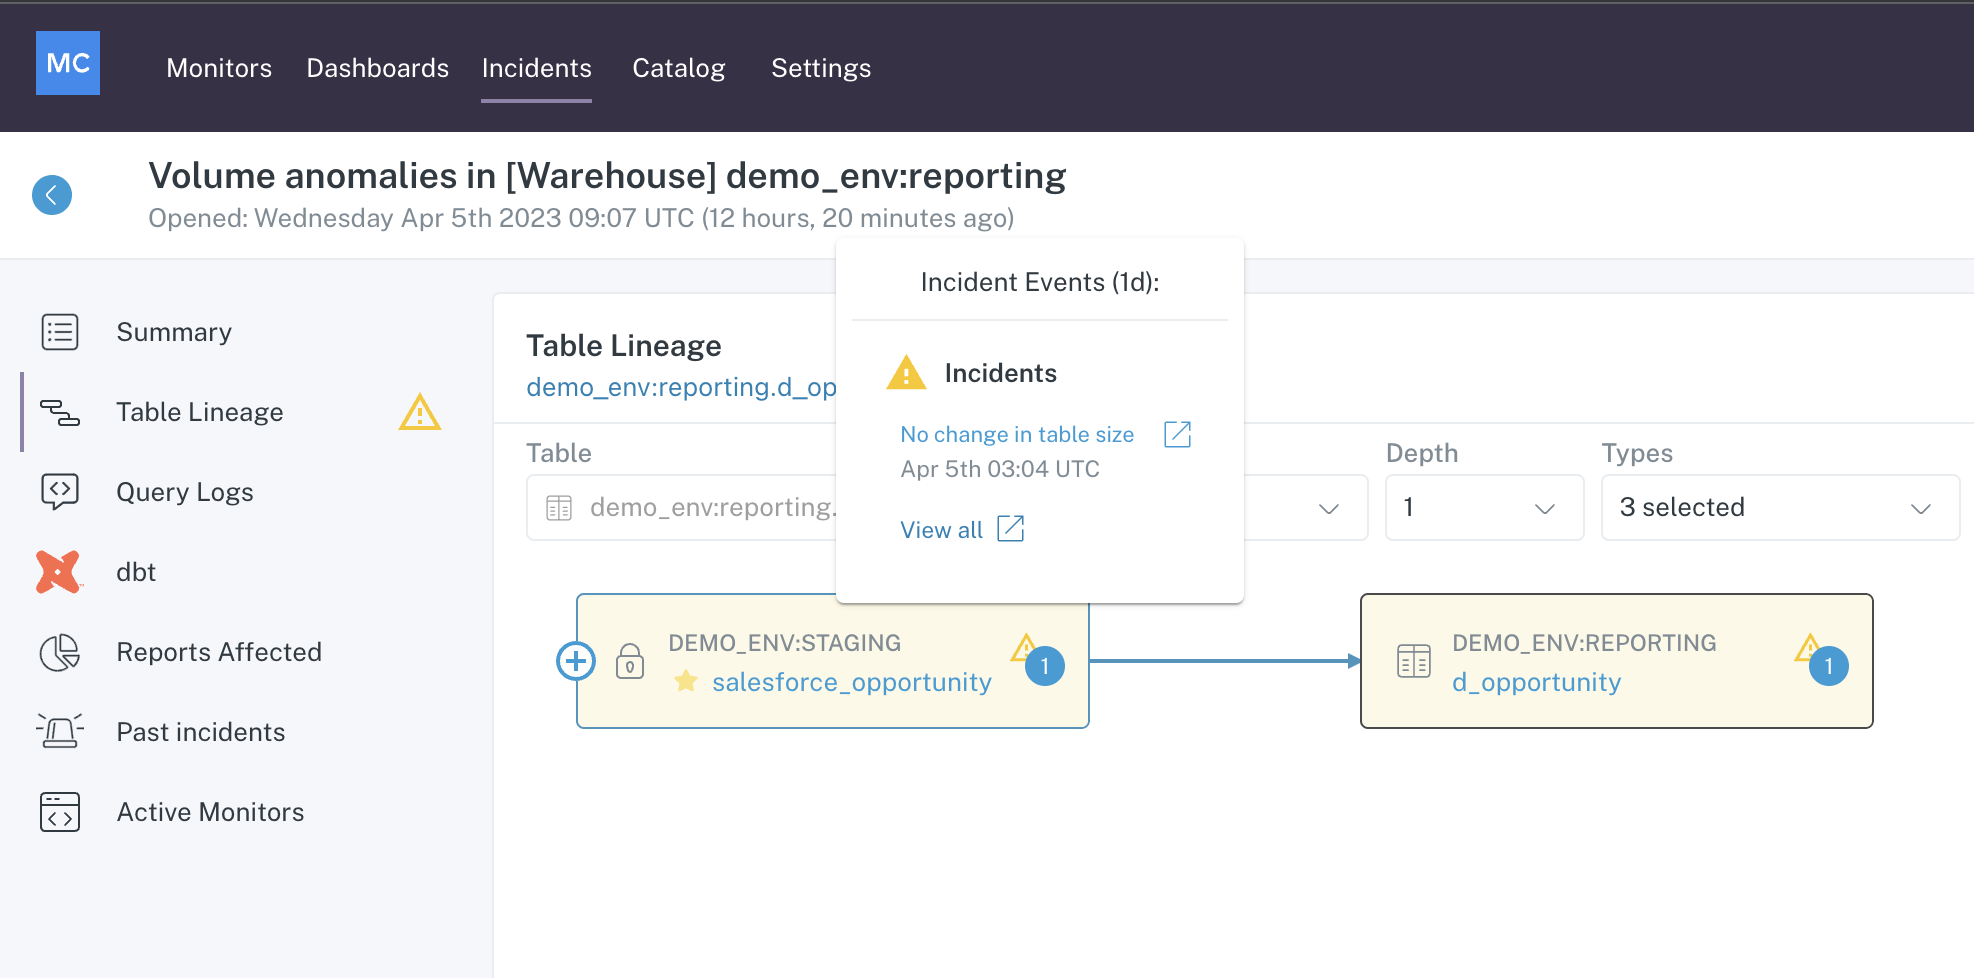
Table Lineage menu in Incident IQ showing Incident on Upstream node
By alerting you to other anomalies detected in the platform, the goal is to shorten the time it takes to understand the full scope of the incident.
Query Logs
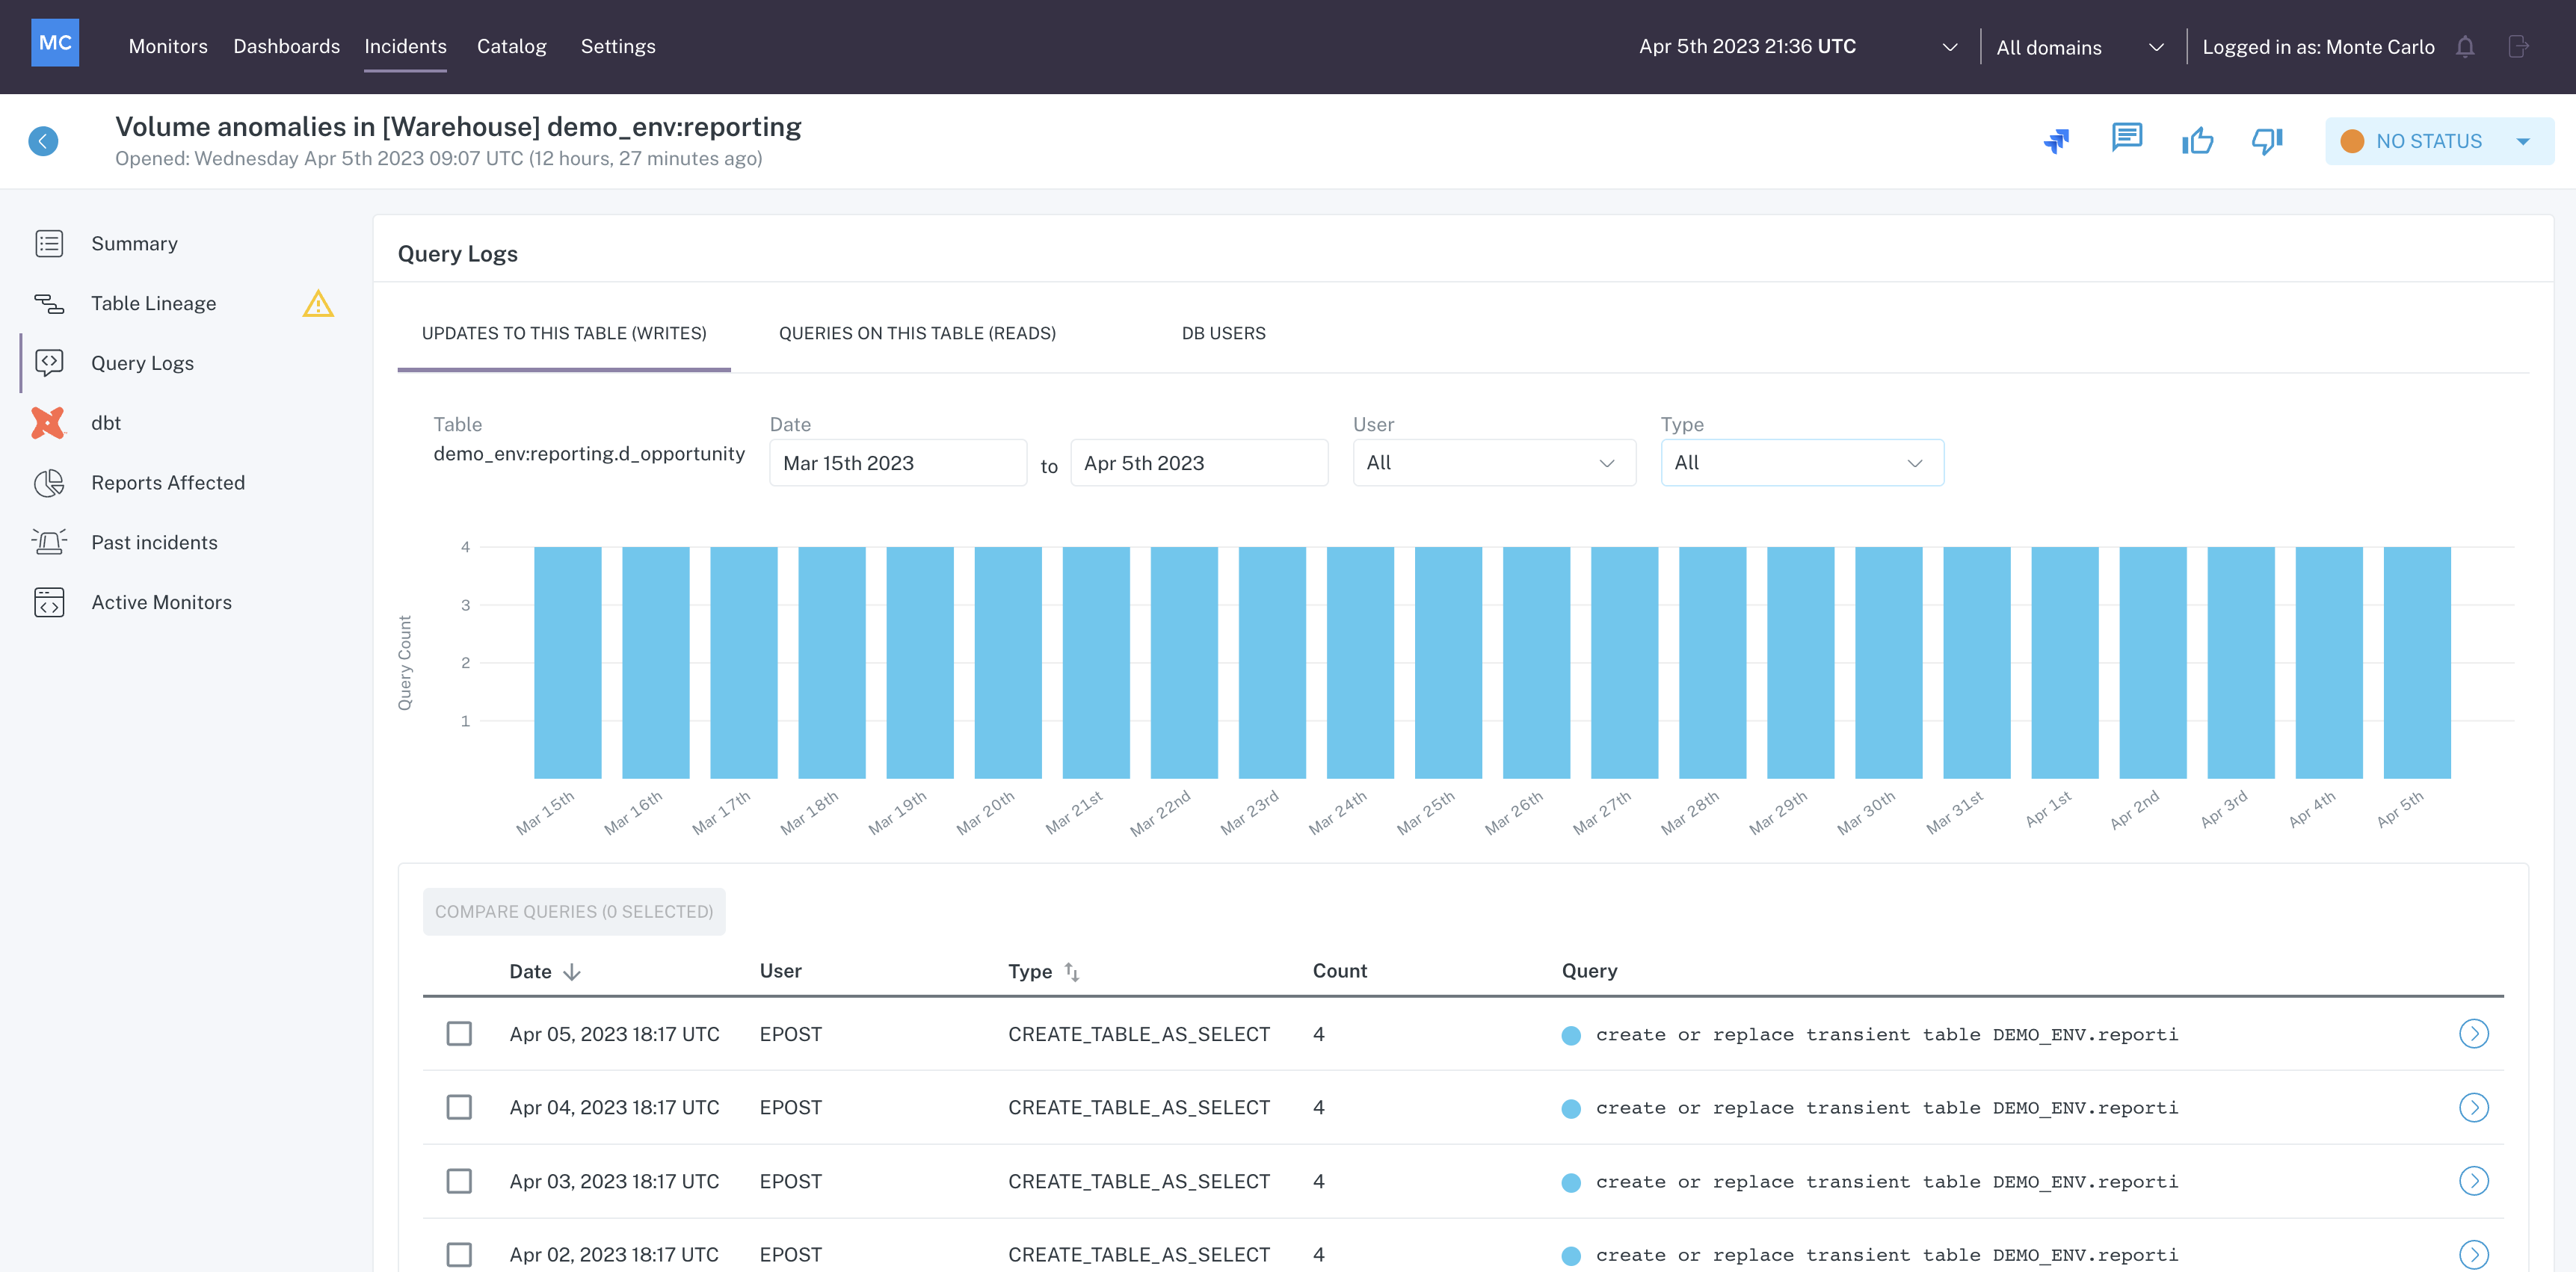
The Query Logs menu of Incident IQ provides insight into recent interactions on the affected table, including updates to the table (writes), queries on the table (reads), and DB users who have executed queries against the table.
These insights are accessible within their respective tab at the top of the Query Logs window.
Query Logs menu in Incident IQ
Updates to this table (Writes)
On the first tab, Updates to this table, a graph is shown which represents the number of queries per day which resulted in Writes.
Below the graph is a list of queries executed on the table that resulted in a Write operation. Clicking on an item in the list opens a modal containing Query Details.
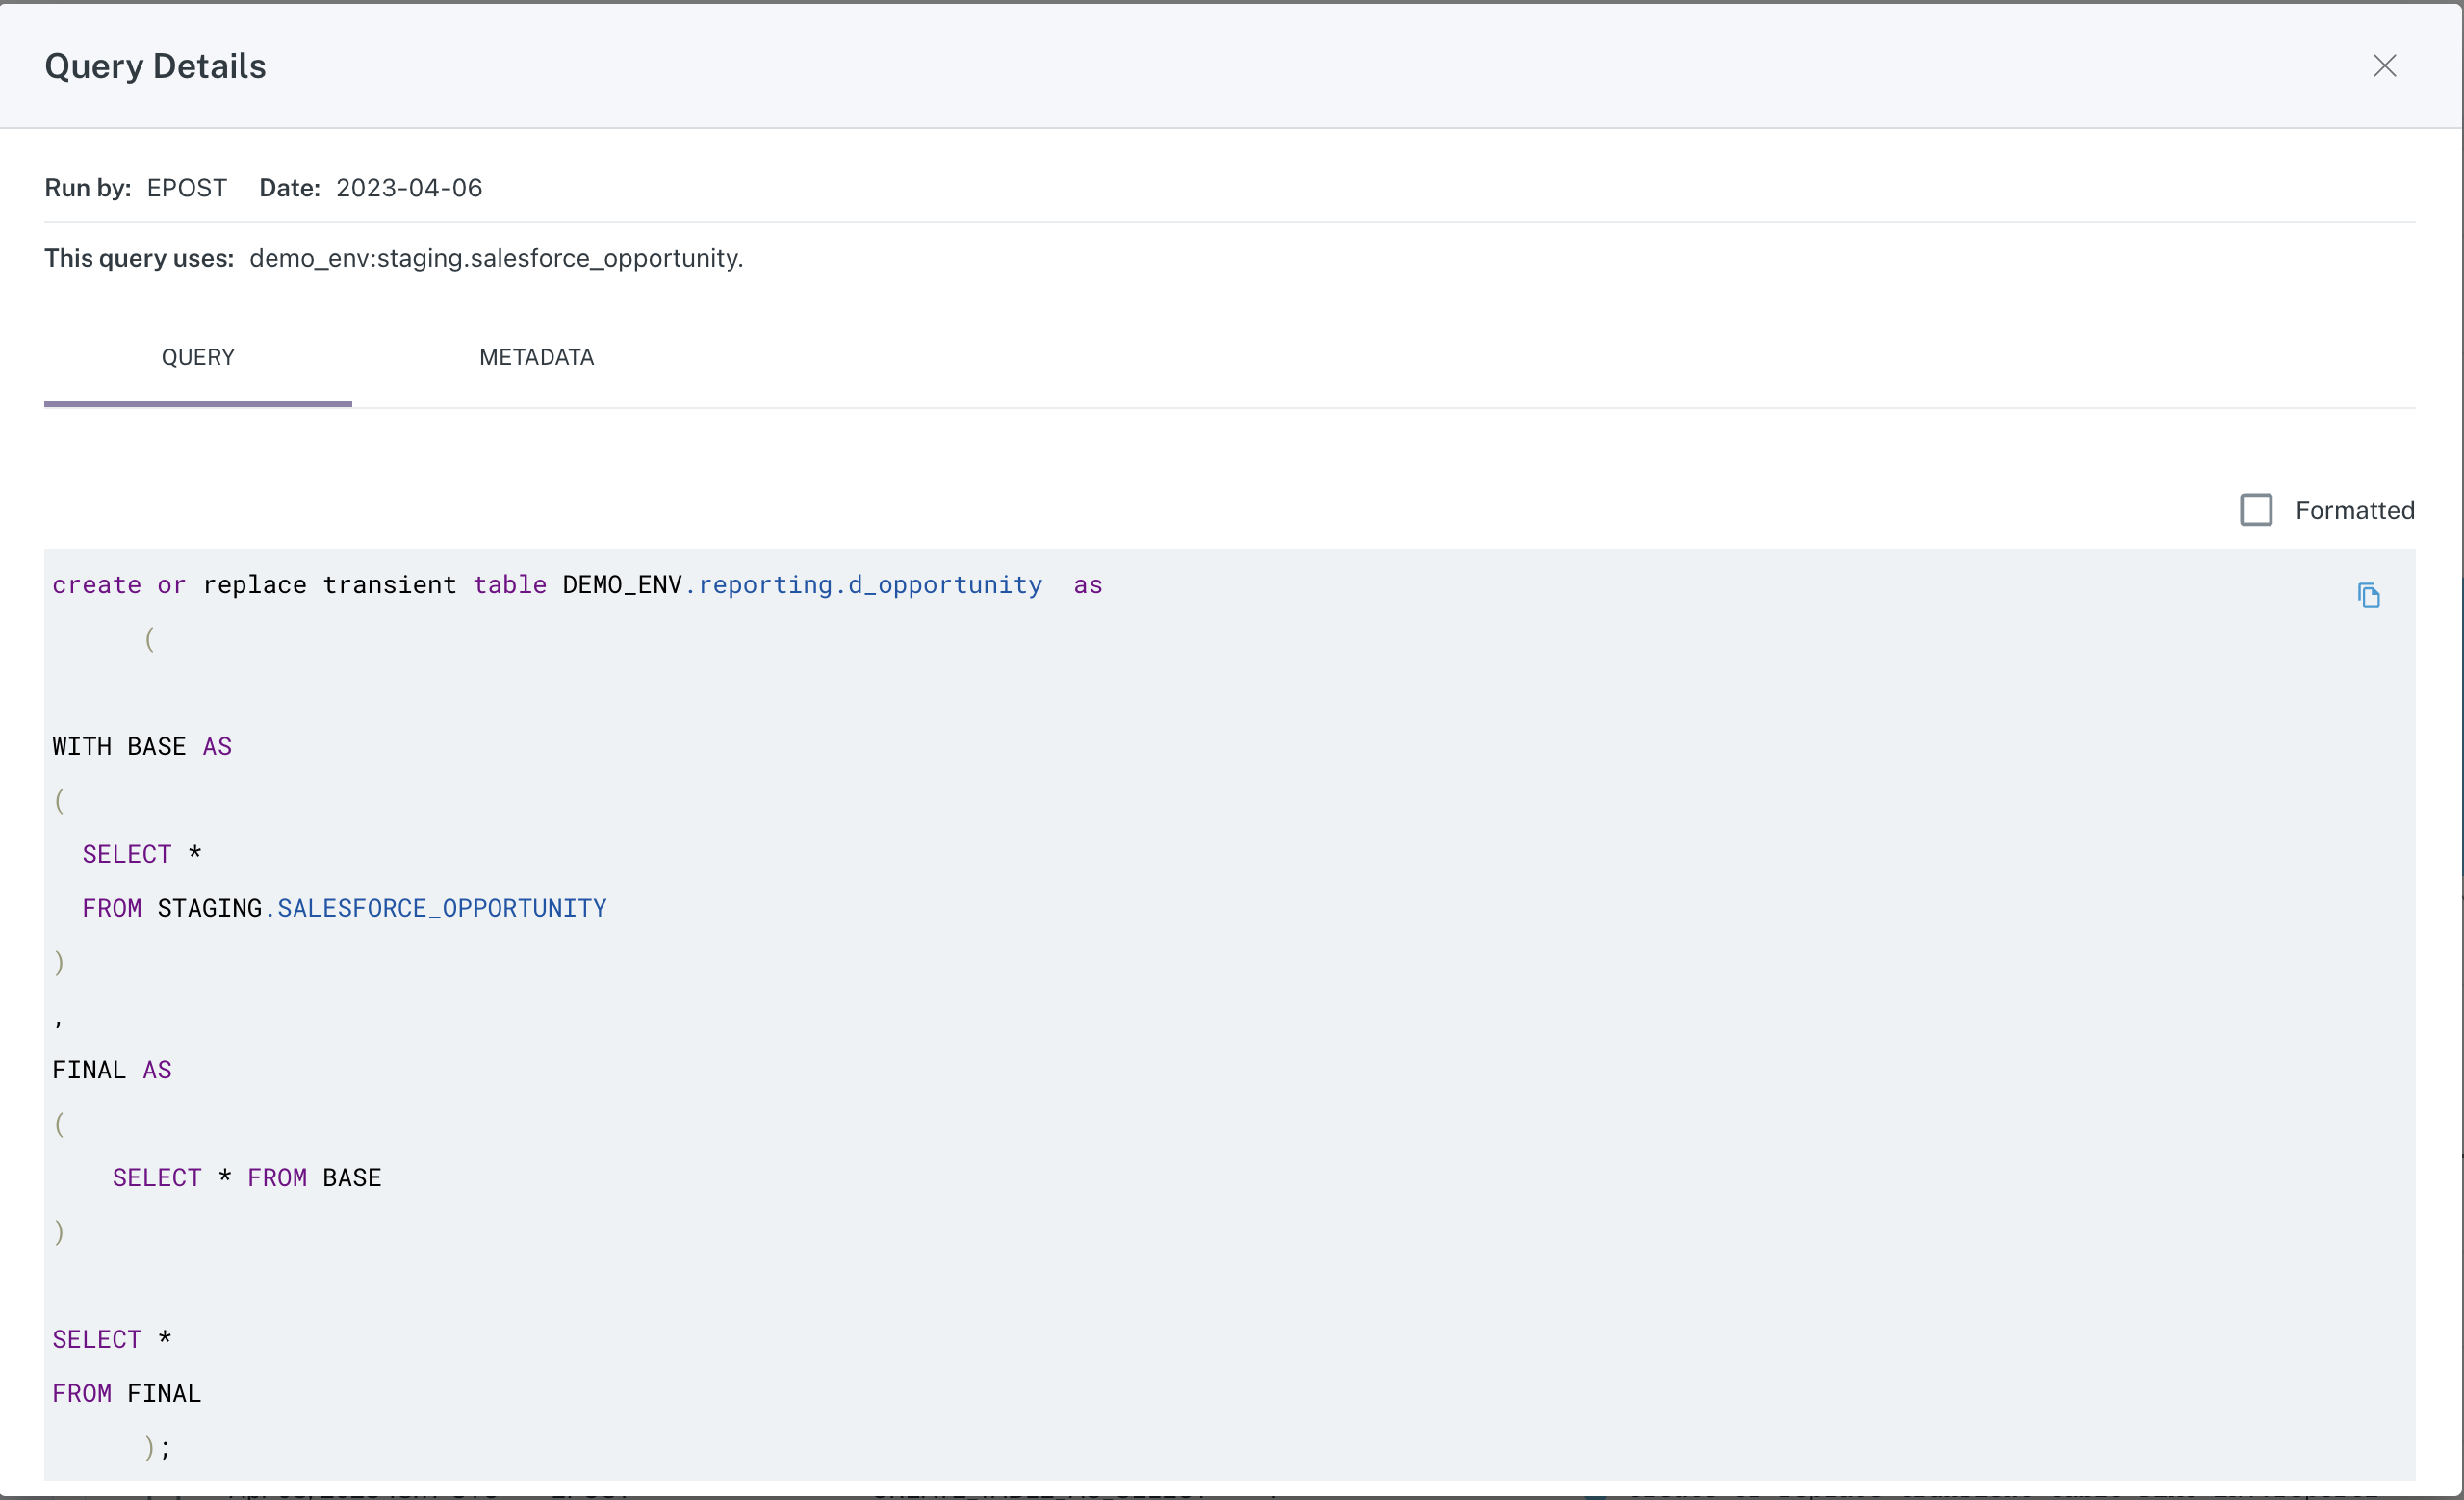
Query tab of Query Details modal
The second tab contains metadata for the query, including any error messages and information about what (if anything) was changed.
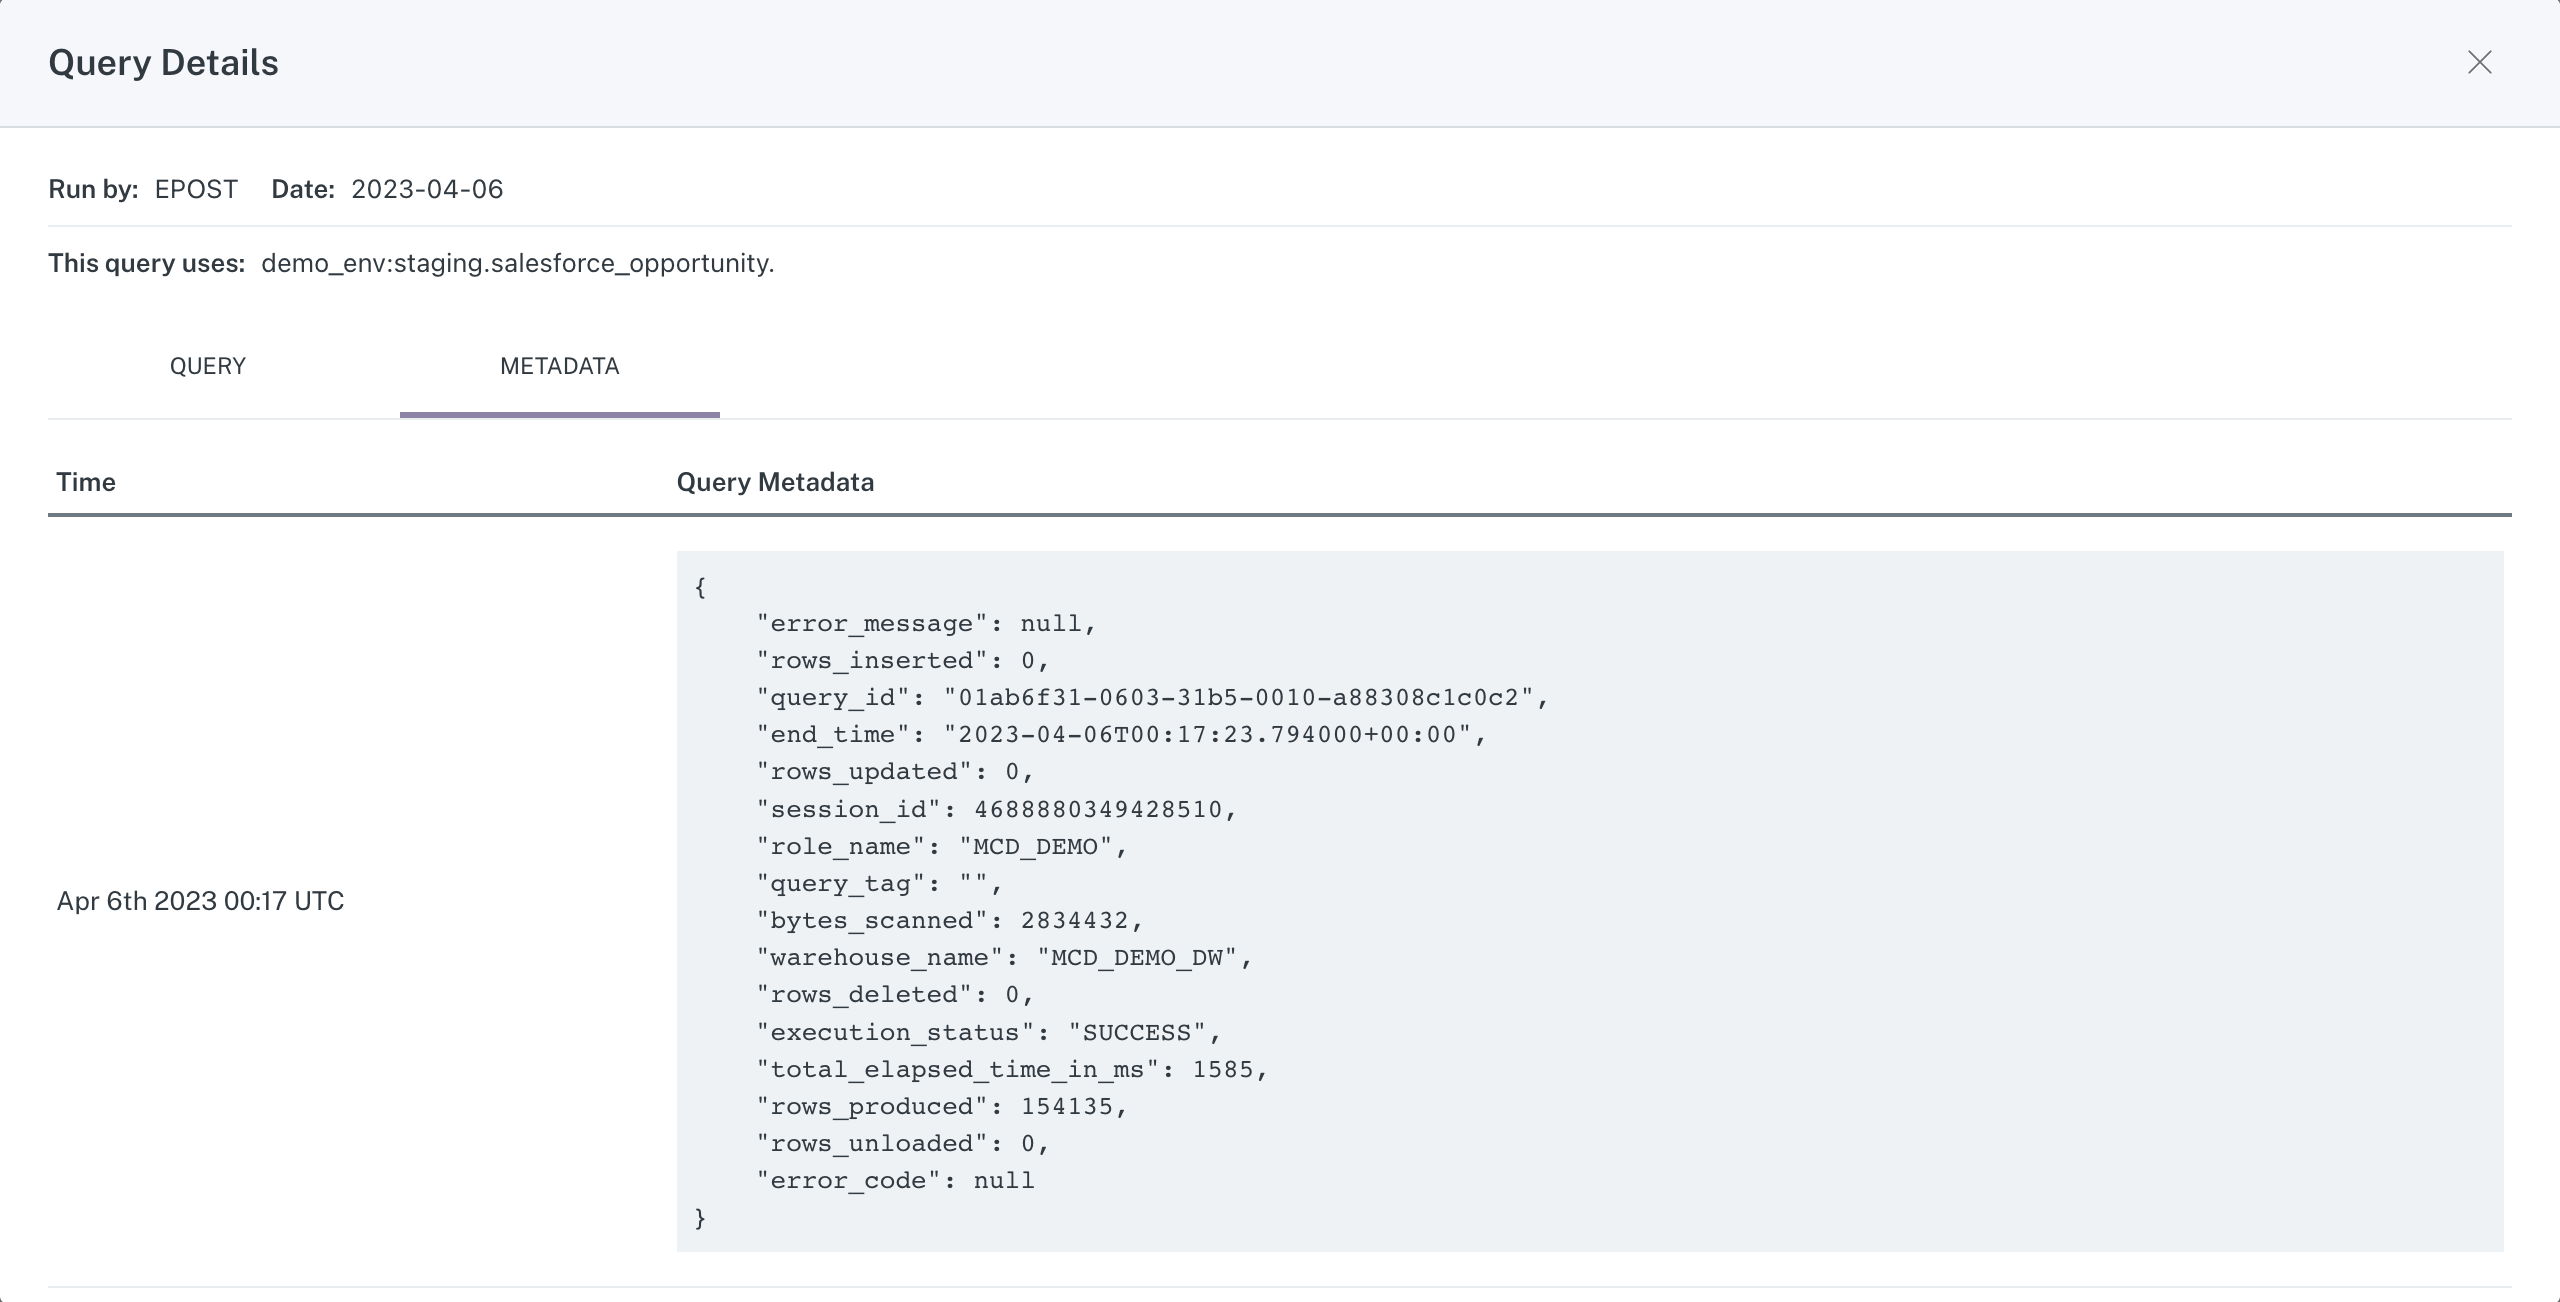
Metadata tab of Query Details modal
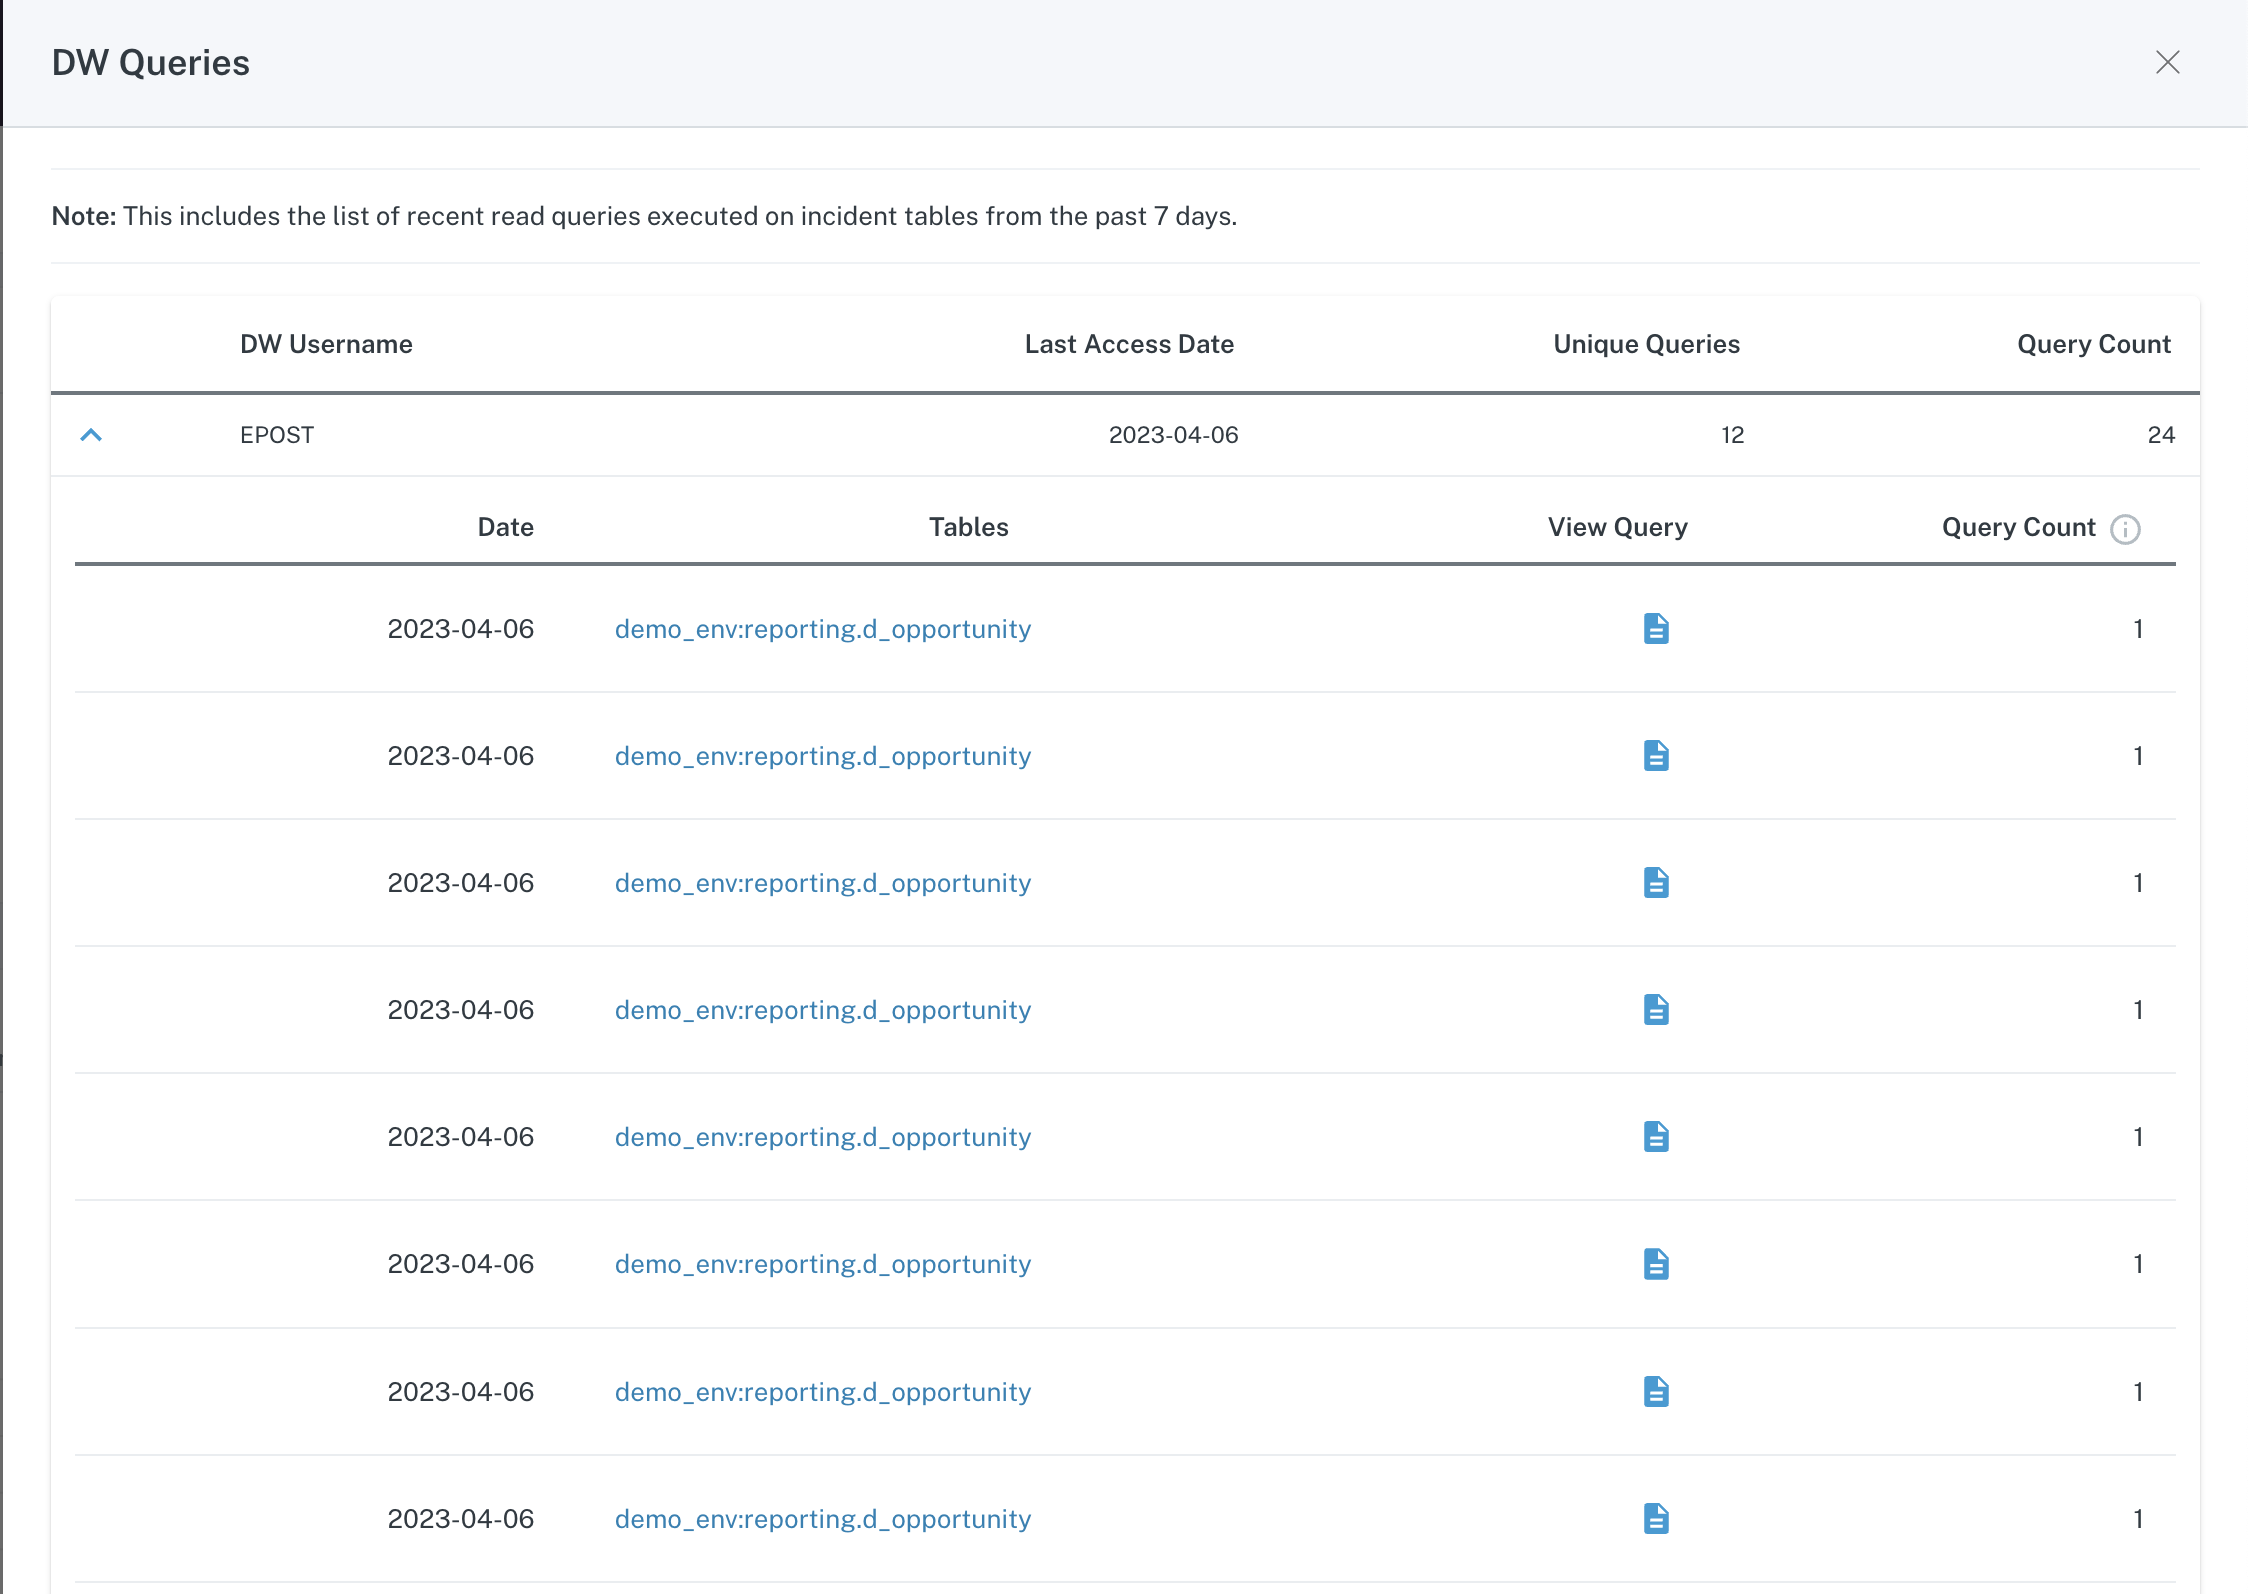
Queries on this table (Reads)
On the second tab, Queries to this table, is a list of queries executed on the table that resulted in a Read operation.
Similar to above, clicking on an item in the list opens a modal containing the Query Details, including the full query and the associated metadata.
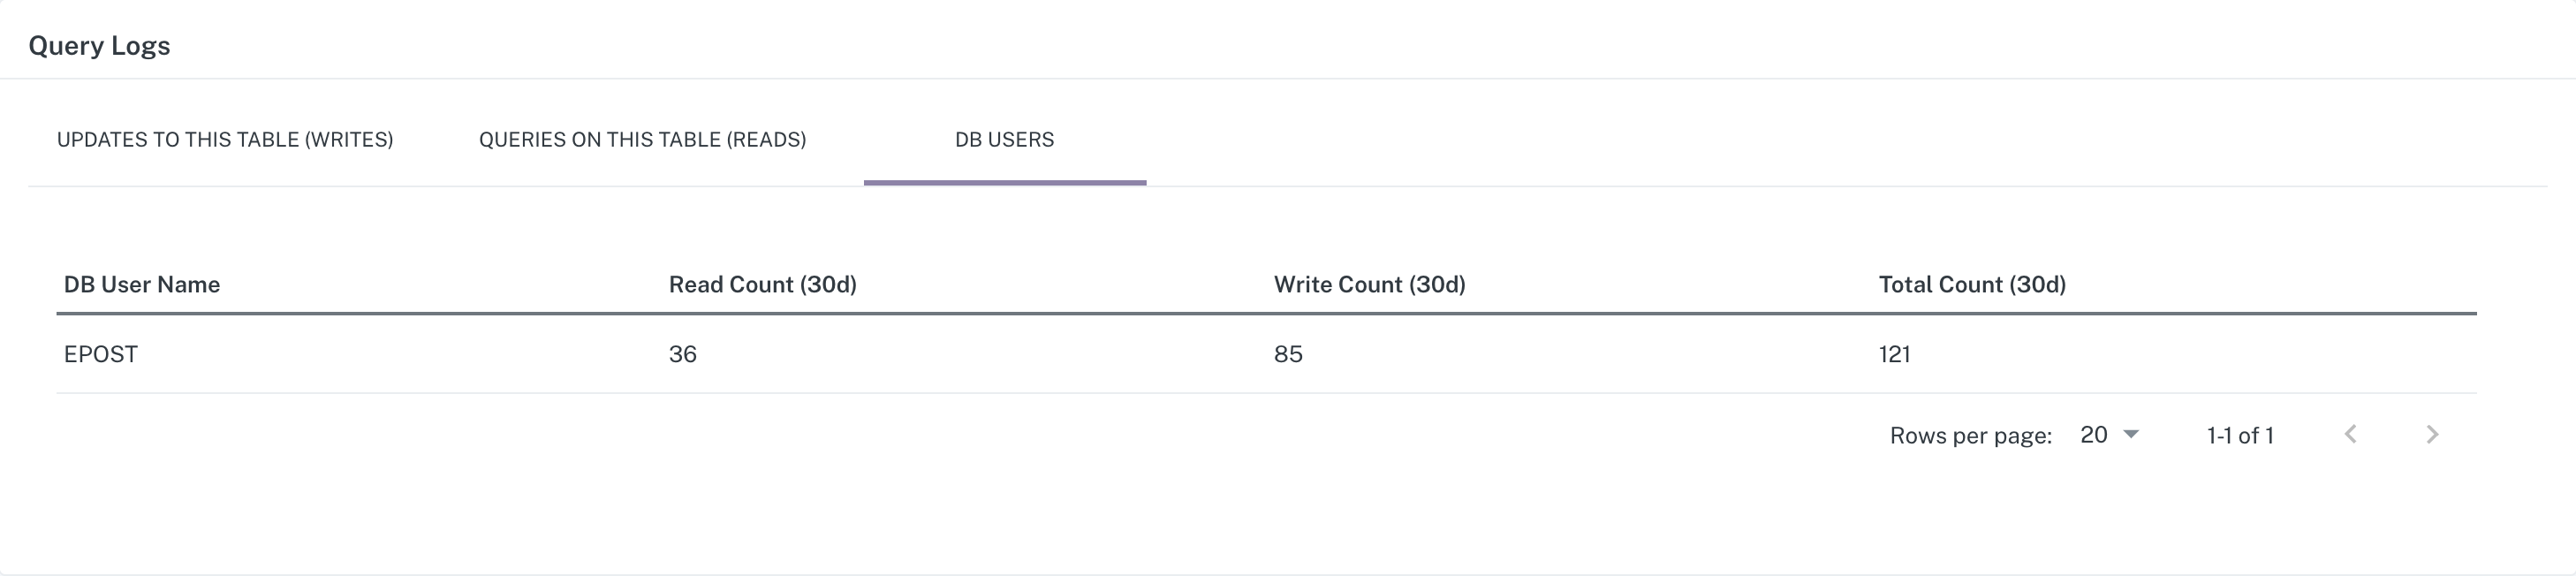
DB Users
On the third tab, DB Users, is a list of users who have executed queries against the table as well as the Read/Write/Total counts of queries over the last 30 days.
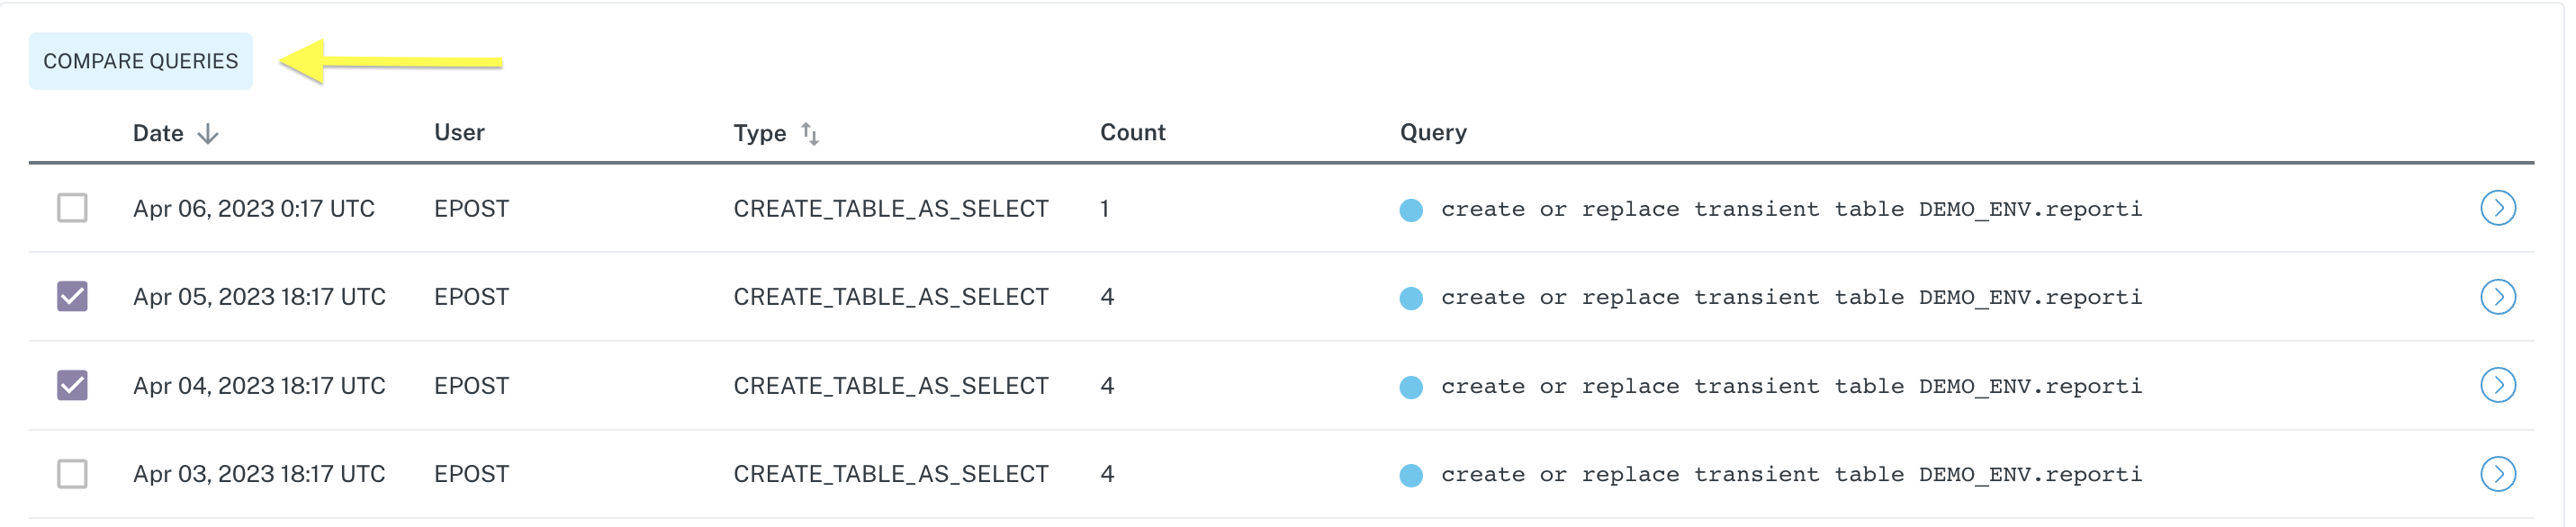
Comparing queries
It is easy to compare two queries from both query tabs within the Query Logs menu. From either tab, simply select the two queries you wish to compare and click the Compare Queries button.
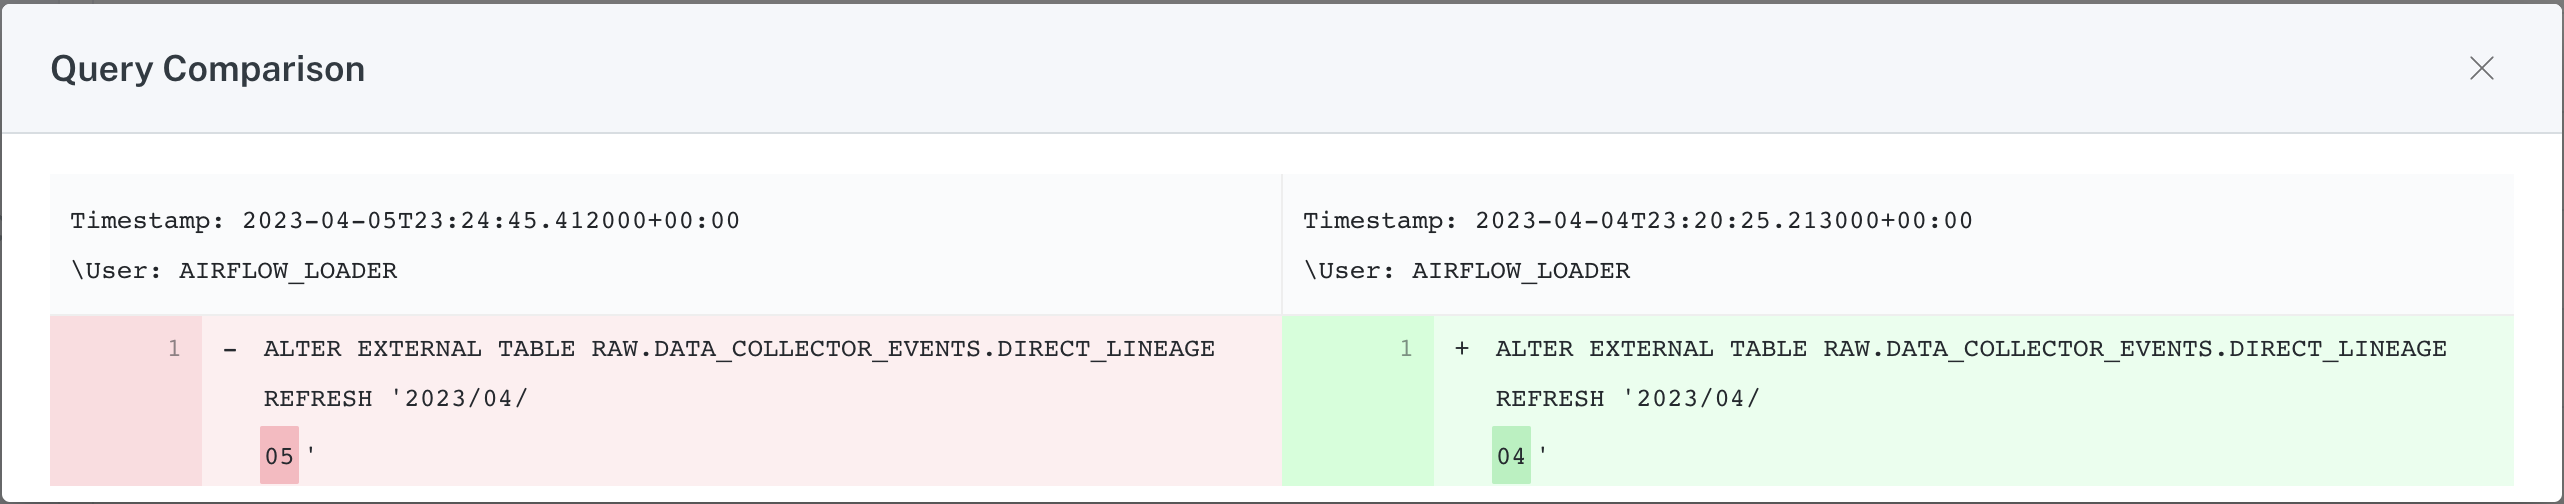
Upon click, a modal opens containing a diff of the two queries.
Reports Affected
The Reports Affected menu of Incident IQ provides insight into any BI reports that may be affected by the incident.
This view provides a list of Reports that are downstream of the table. Each item in the list contains details about a report that may be impacted negatively by this incident.
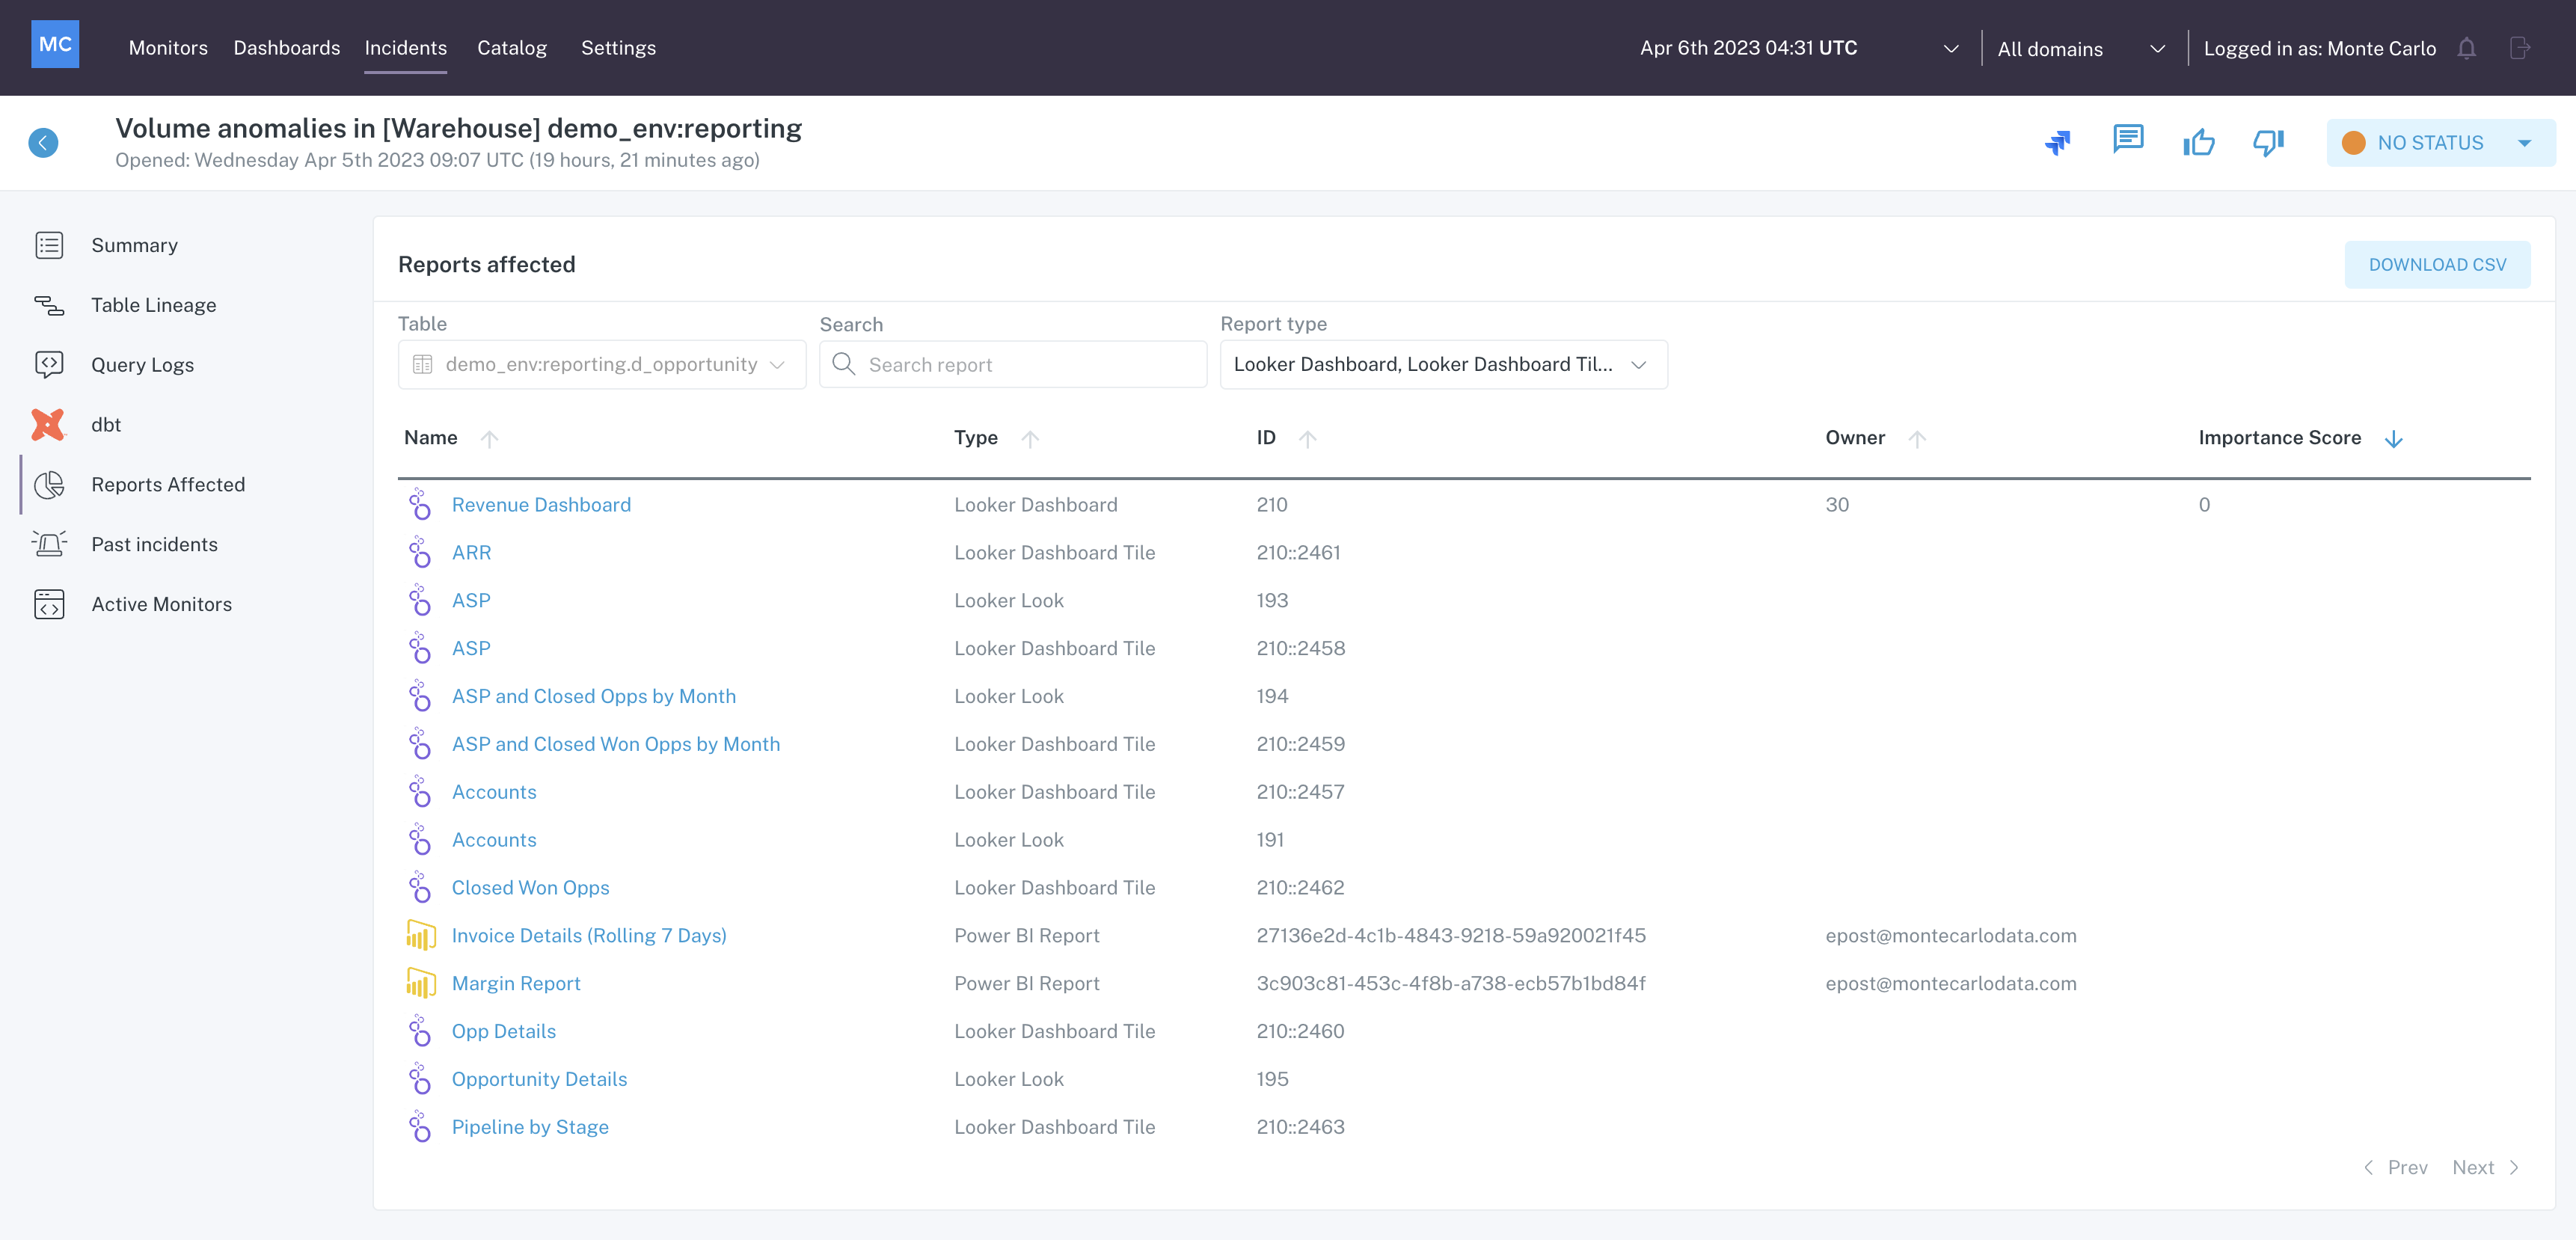
Reports Affected menu within Incident IQ
Use the filters to search for a specific report, or to limit the report types displayed.
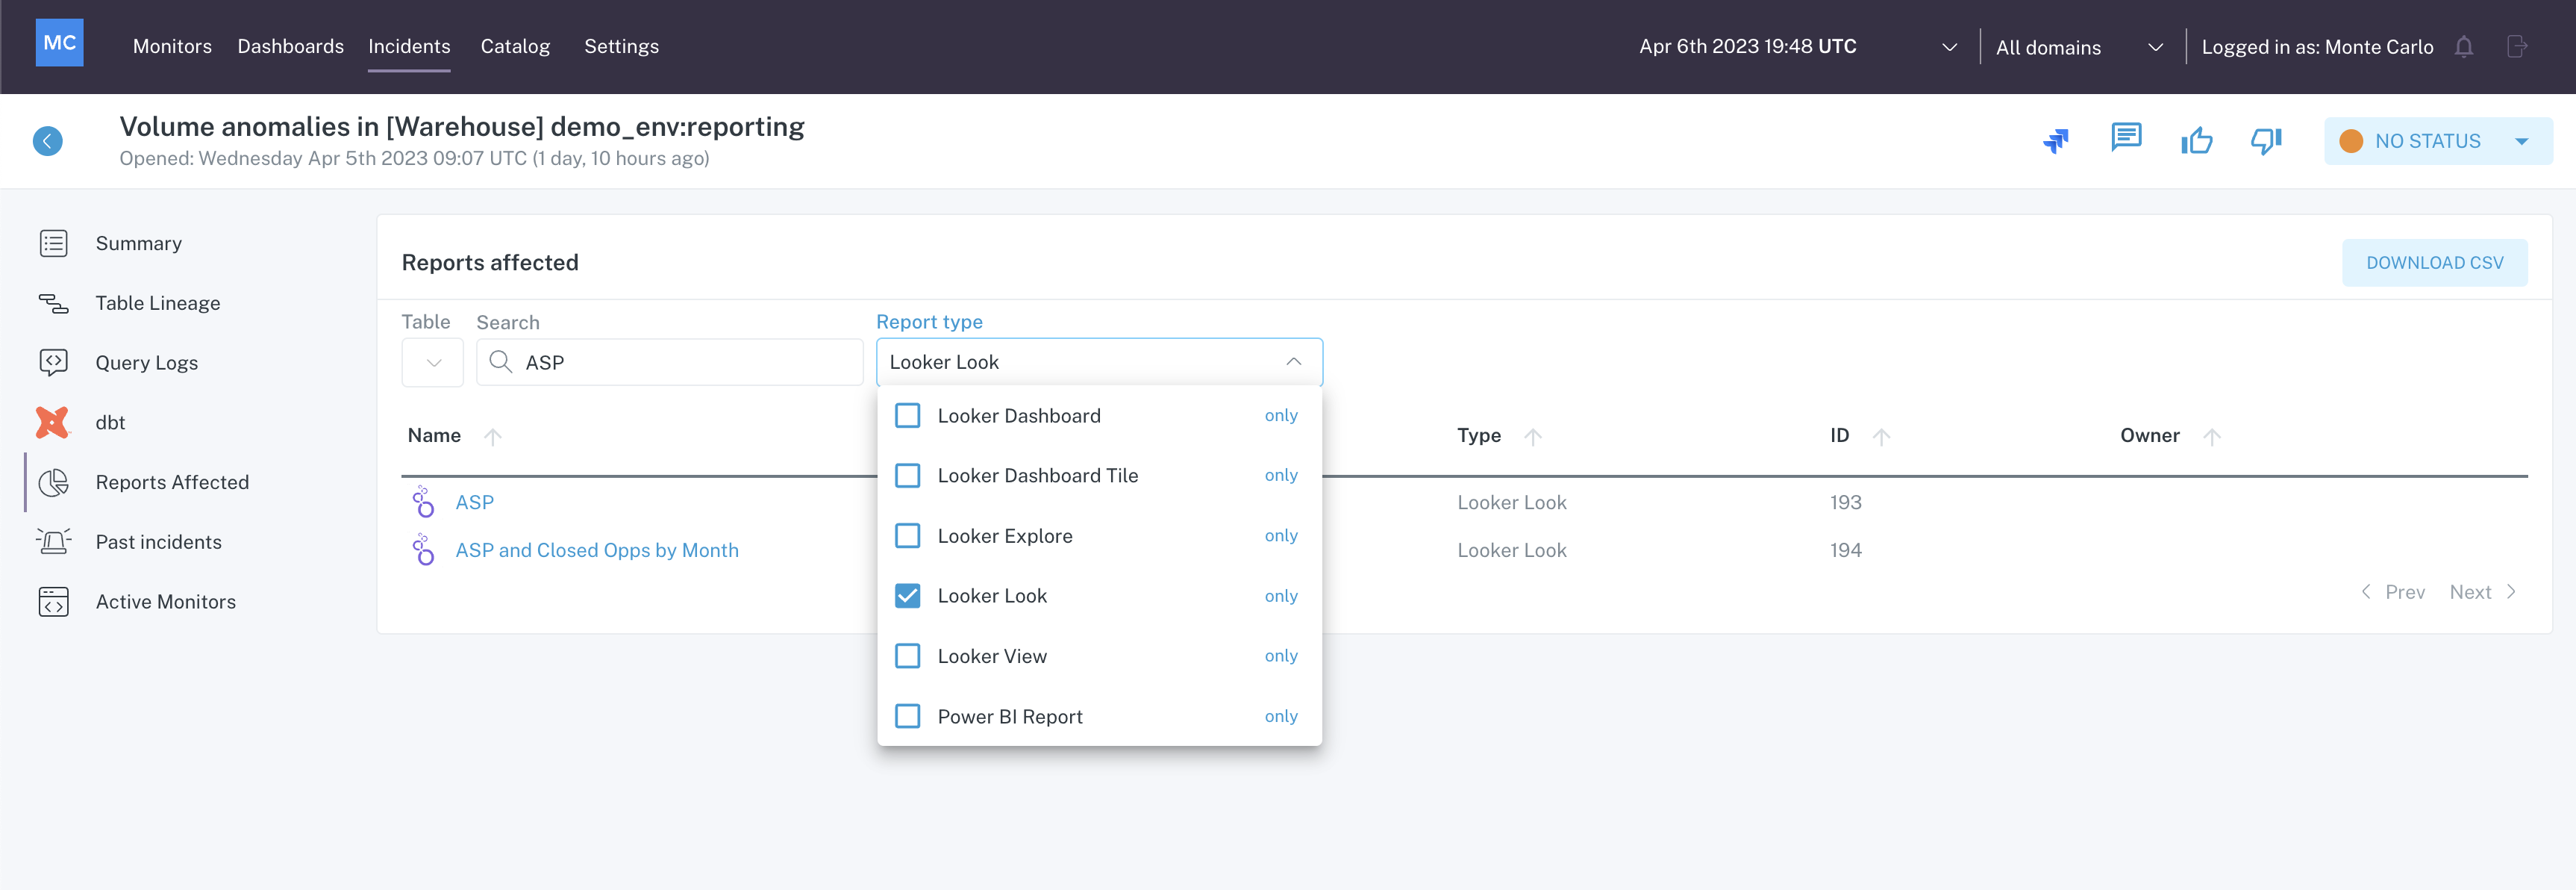
Reports Affected filter usage
Clicking on any of the report names in the list will take you to the Catalog page for that report.
Past Incidents
The Past Incidents menu of Incident IQ provides insight into any incidents on the table that previously occurred.
It may be helpful to review past incidents when researching an active incident on a table, to understand how they were solved and why they happened, or to identify patterns.
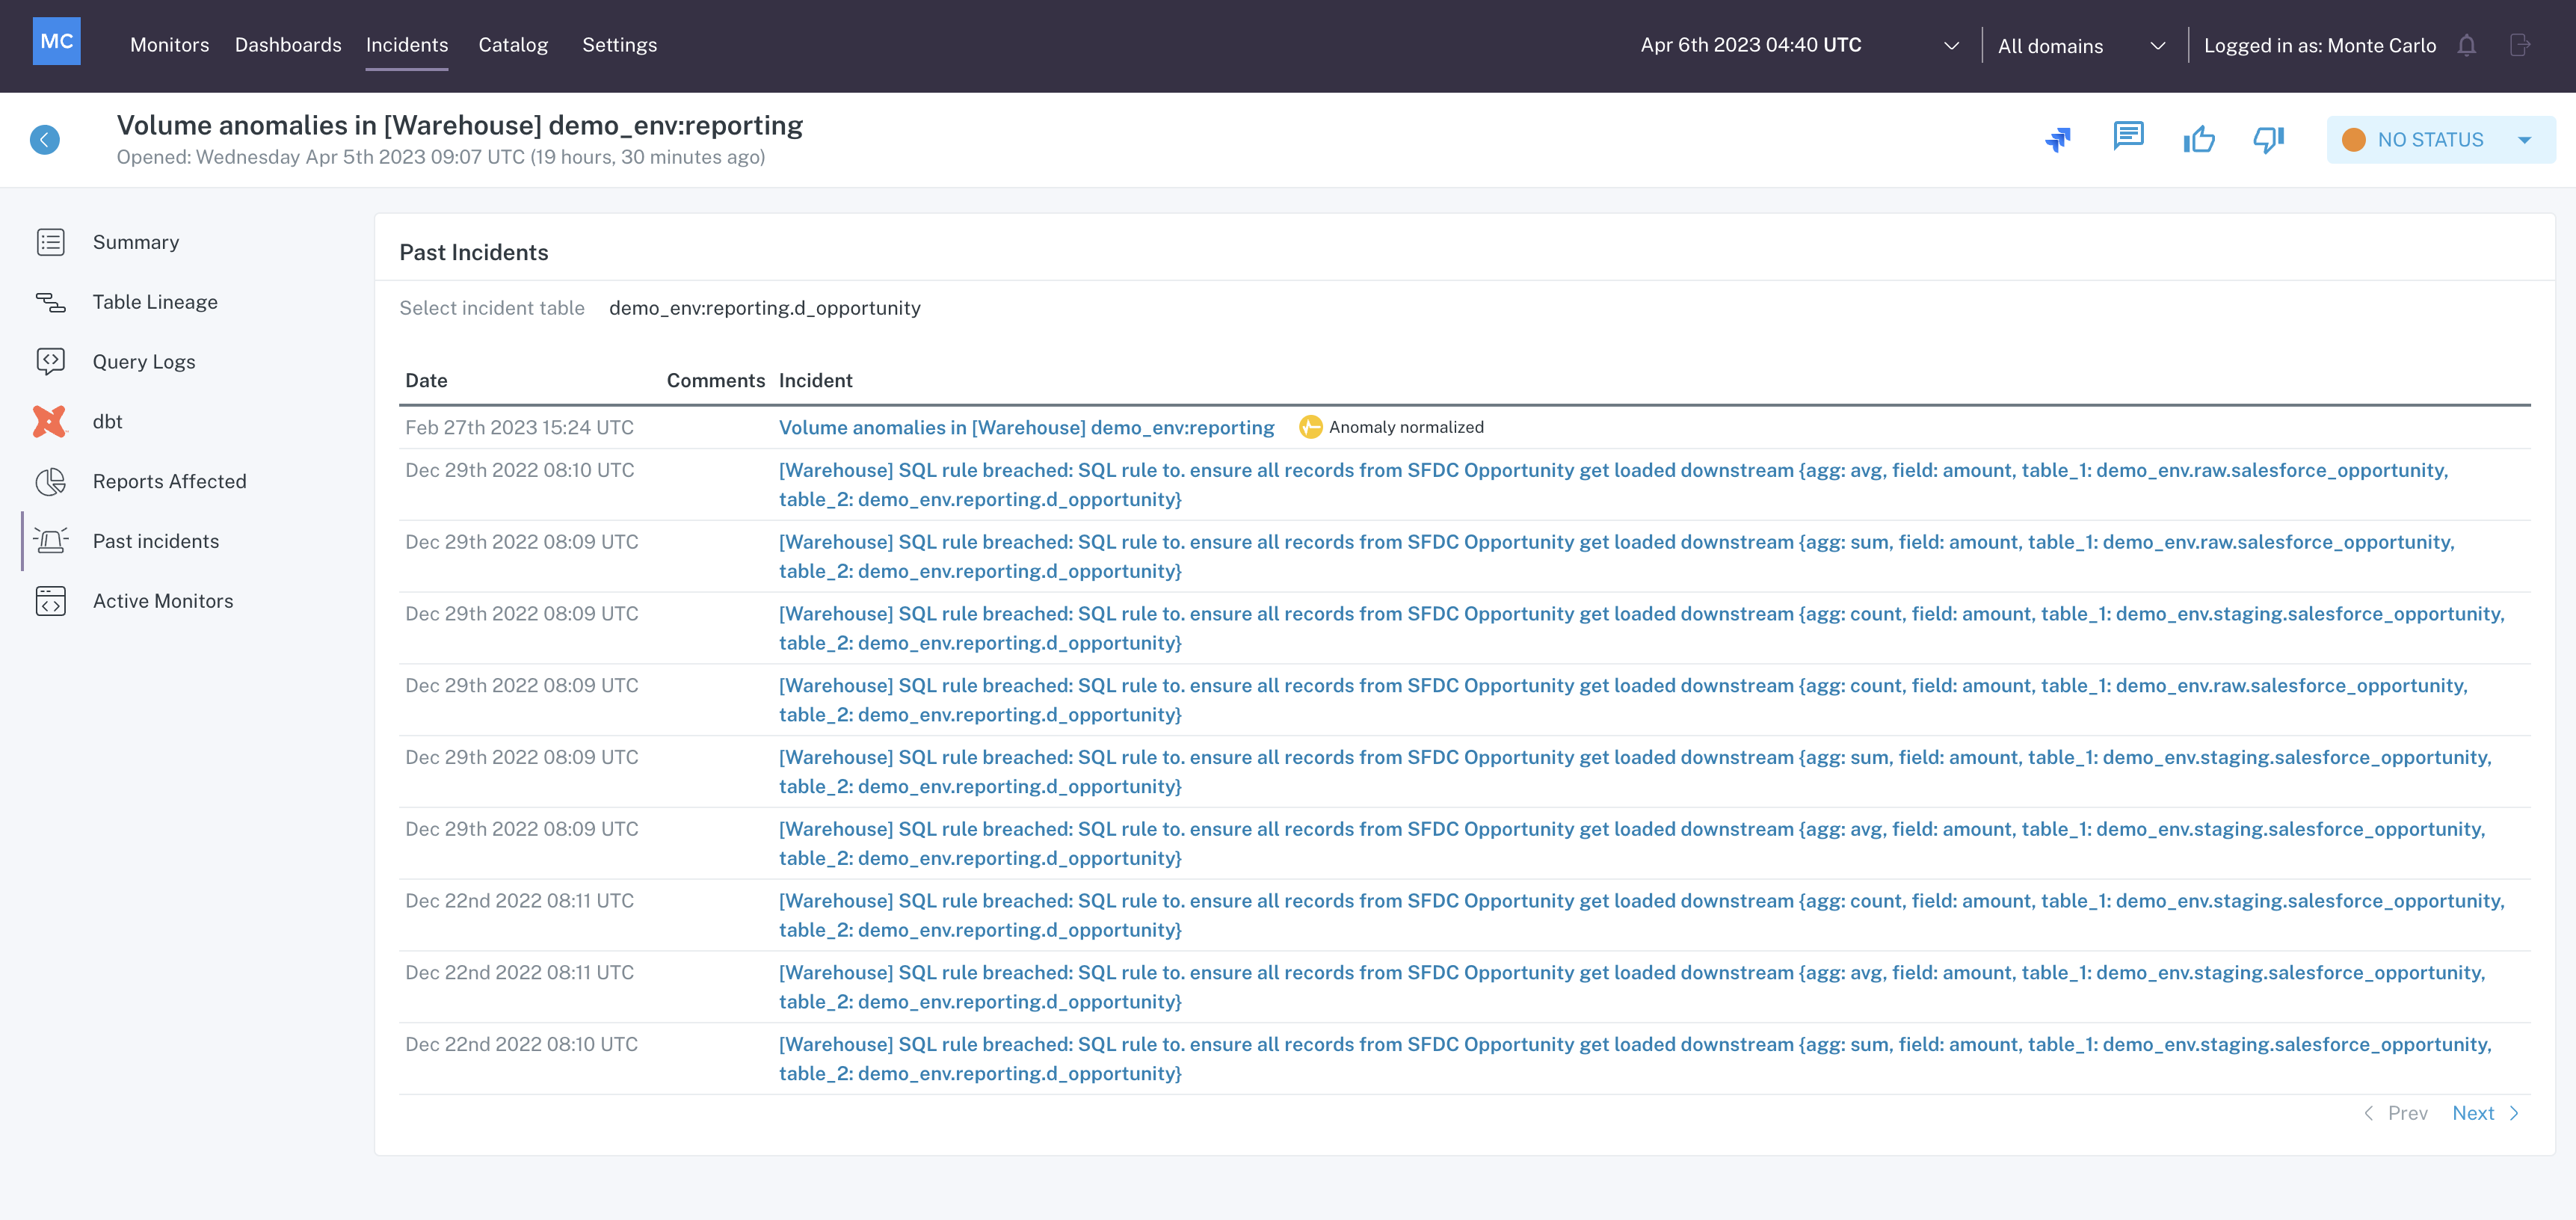
Past Incidents menu within Incident IQ
Clicking on any incident in the list will take you to the Incident IQ page for that incident.
Active Monitors
The Active Monitors menu of Incident IQ provides insight into the custom monitors on the table.
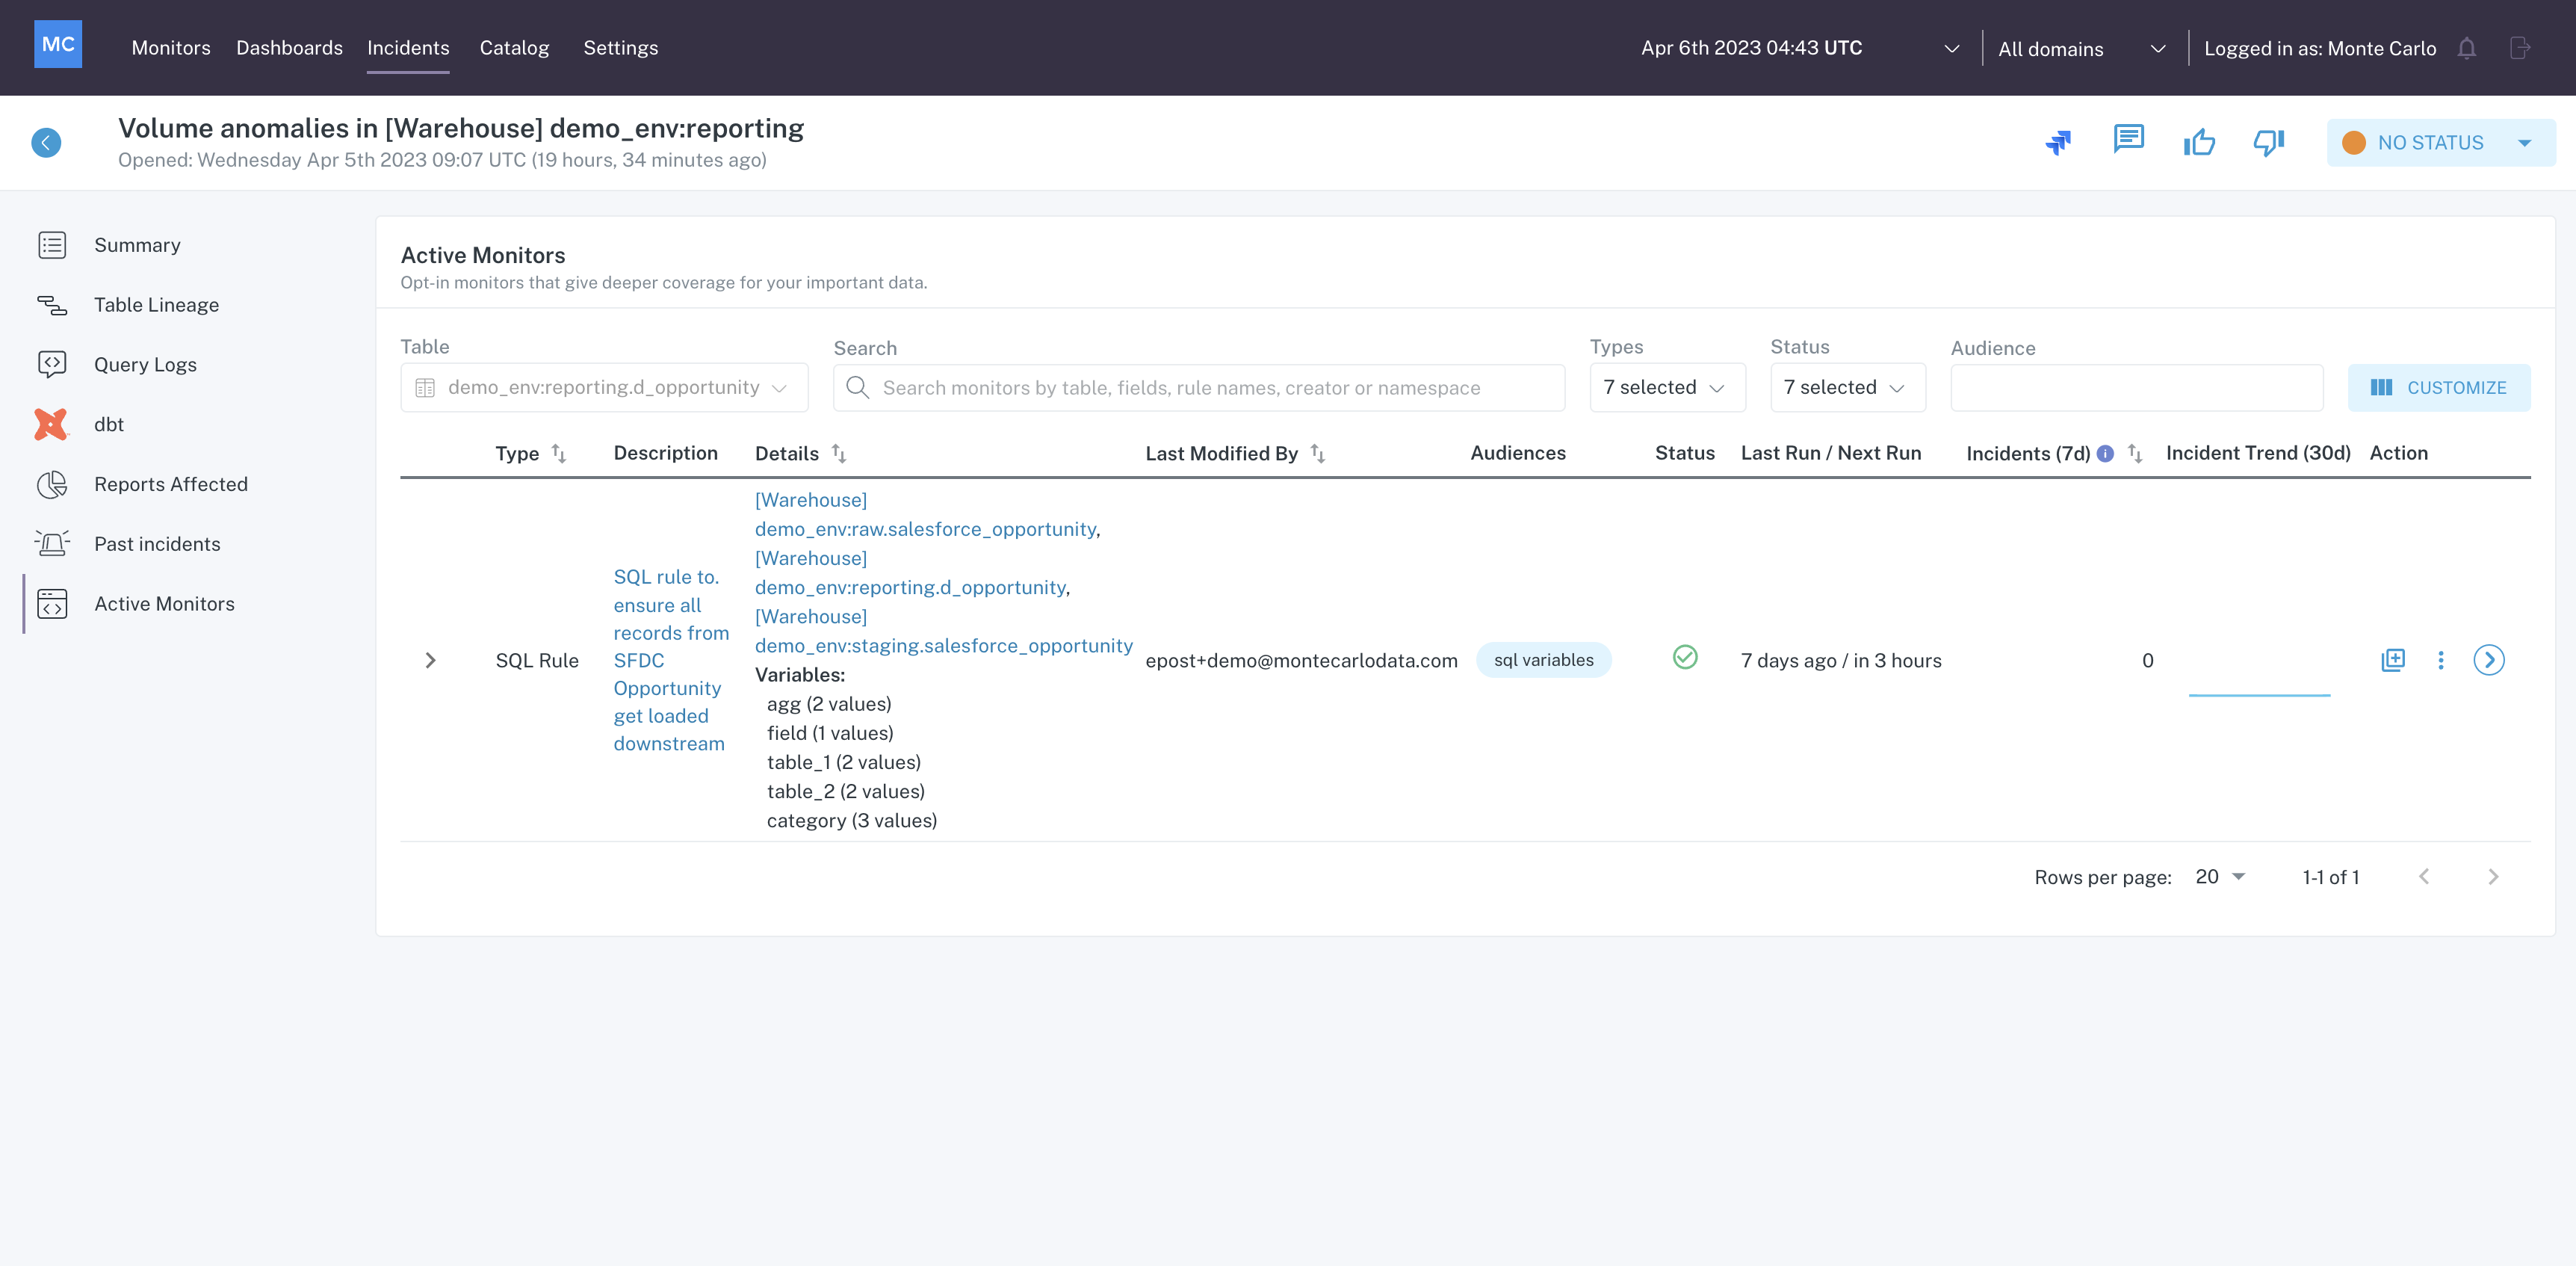
Active Monitors menu within Incident IQ
From here, you can review logic for any custom monitors on the table to understand if there are any gaps in coverage or if a monitor configuration should be adjusted.
Clicking on any of the monitor descriptions will take you to details page for that monitor..
Clicking on any of the resource names in the details column will take you to the Catalog page for that resource.
Incident Management
From Incident IQ, there are several features available to aid in incident management.
Note that each of these features is also accessible from the incident feed.
Owner & Severity
Assign an owner to make clear who is responsible for investigating the incident, and a severity to classify the incident.
Owner & Severity Incident Management options
Status
Update the status of an incident to track progress of the investigation. Updating status is also helpful for analytics and reporting and can aid in defining/meeting SLA's.
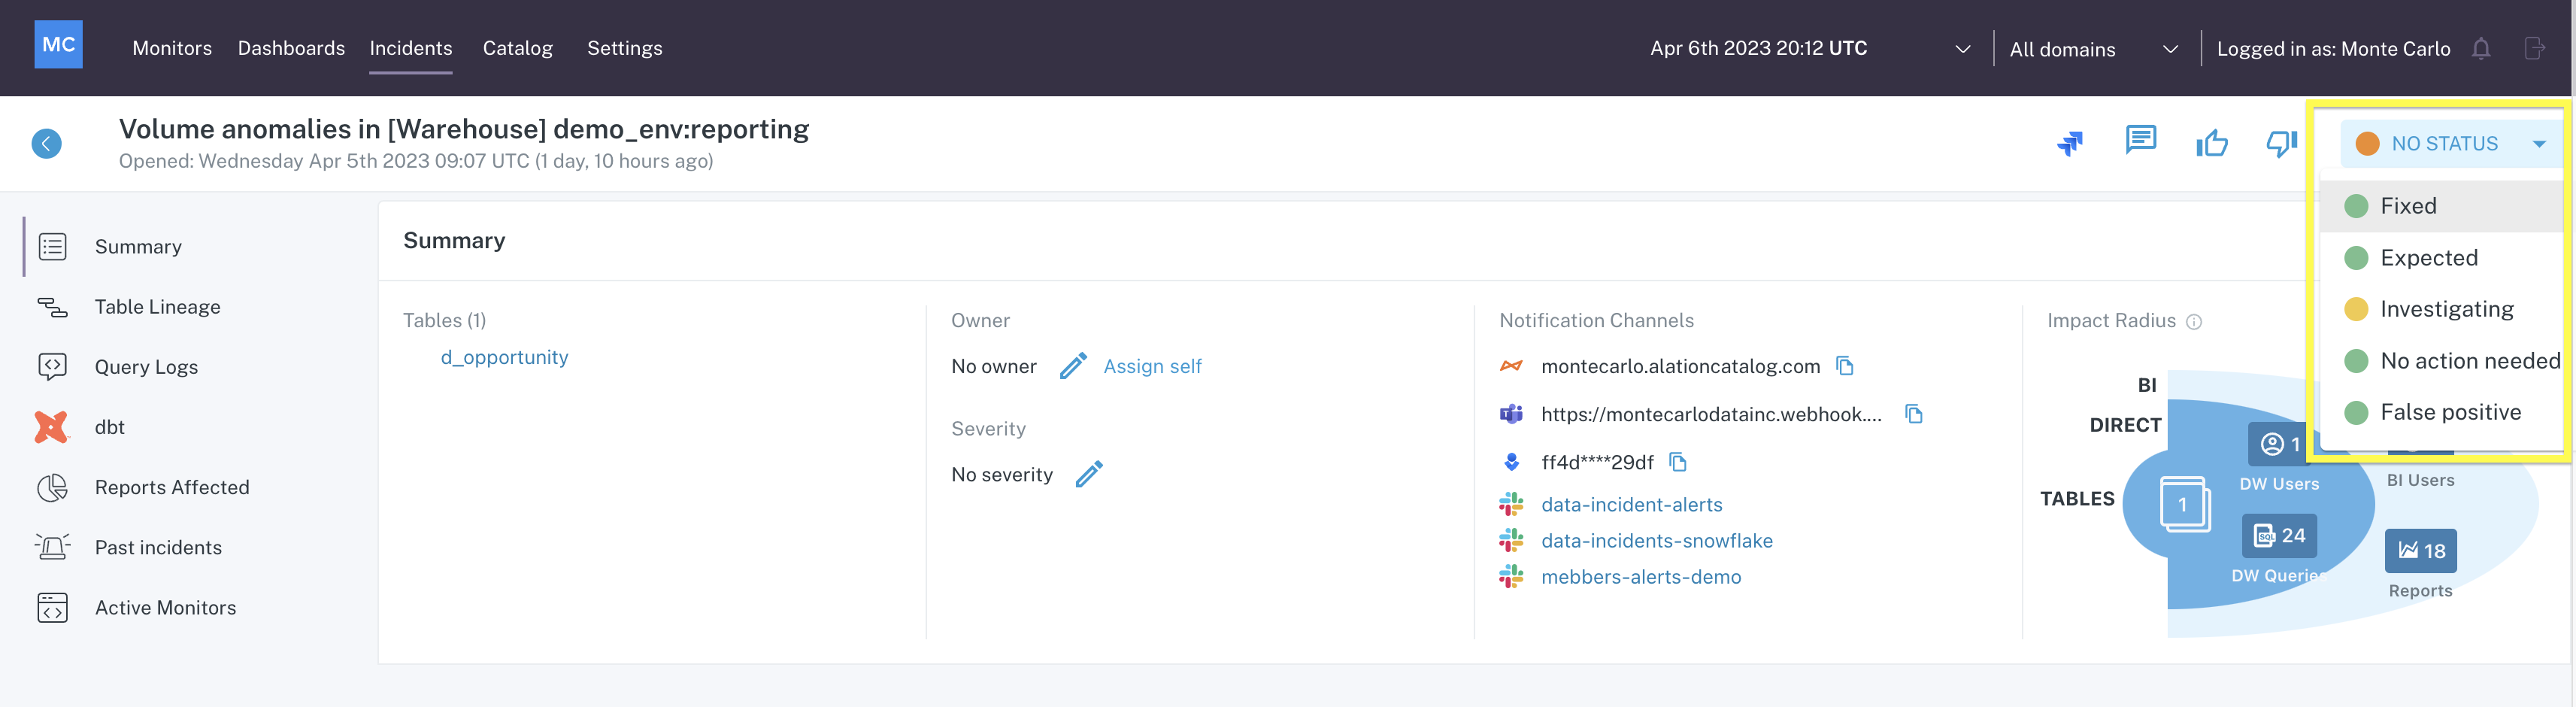
Incident Status
Comments
Add comments to the incident to track notes and findings.
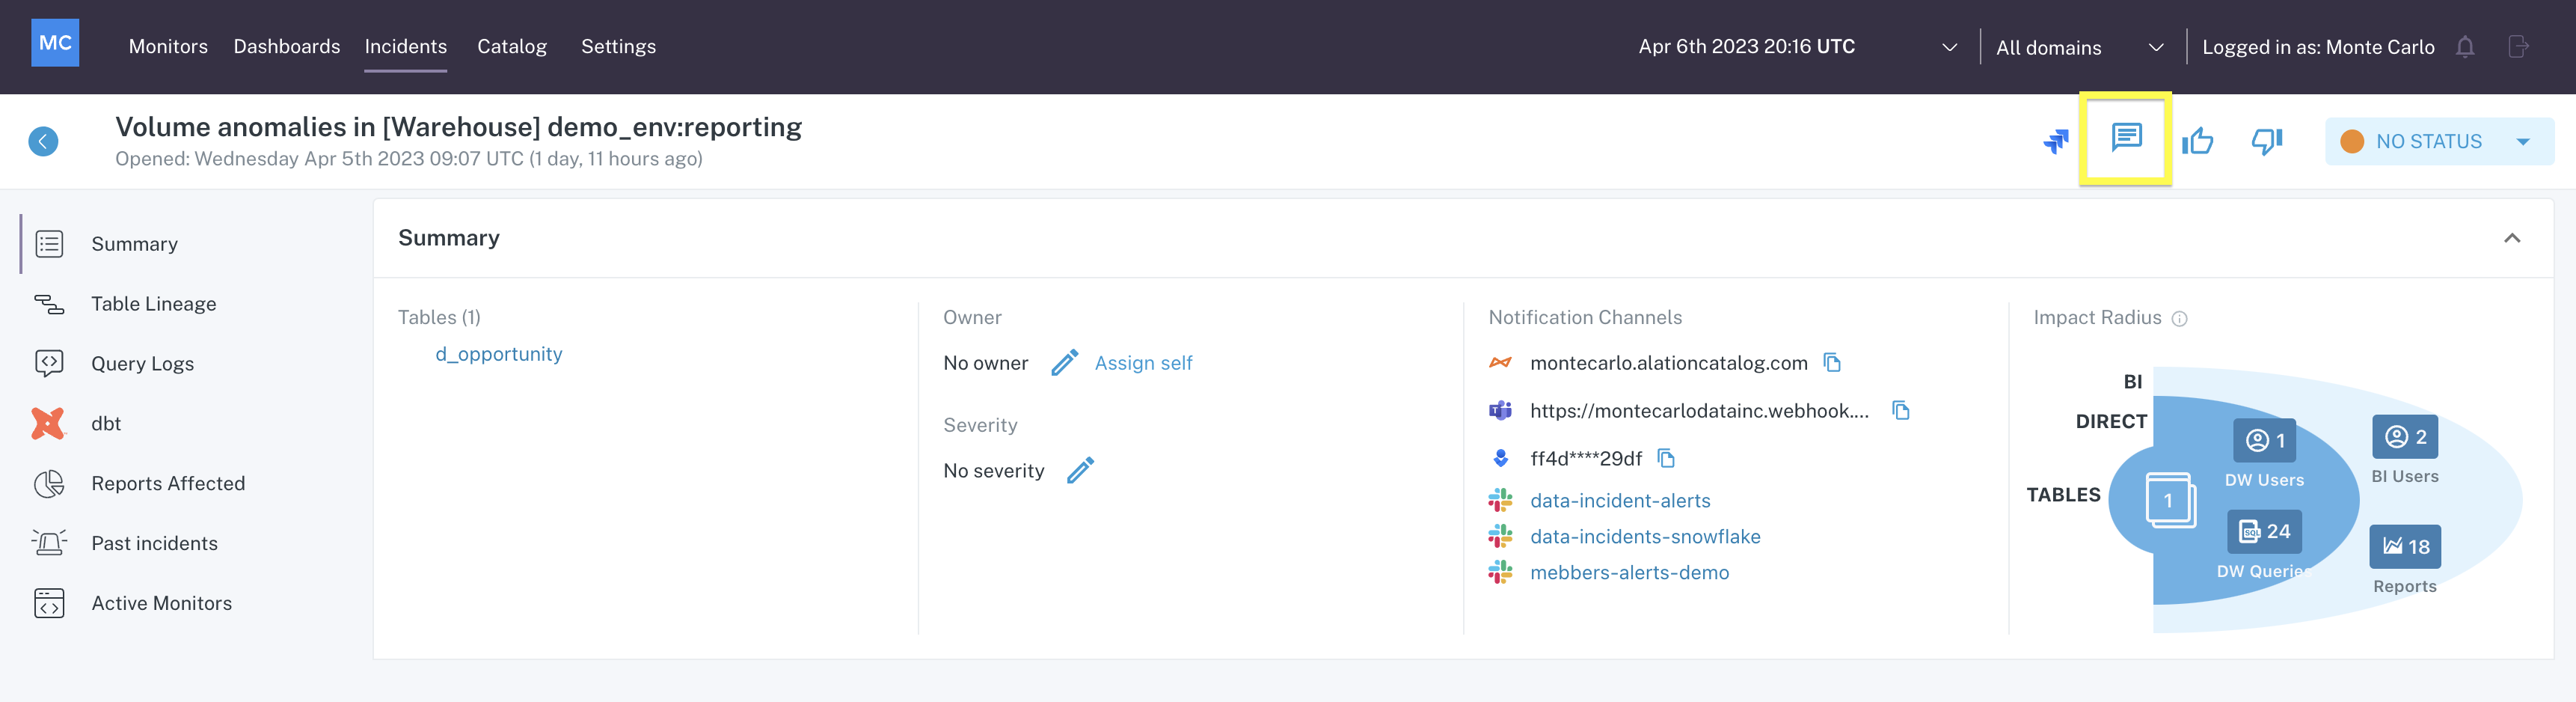
Comment icon
Clicking on the comment icon opens a drawer where you can view existing comments or add a new one. Keeping good notes on an incident can be helpful for future investigations and reporting.
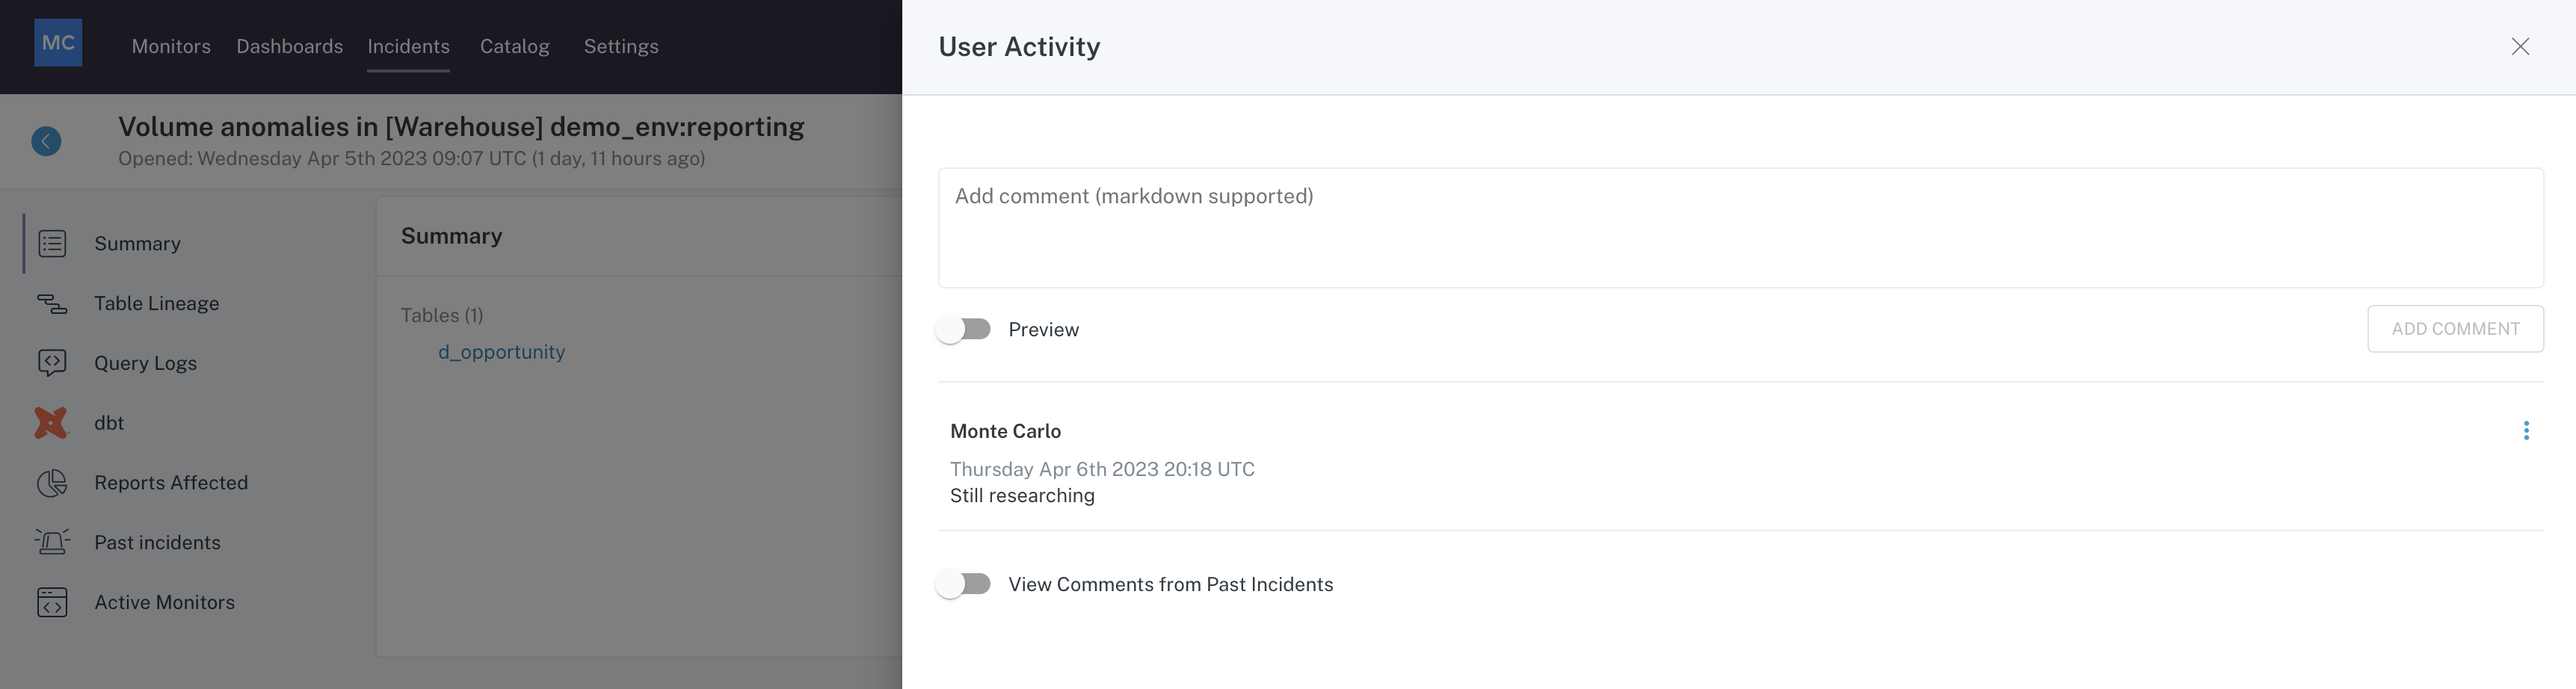
Comment drawer
Incident feedback
Provide feedback about the incident to help Monte Carlo better serve you.
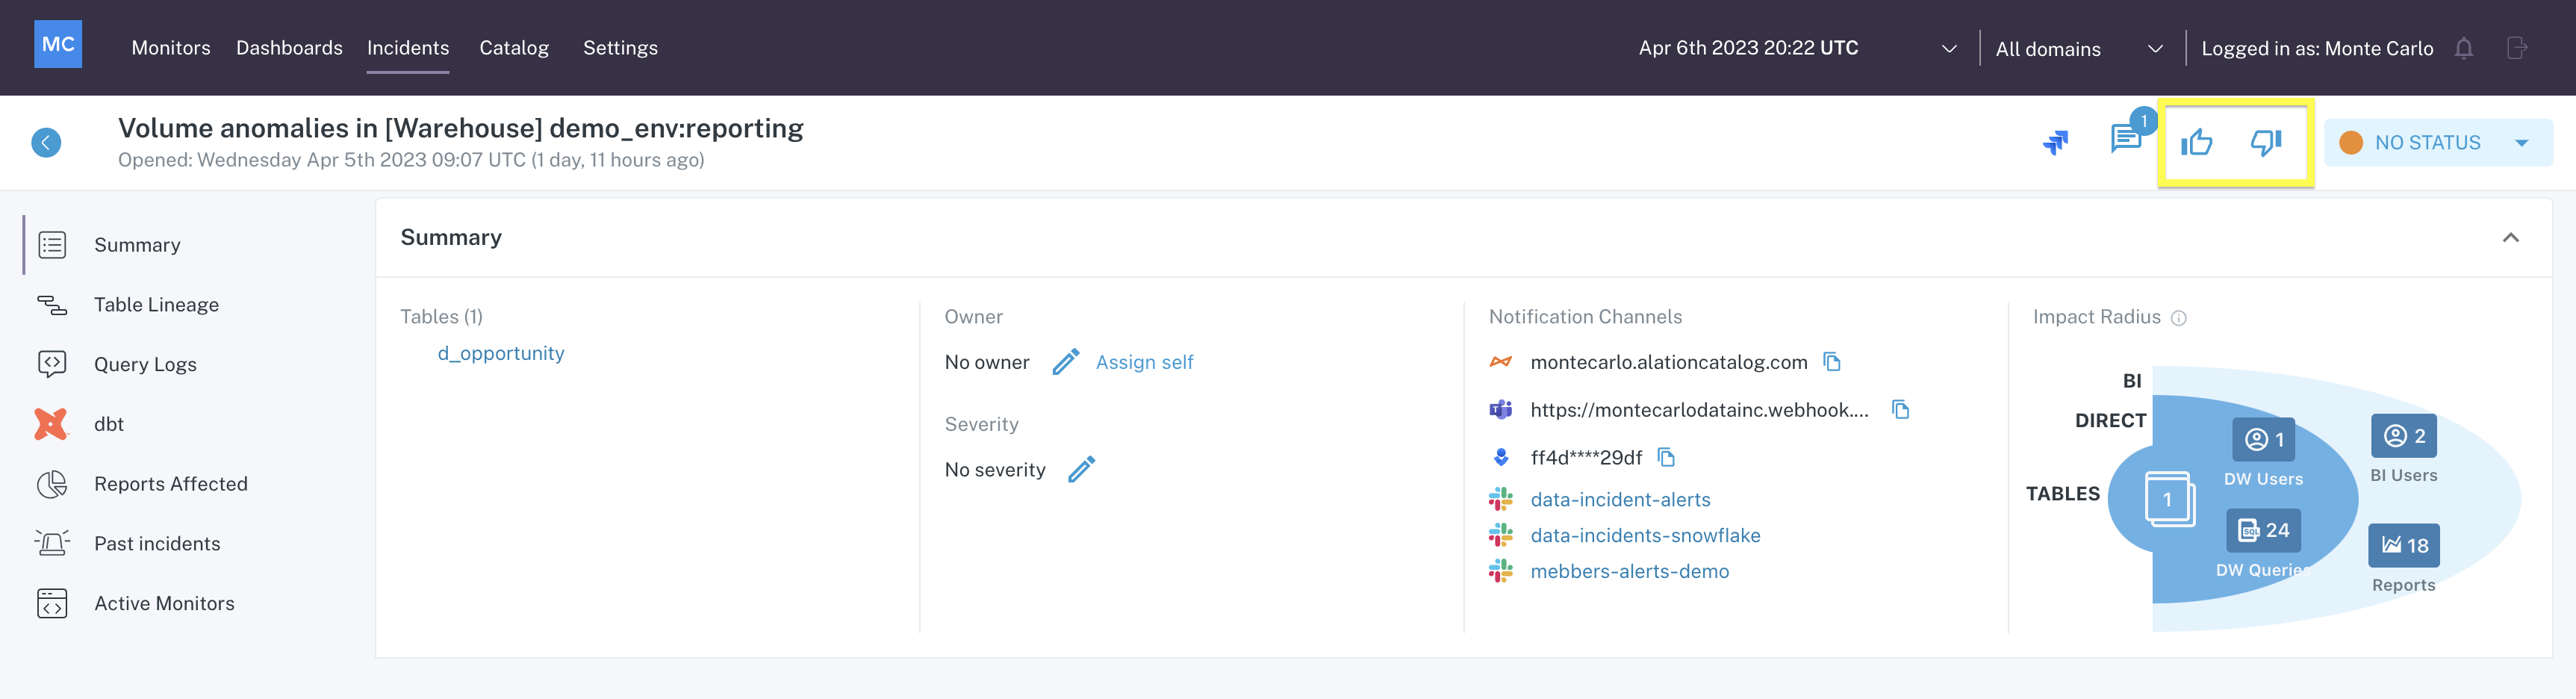
Incident feedback icons
Clicking on either of the feedback options helps in two different ways -
- Feedback is funneled directly to the Monte Carlo Product & Engineering teams who use it to improve the product.
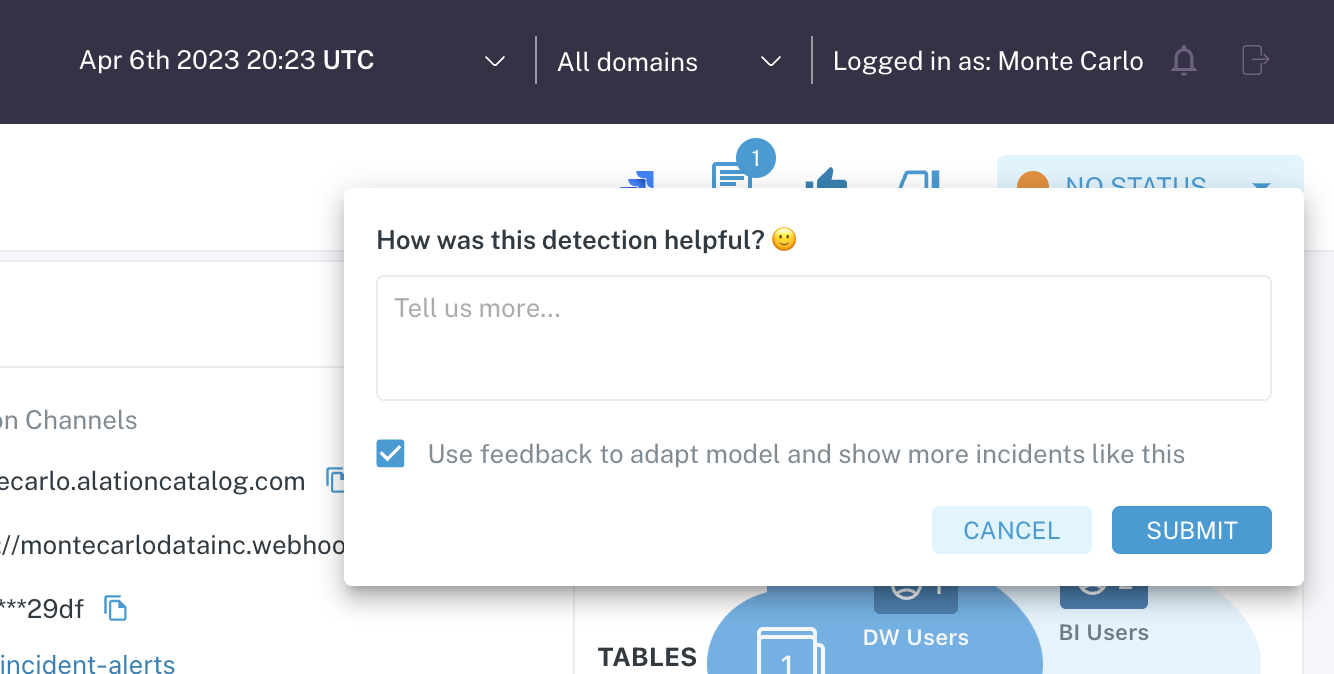
- If you choose to do so, the machine learning models working in your environment will be tuned accordingly. For example, clicking the positive feedback icon presents the following menu:
There are other ways you can tune the ML models in your environment. For more information, please refer to the following sections:
Frequently Asked Questions
We see flags on some of our incidents that reference correlation or query insights, what is this?
Correlation and query insights represent automated findings that Monte Carlo produced to facilitate the discovery of the root cause of a particular data incident. Click here to learn more about this great feature.
The dbt menu item was not mentioned here, what is that?
If you have a dbt integration set up, you can access information about the dbt model related to the affected table within the dbt menu. Click here to learn more about our dbt integration.
Updated about 1 month ago