Using Assets
Whether you are troubleshooting an alert or simply looking to get more familiar with a table or data asset, Assets contains tools to address a variety of use cases.
Please note: Assets is a Monte Carlo feature that was formerly named Catalog
Basic Navigation
The Assets landing page provides a comprehensive search and browsing experience. Use the search bar at the top to find assets by name, then browse results using category tabs: Tables, Agents, Reports, Fields, Jobs, and Other.
Each tab shows a count of matching assets.
Toggle between Browse (to navigate your data source hierarchy) and Filters (to apply advanced filter criteria). The right panel defaults to Popular assets, but you can also switch to Favorites, Recently viewed, or All.
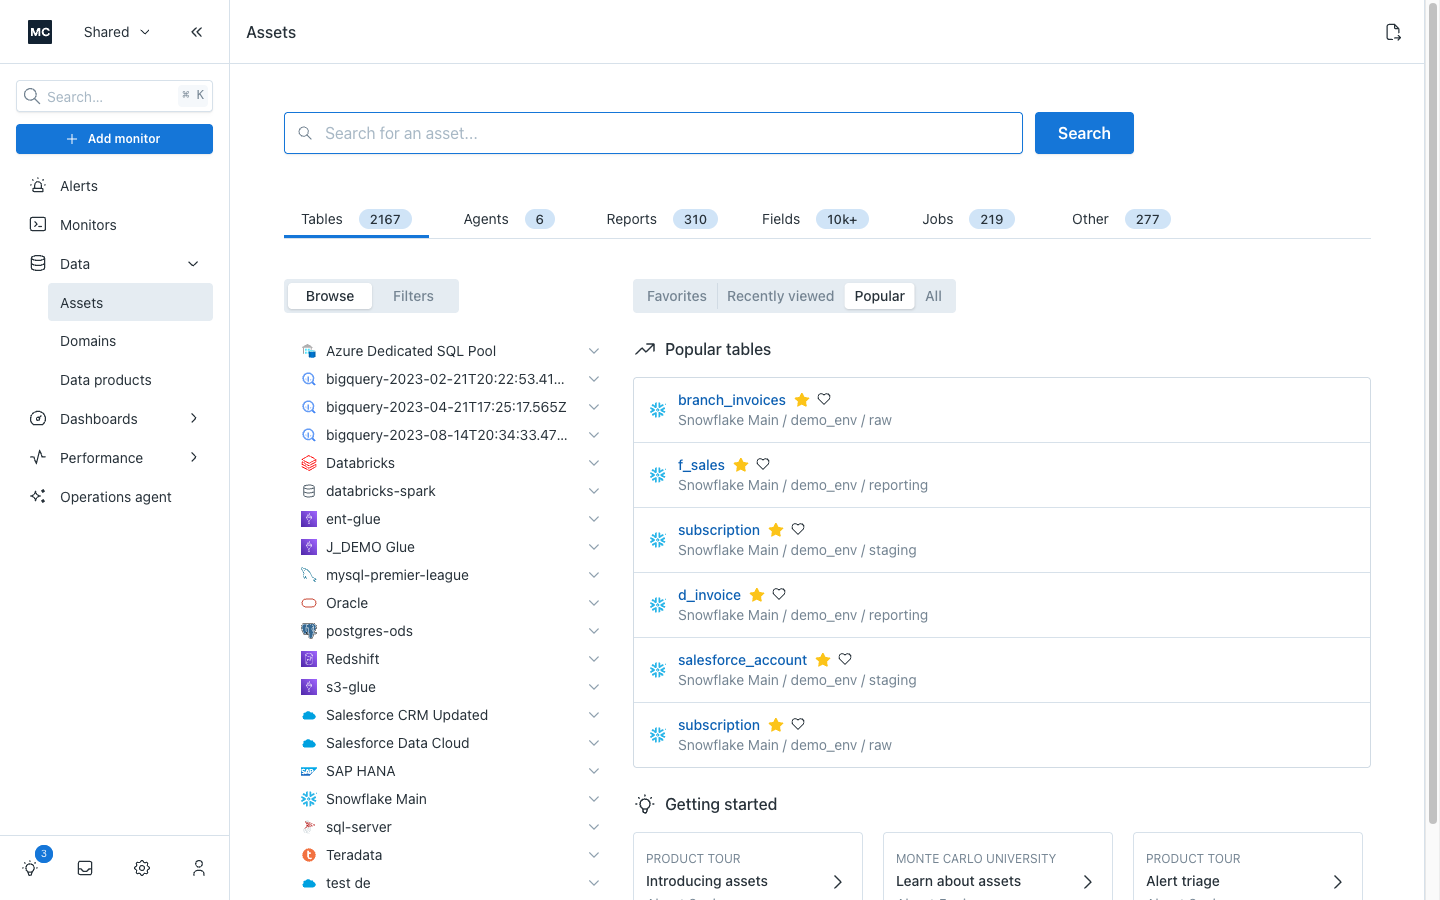
Assets landing page
Discovery
You may use Assets to do discovery and get quick insights into some of the most important data points for a data asset.
Summary
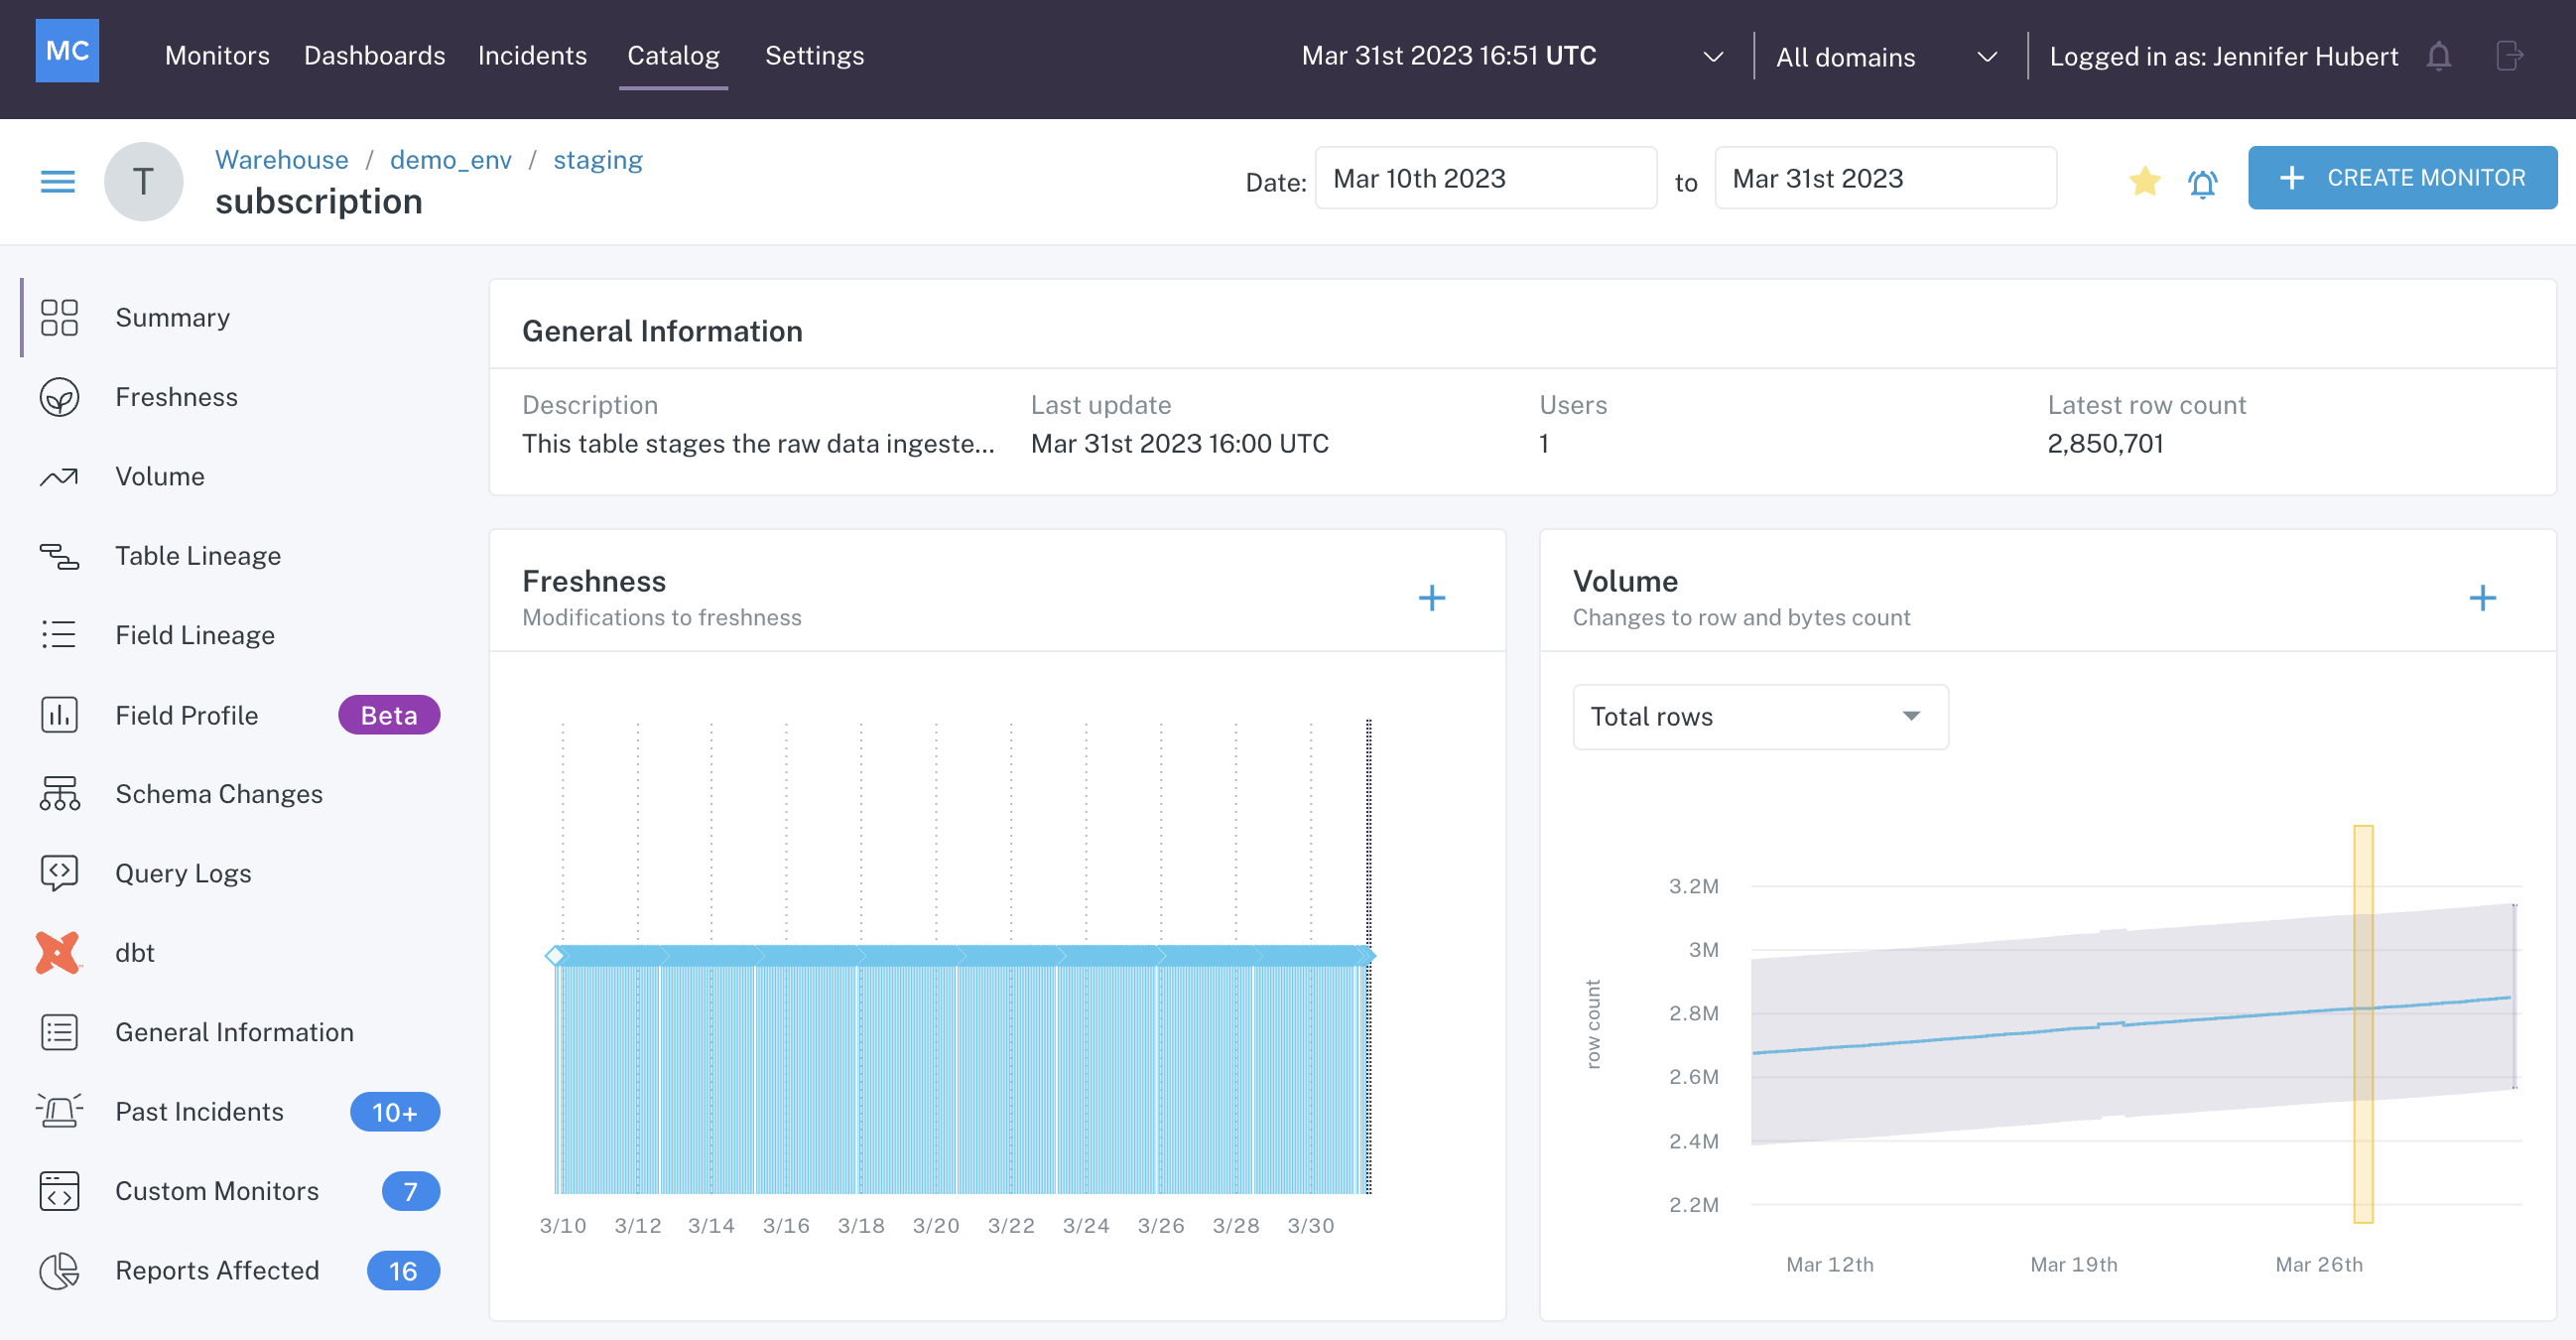
When you land on a detail page for a data asset, you are immediately provided with a wealth of information about the asset - its current state, where the data within is coming from and where it goes, who has recently queried it and what they queried, etc.
Assets landing page
The following insights can be found in the Summary tab. Click to learn more about each.
General Information
General Information about a data asset can also be found under the General Information tab.
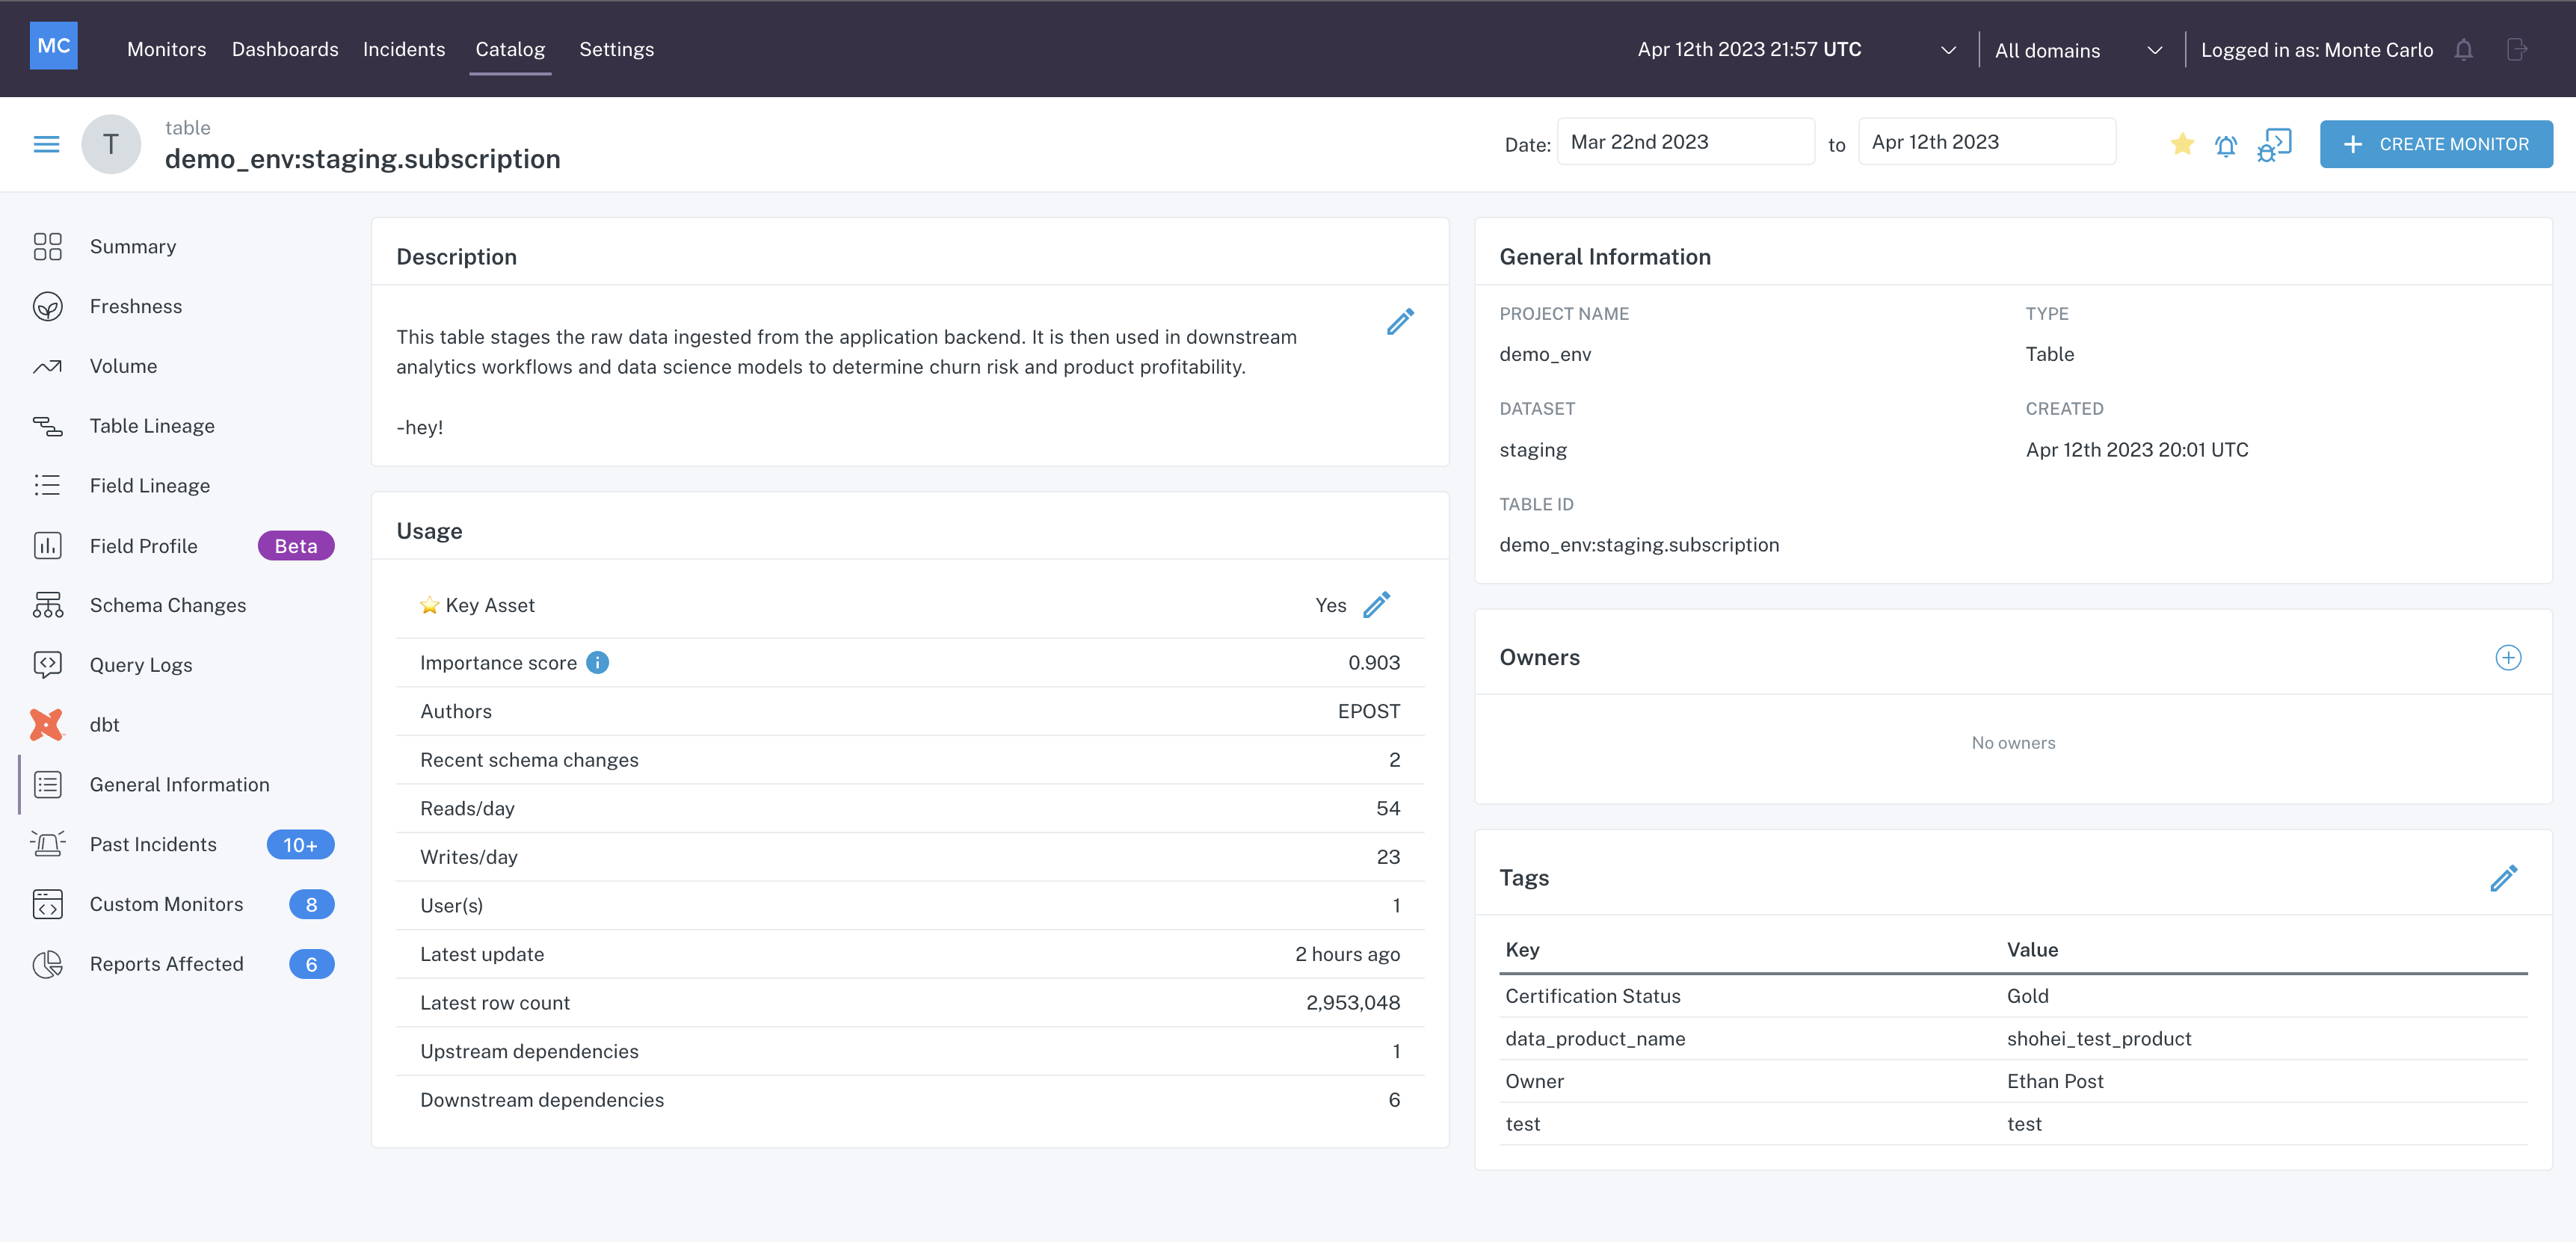
Assets page General Information tab
- Description - A description of the data asset.
- Usage - Quick view of usage data on the data asset, including whether the asset has been identified by Monte Carlo as a Key Asset and the Importance Score driving this decision.
- General Information - General information about the data asset.
- Tags - Tags placed on the data asset. More on tags here.
Monitors
You may use Assets to understand how a data asset is being monitored.
Freshness
Inspect the freshness pattern of a data asset by navigating to the respective tab on a data asset's detail page.
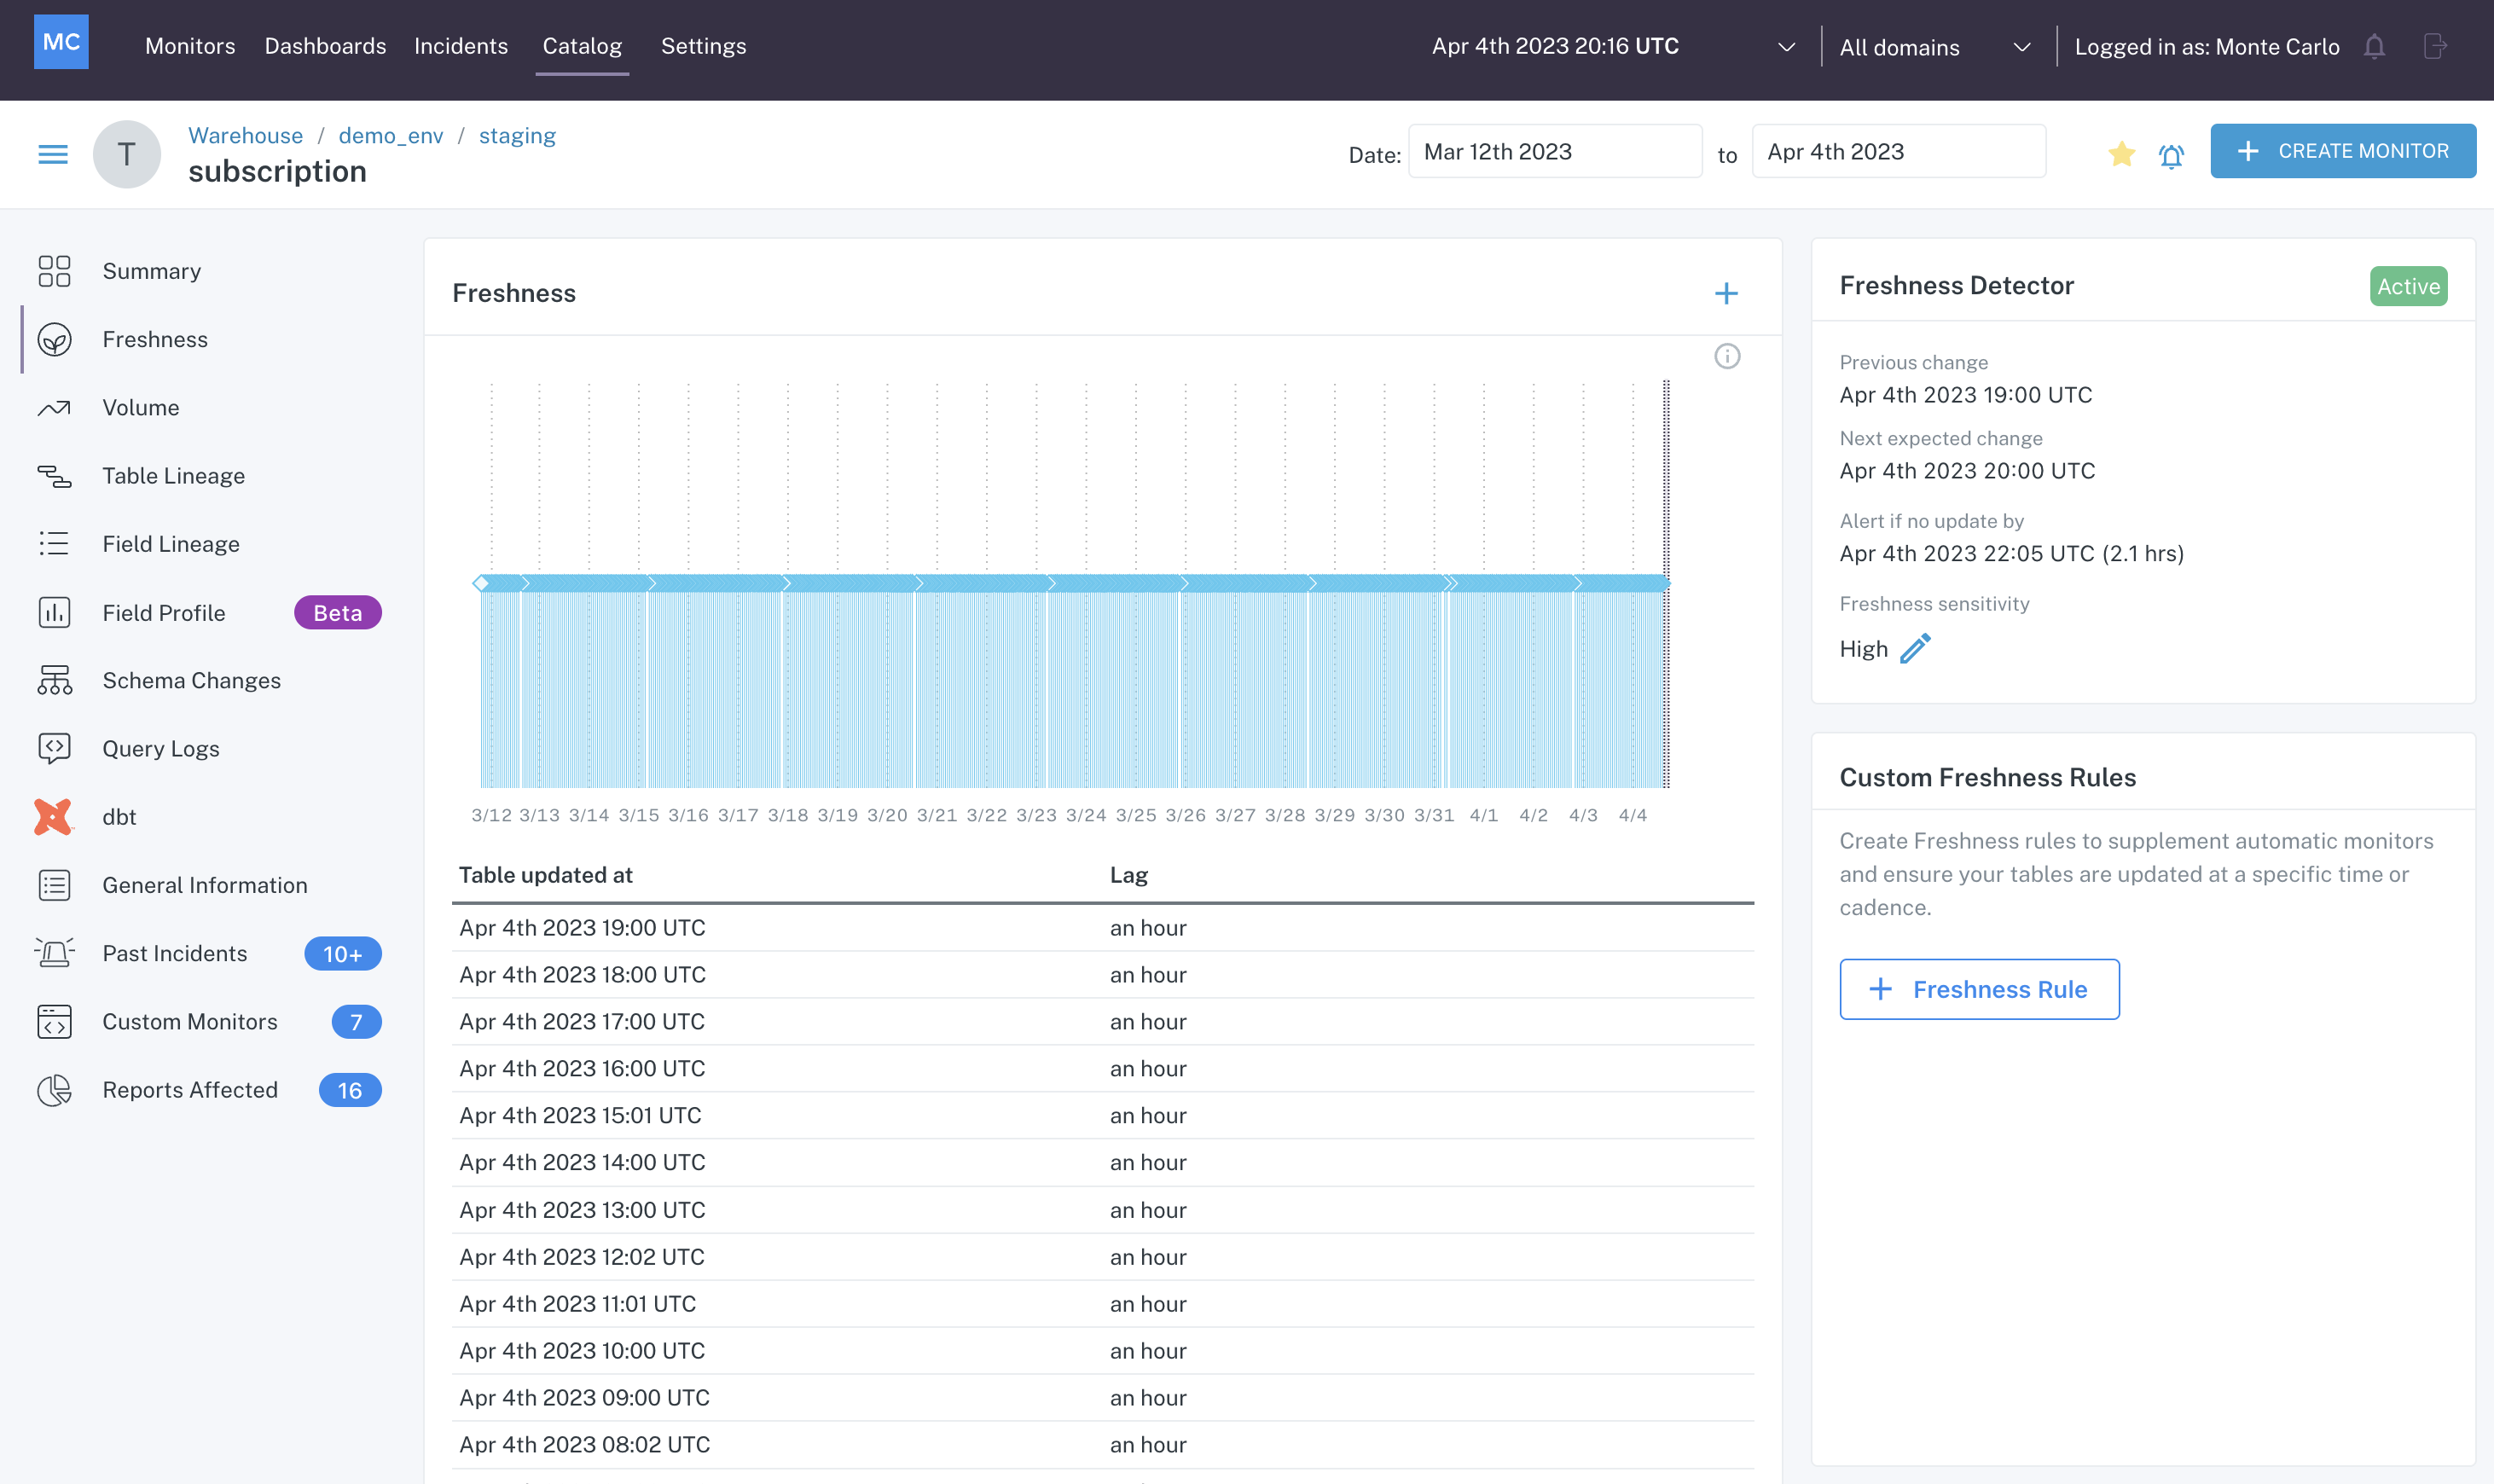
Freshness tab of an Assets detail page
In the graph and table above, you can see that the table subscription updates consistently every hour. To the right of the graph, you can see that the Freshness Detector is active. You can also see the previous change, the next expected change, and the time threshold that, if surpassed, will create an alert in Monte Carlo.
You can also see that this detector has a sensitivity control on it set to High. Learn more about fine tuning automated freshness alerts here.
Volume
Inspect the volume pattern of a data asset by navigating to the respective tab on a data asset's detail page.
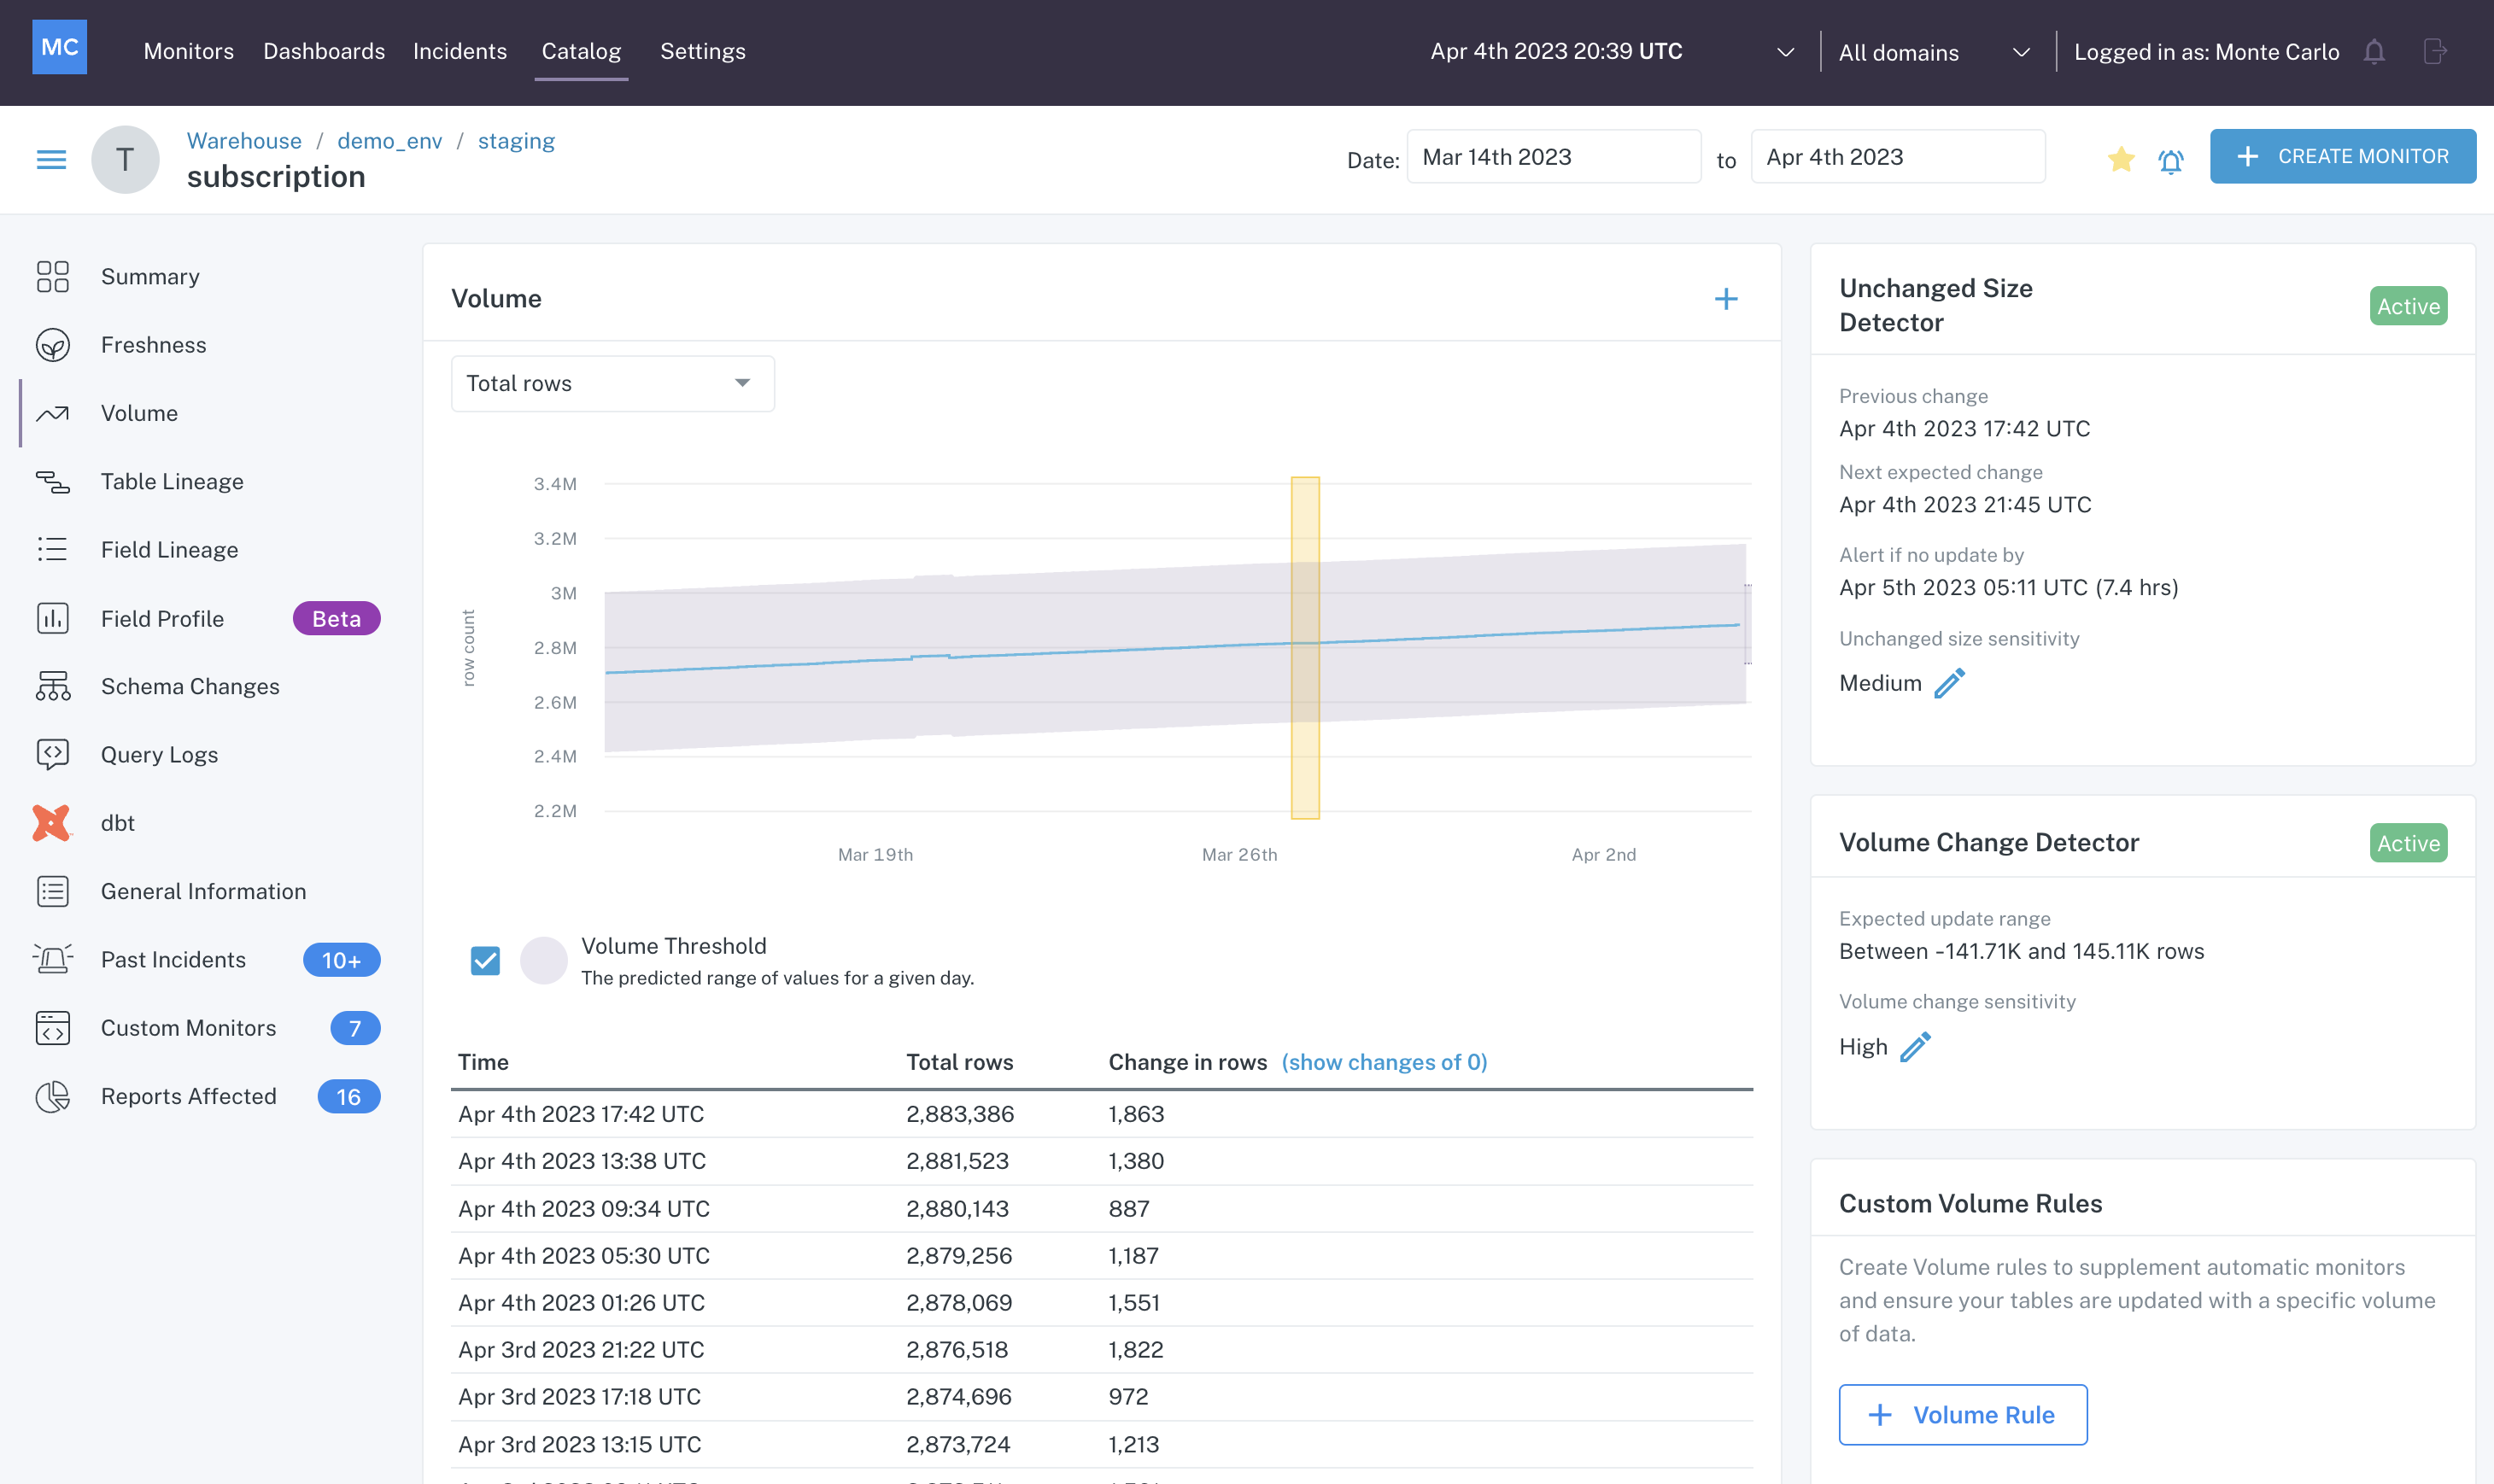
Volume tab of an Assets detail page
In the graph and table above, you can see that the table subscription receives a few updates a day, consistently adding rows. To the right of the graph, you can see there are two detectors for our automated volume monitoring — unchanged size and volume change.
The unchanged size detector builds a threshold to alert by a certain time if there is no change in rows seen, and the volume change detector builds a threshold to alert if the row change that does come falls outside of the expected upper and lower bounds.
You can find out more about these detectors here: volume change detector, unchanged size detector.
Schema Changes
The Schema Changes tab will show you any changes to columns that have occurred.
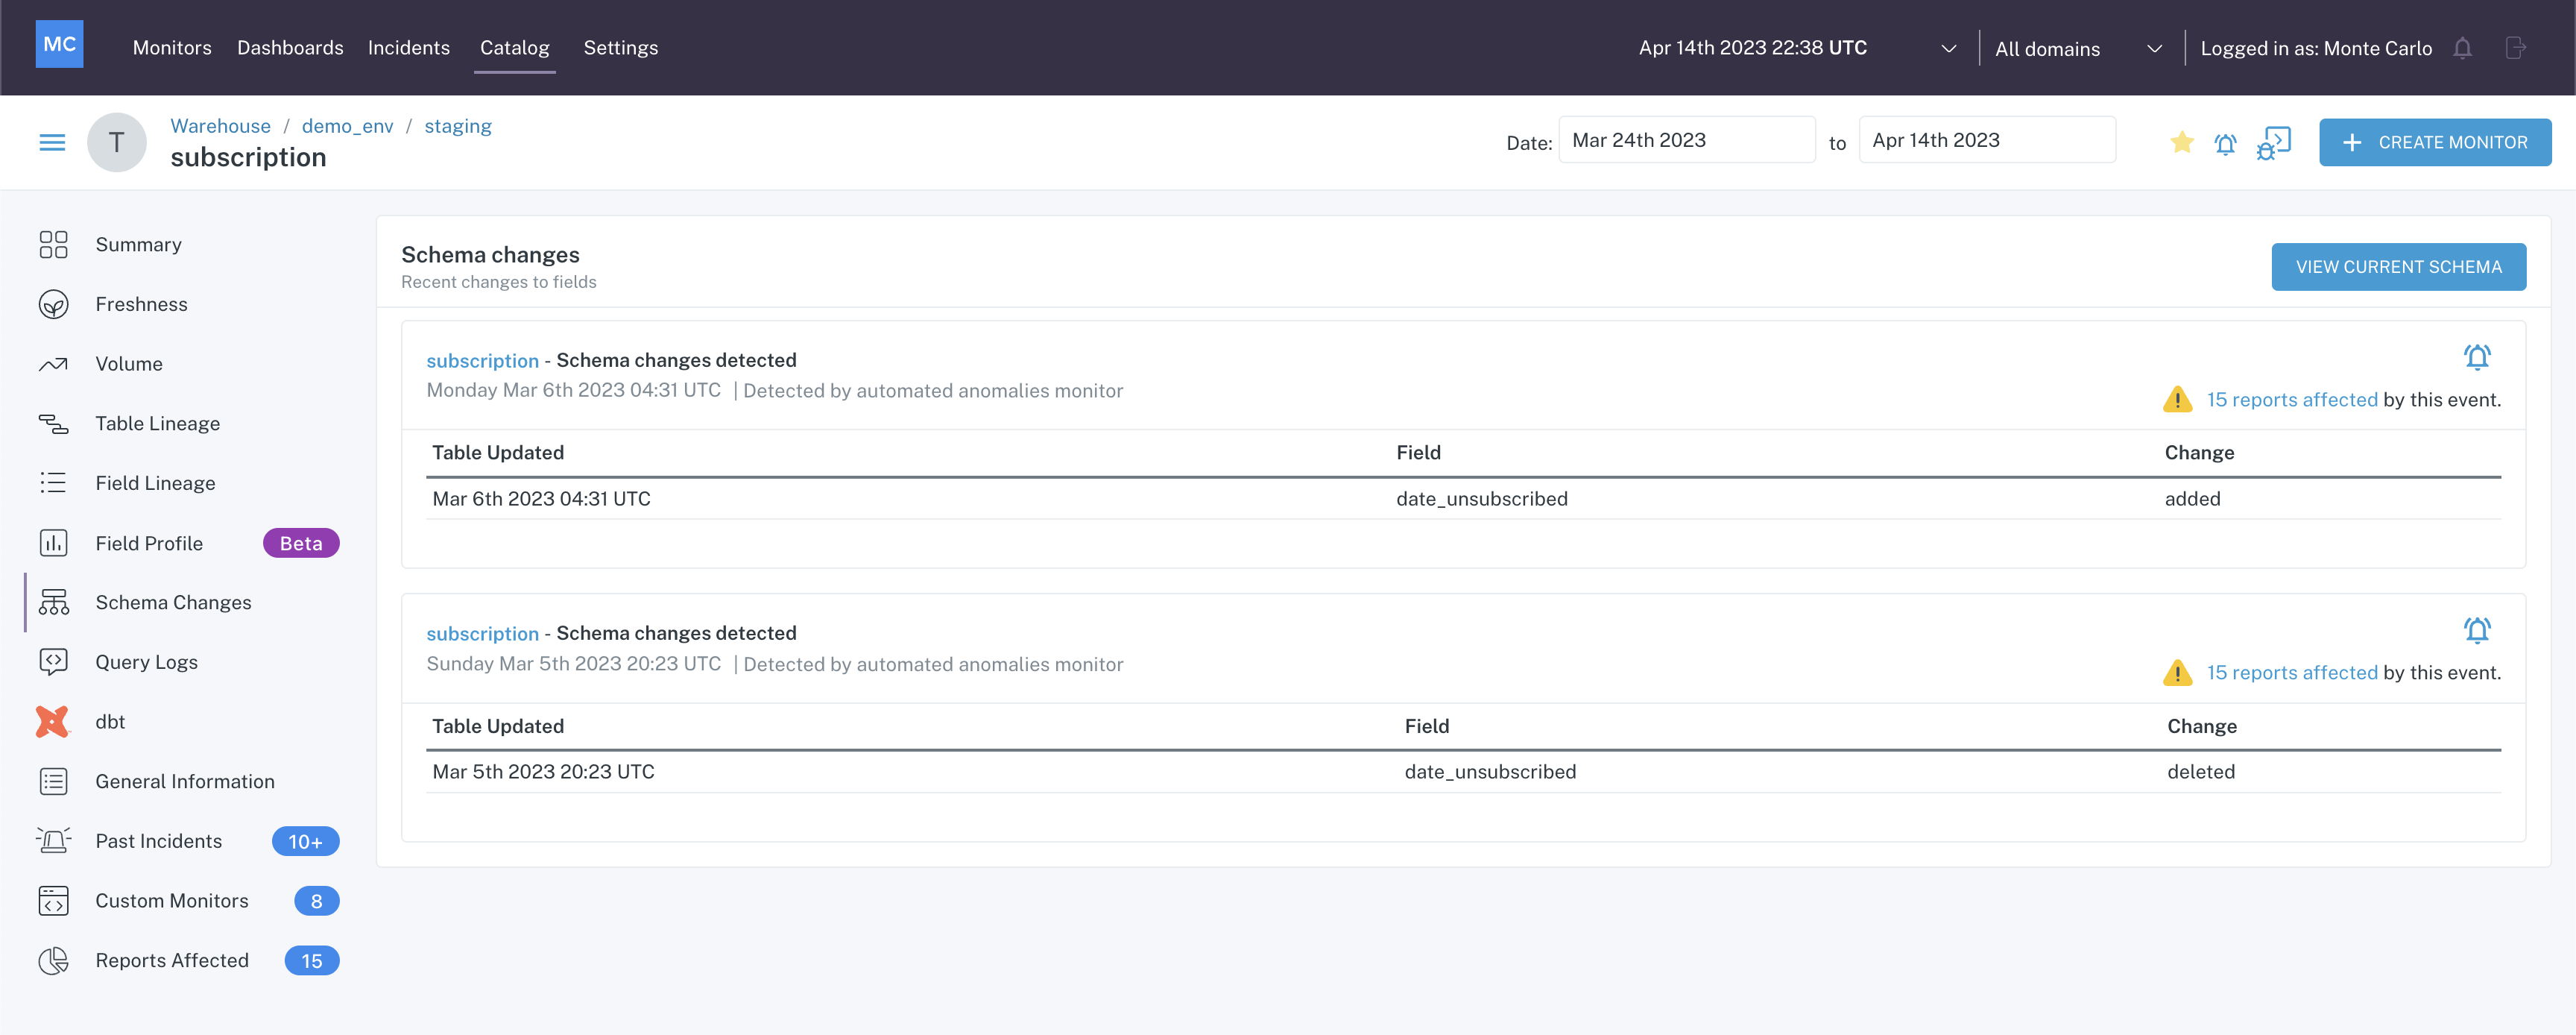
Clicking the View Current Schema reveals a drawer that displays a list of columns and their data types.
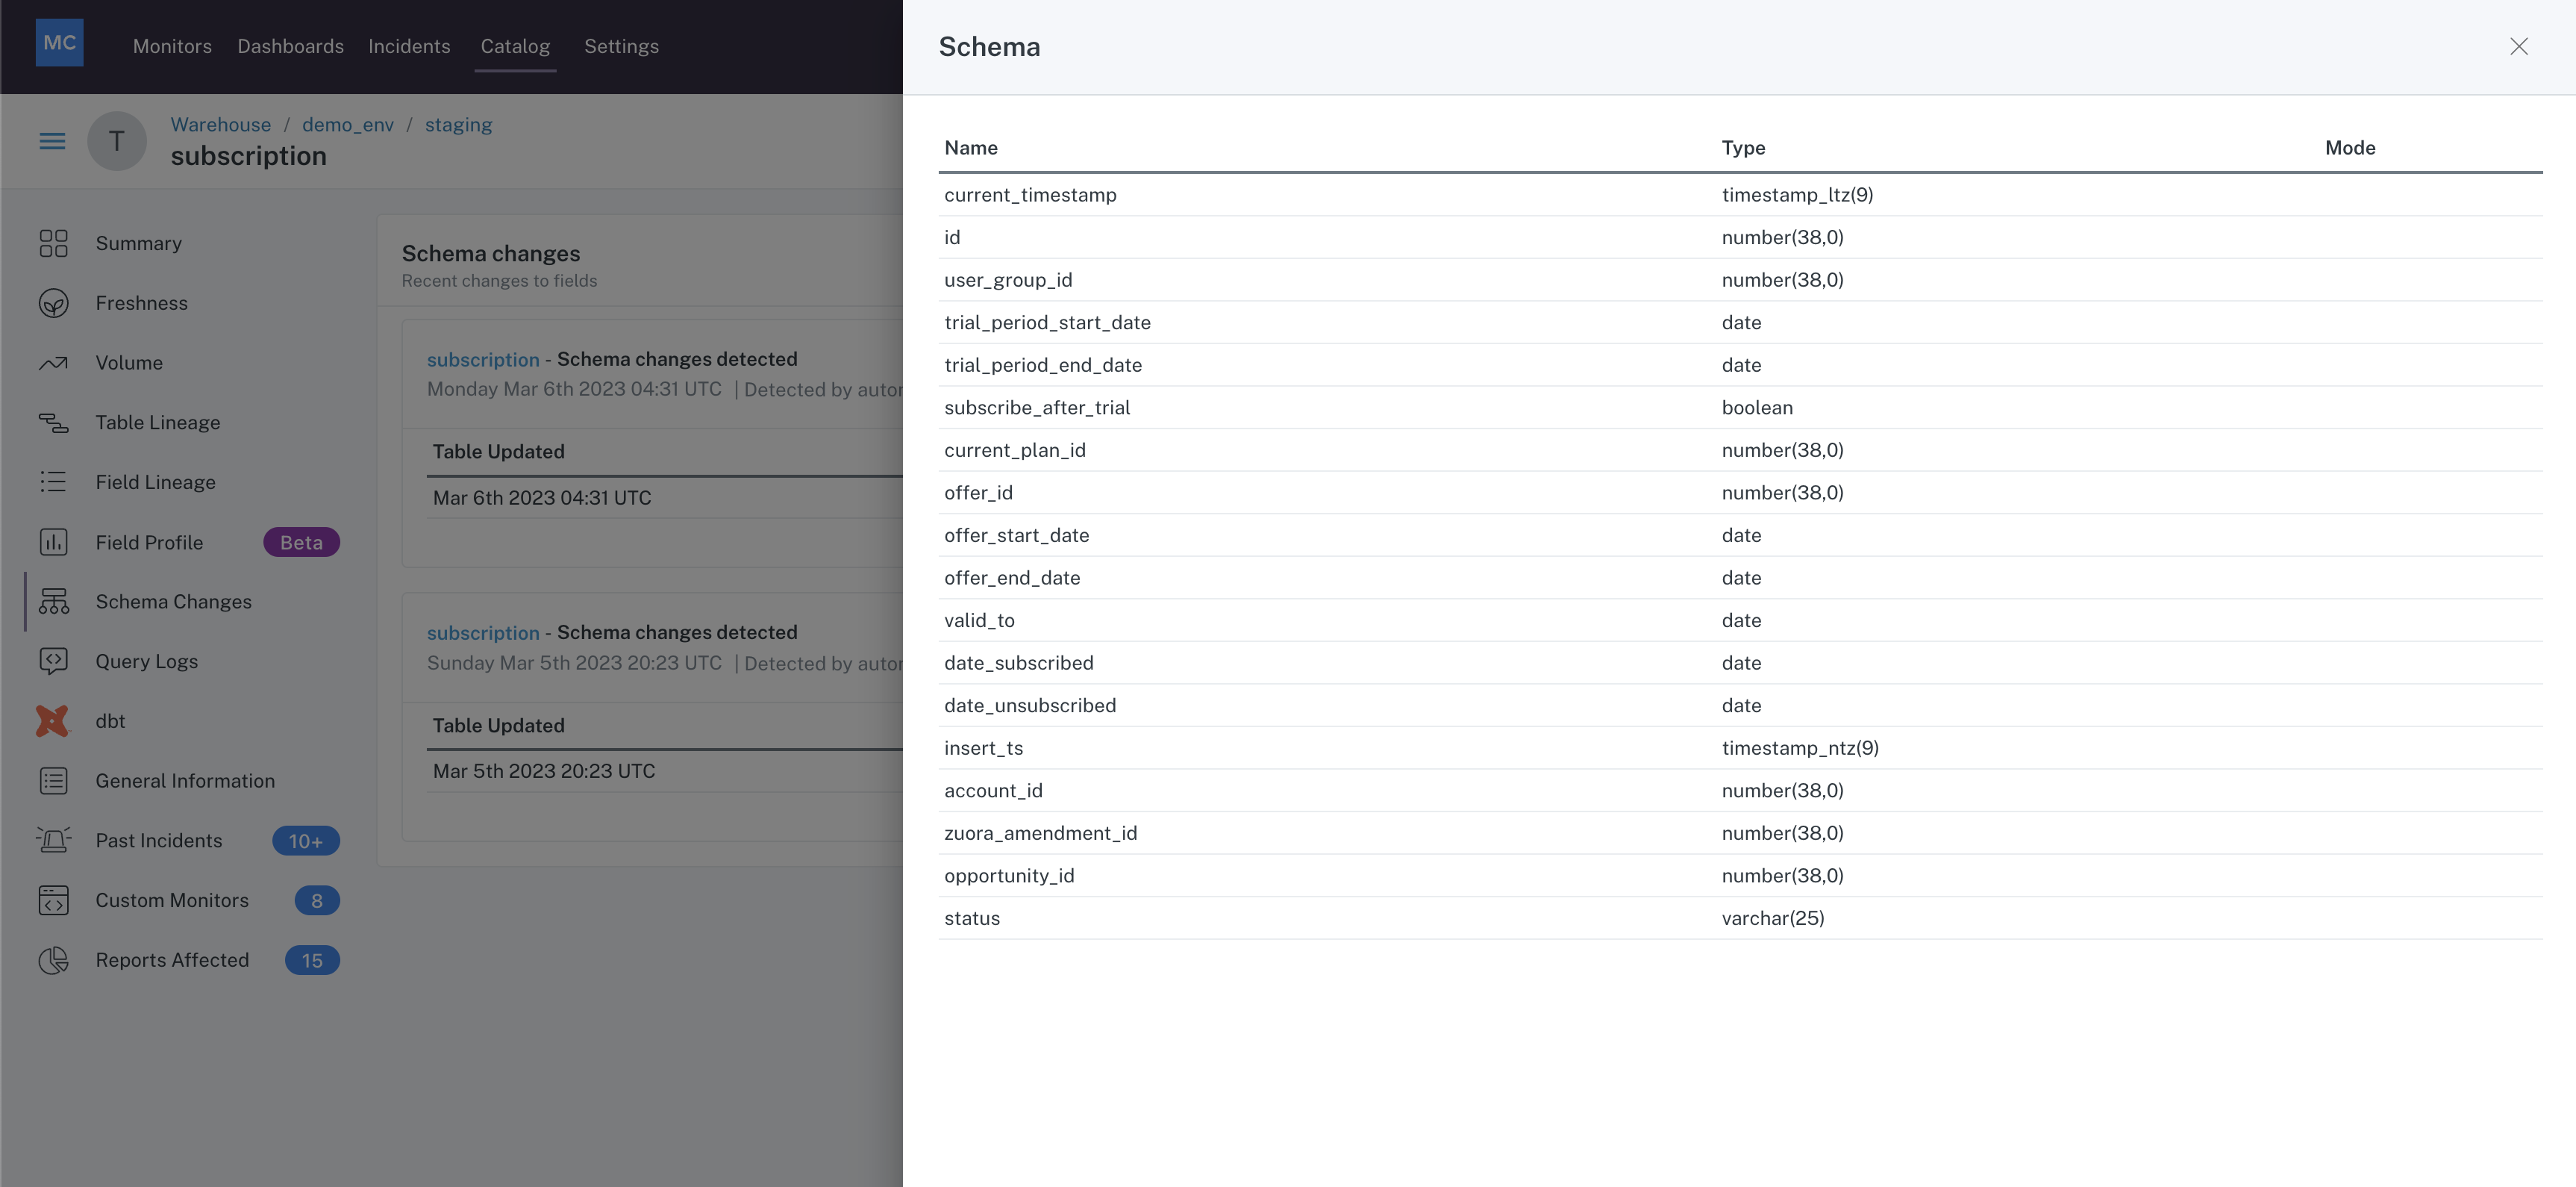
Current Schema drawer
More on Schema monitoring here.
Custom Monitors
Inspect the Custom Monitors tab to see what custom monitors are set up on this data asset, the state of the monitors, the run schedule, and alert trends related to each.
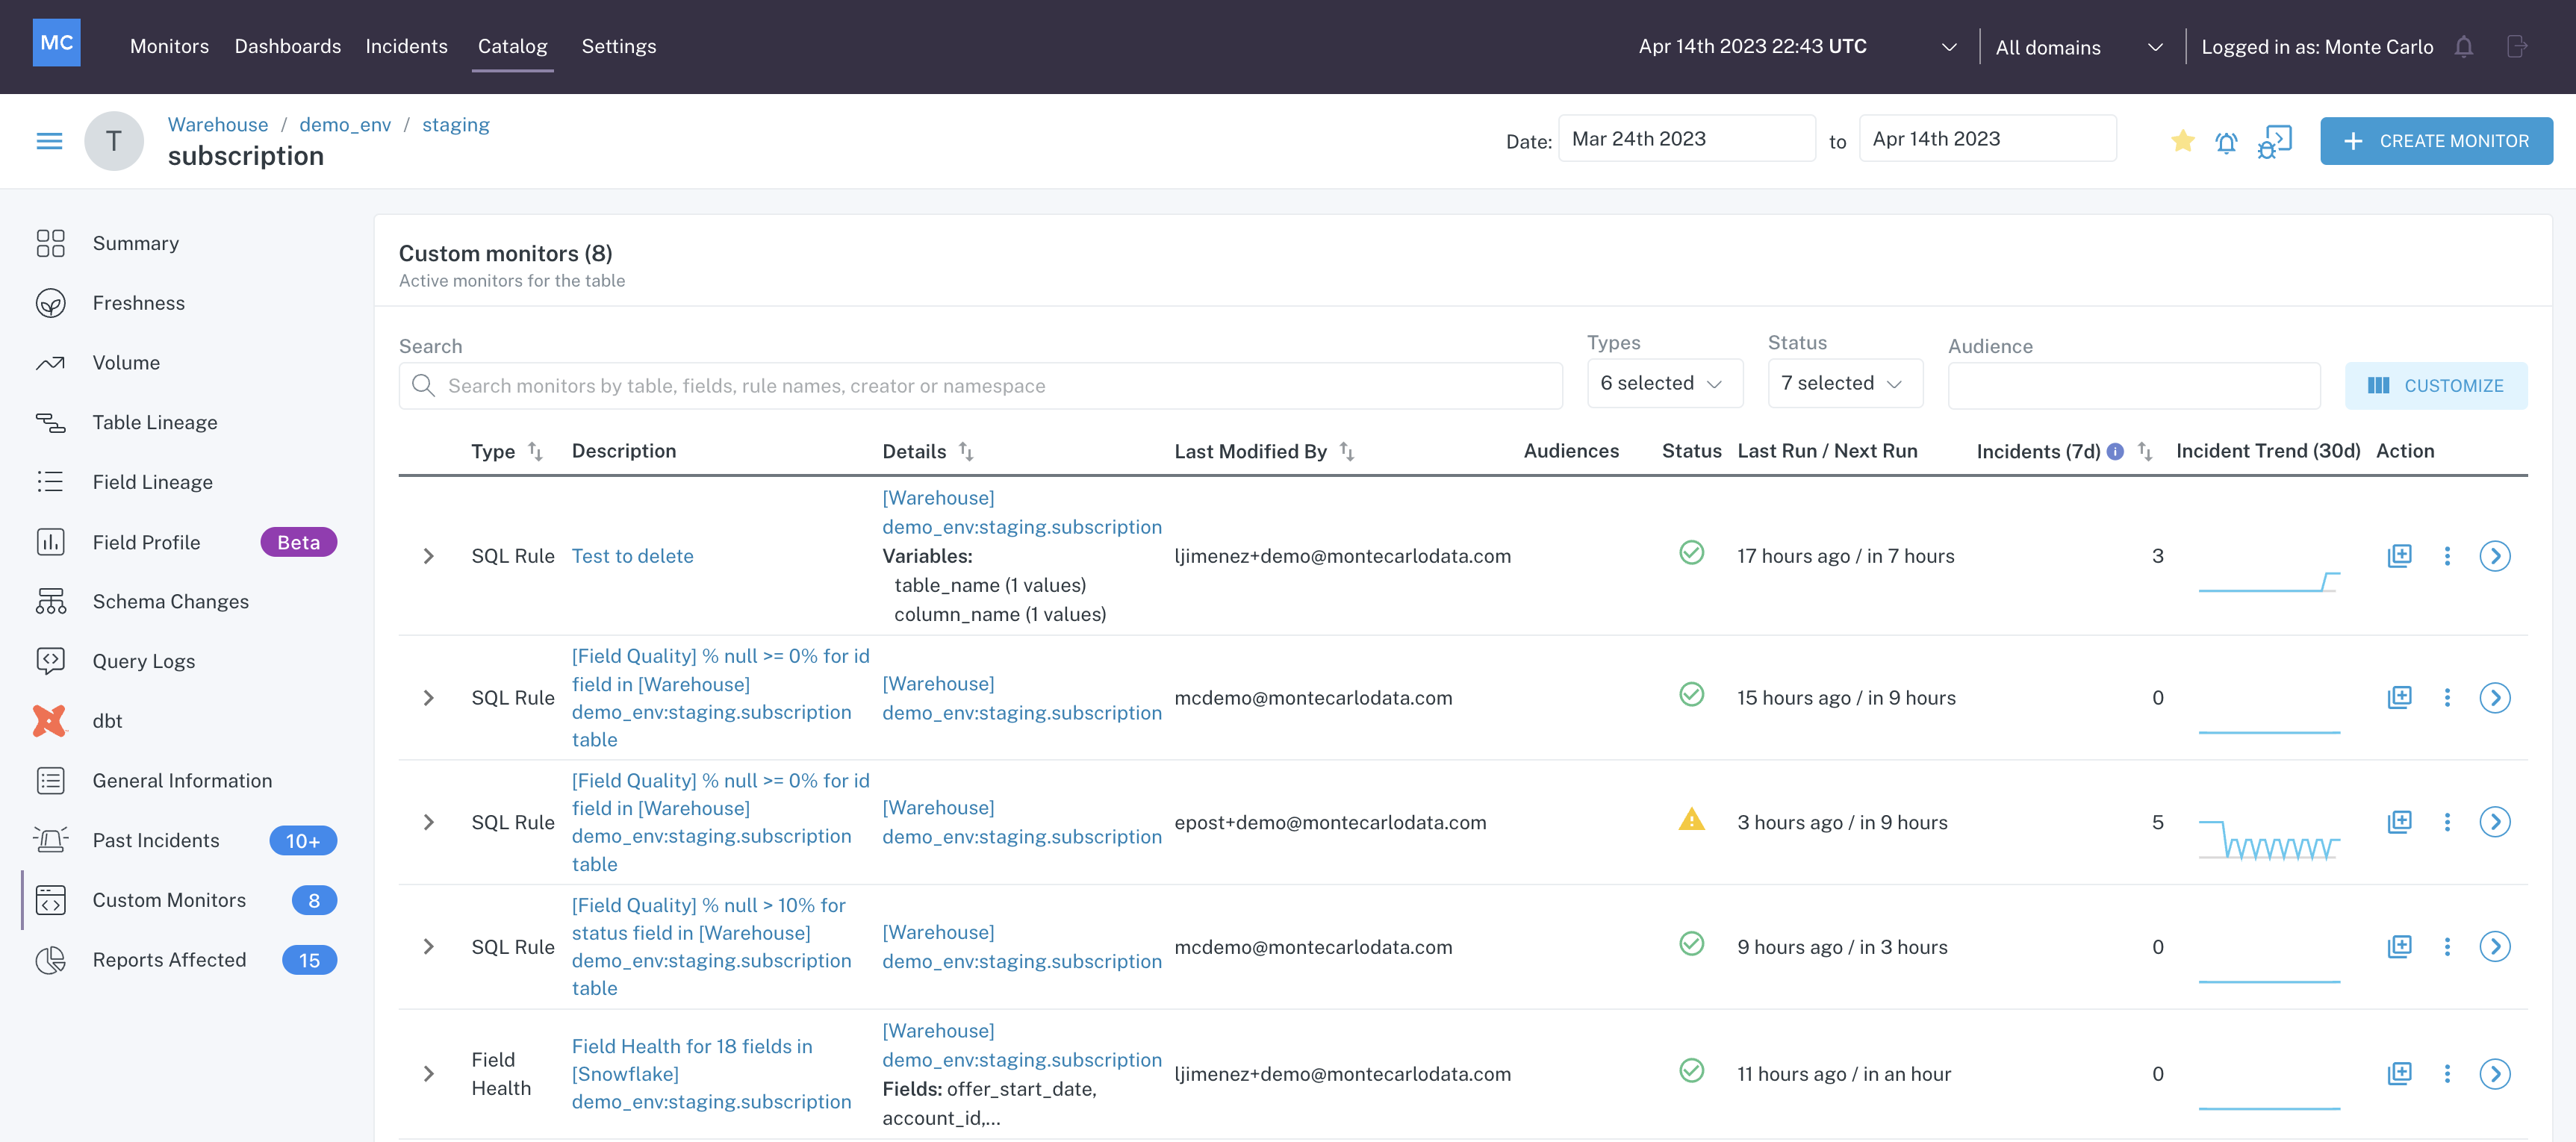
Custom Monitors
A search bar and filters are available to narrow the results displayed.
Clicking on any of the monitor descriptions will take you to the Monitor Details page for that monitor.
Clicking on any of the resource names in the details column will take you to the Assets page for that resource.
Field Profile
In the Field Profile tab of Assets, you can visualize the statistics calculated by a Field Health monitor set up on the data asset which you are reviewing.
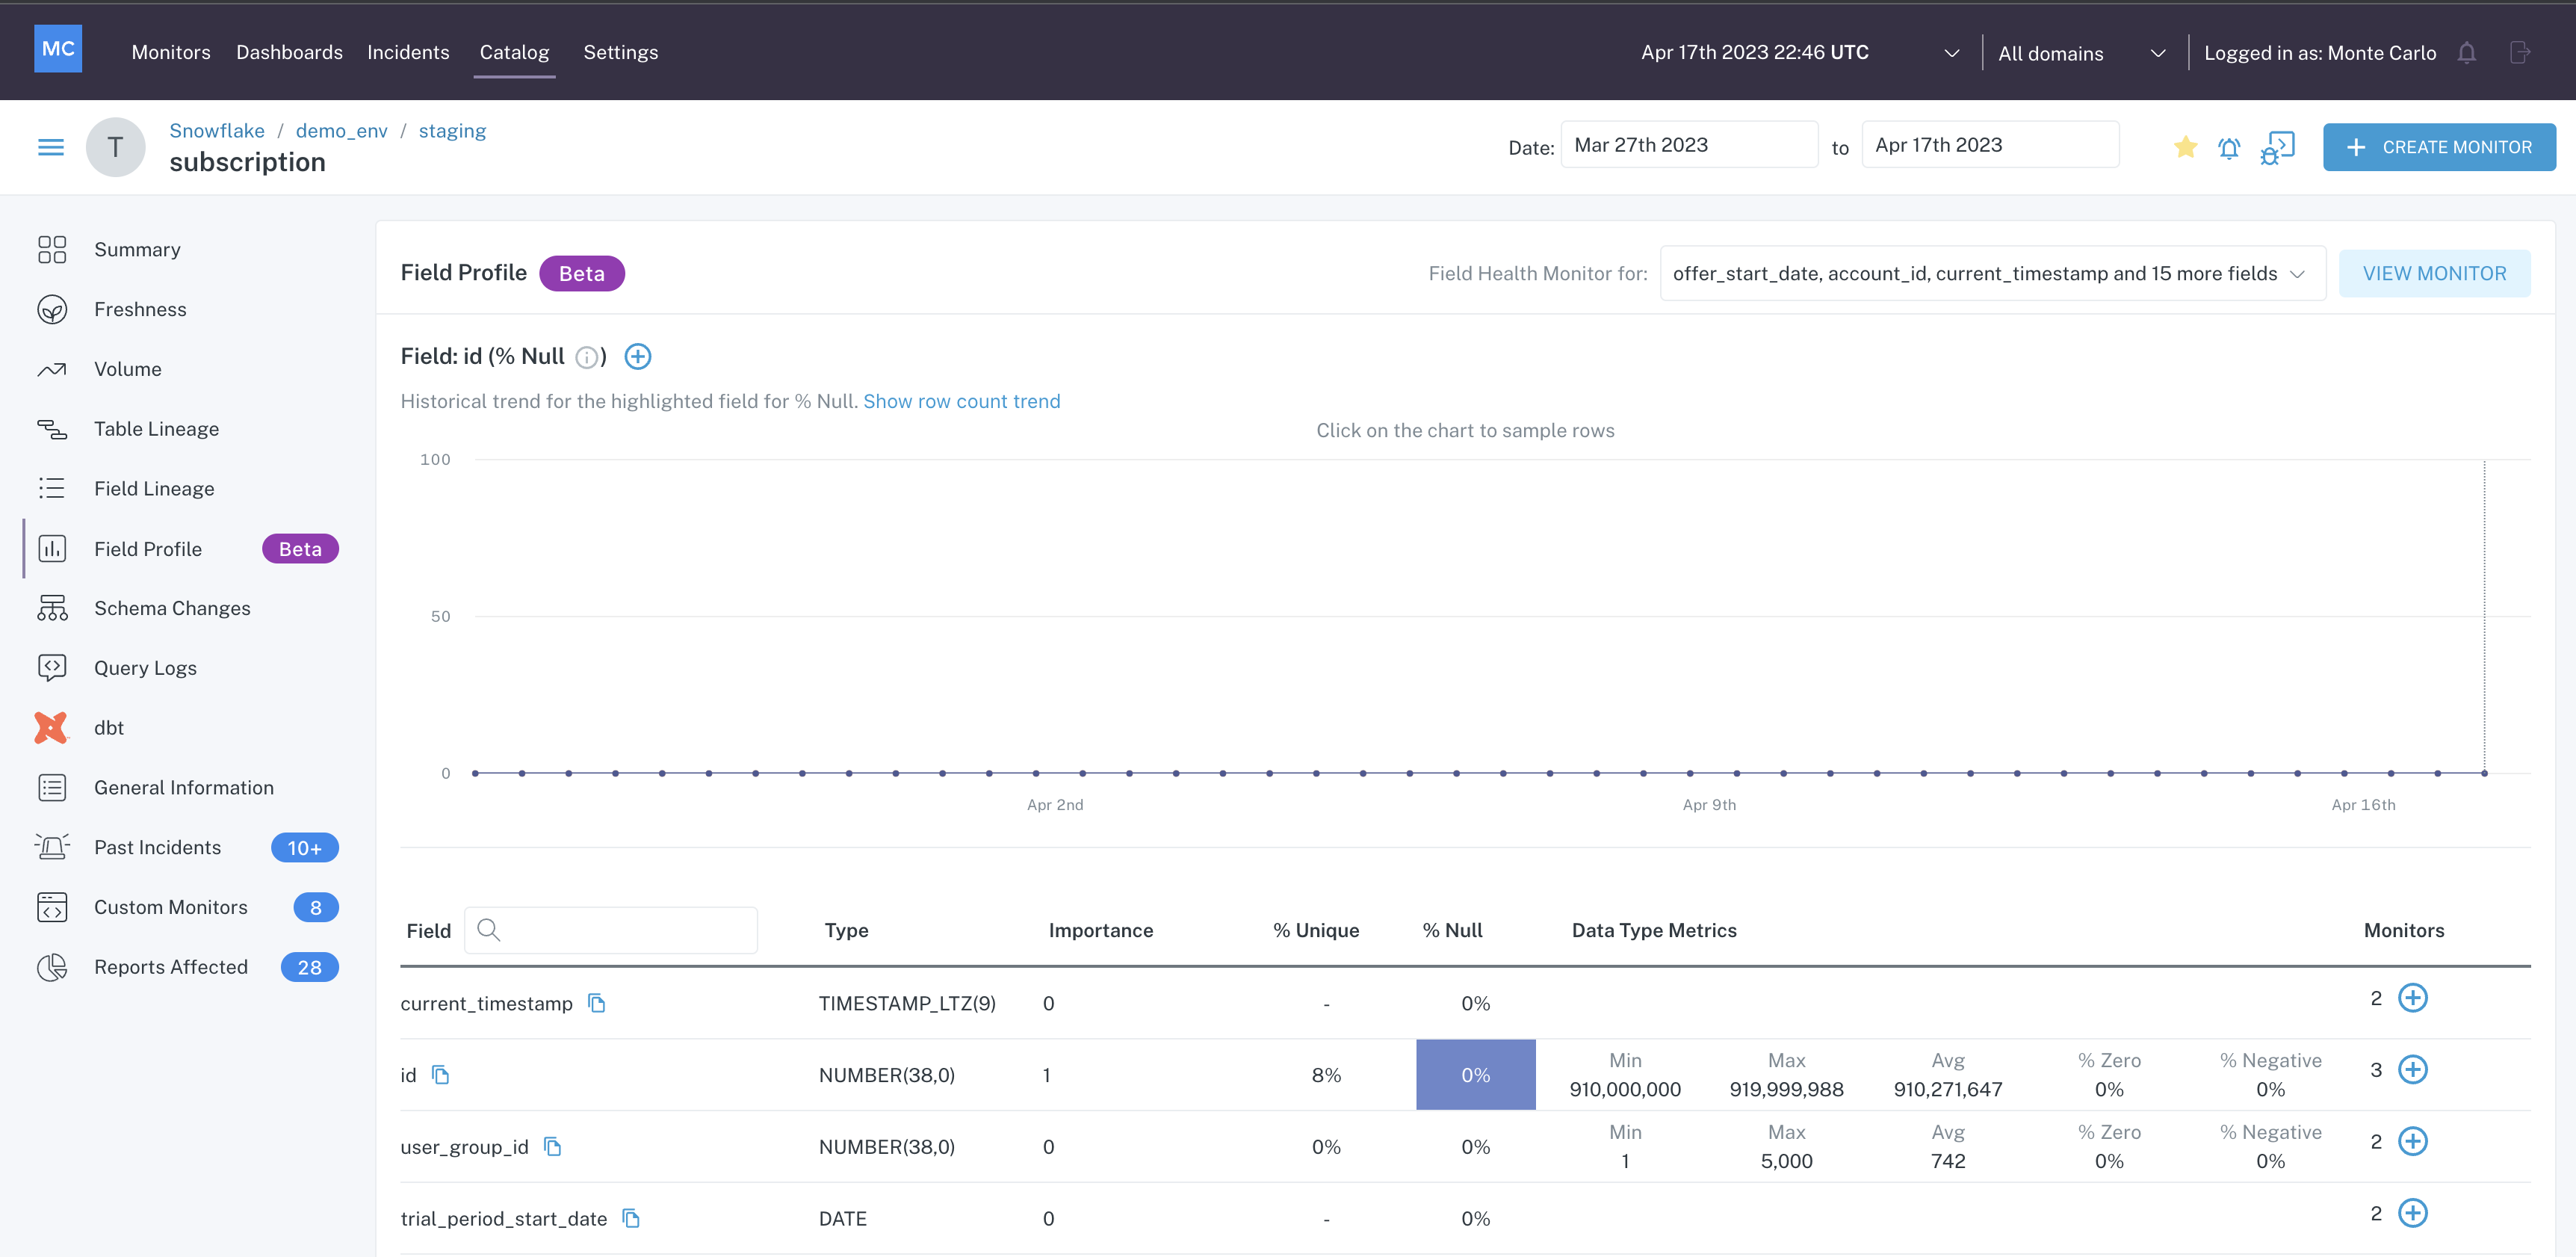
Field Profile
Here, you can quickly see statistics on columns in the table.
Note that you must have a Field Health monitor configured for a data asset in order to see this information within Assets.
More on Field Health monitors here.
Lineage & Query Logs
You may use Assets to understand how data is flowing into a data asset and where the data from the data asset flows downstream.
Table Lineage
Inspect table lineage within the context of a data asset from the Table Lineage tab within an Assets detail page
See how data is coming into the data asset by viewing Upstream nodes:
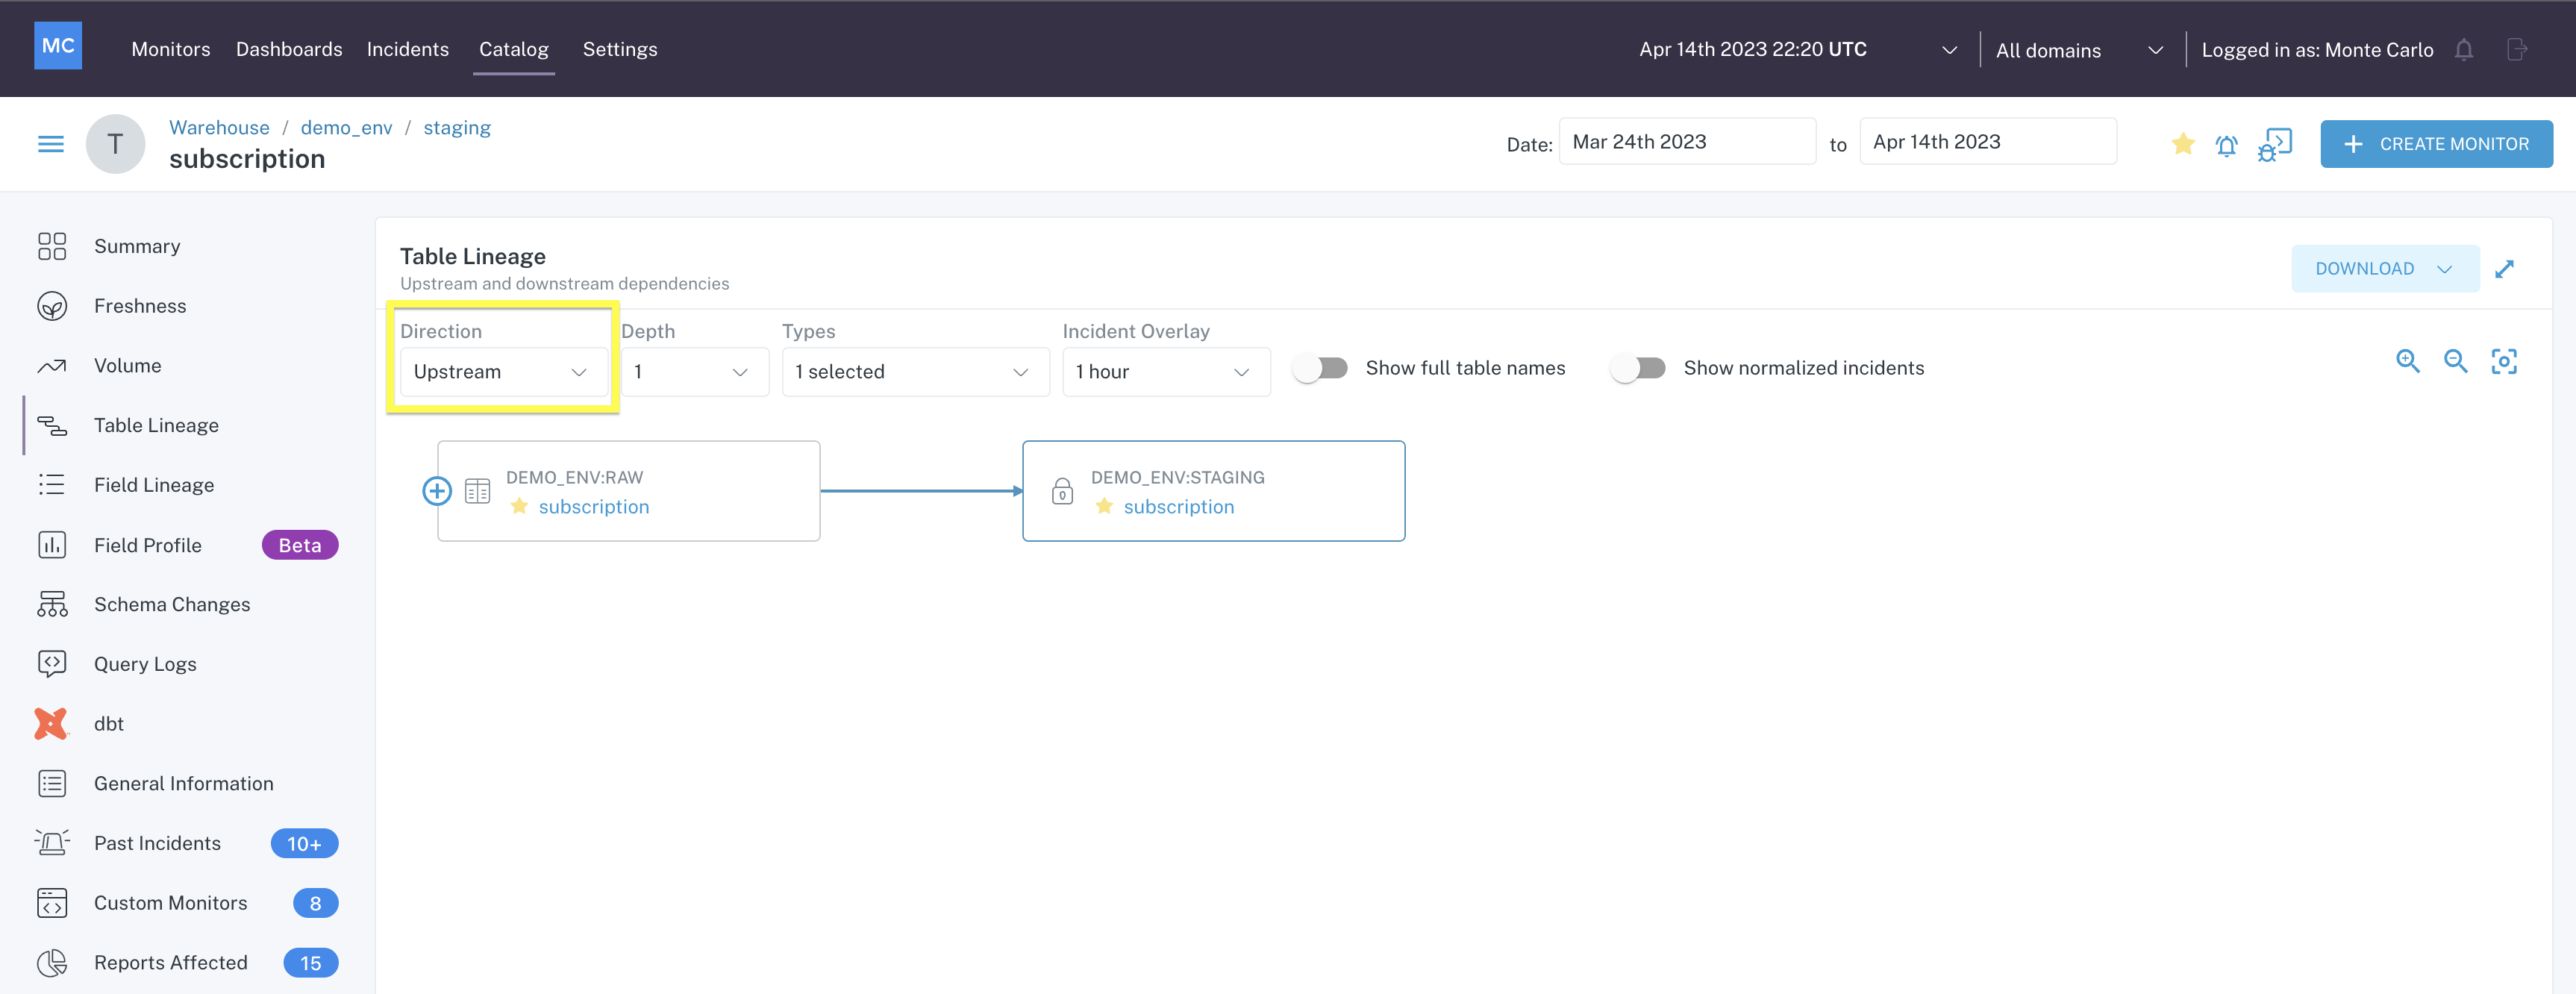
Upstream nodes in Table Lineage
See where data flows downstream from the data asset by viewing the Downstream nodes:
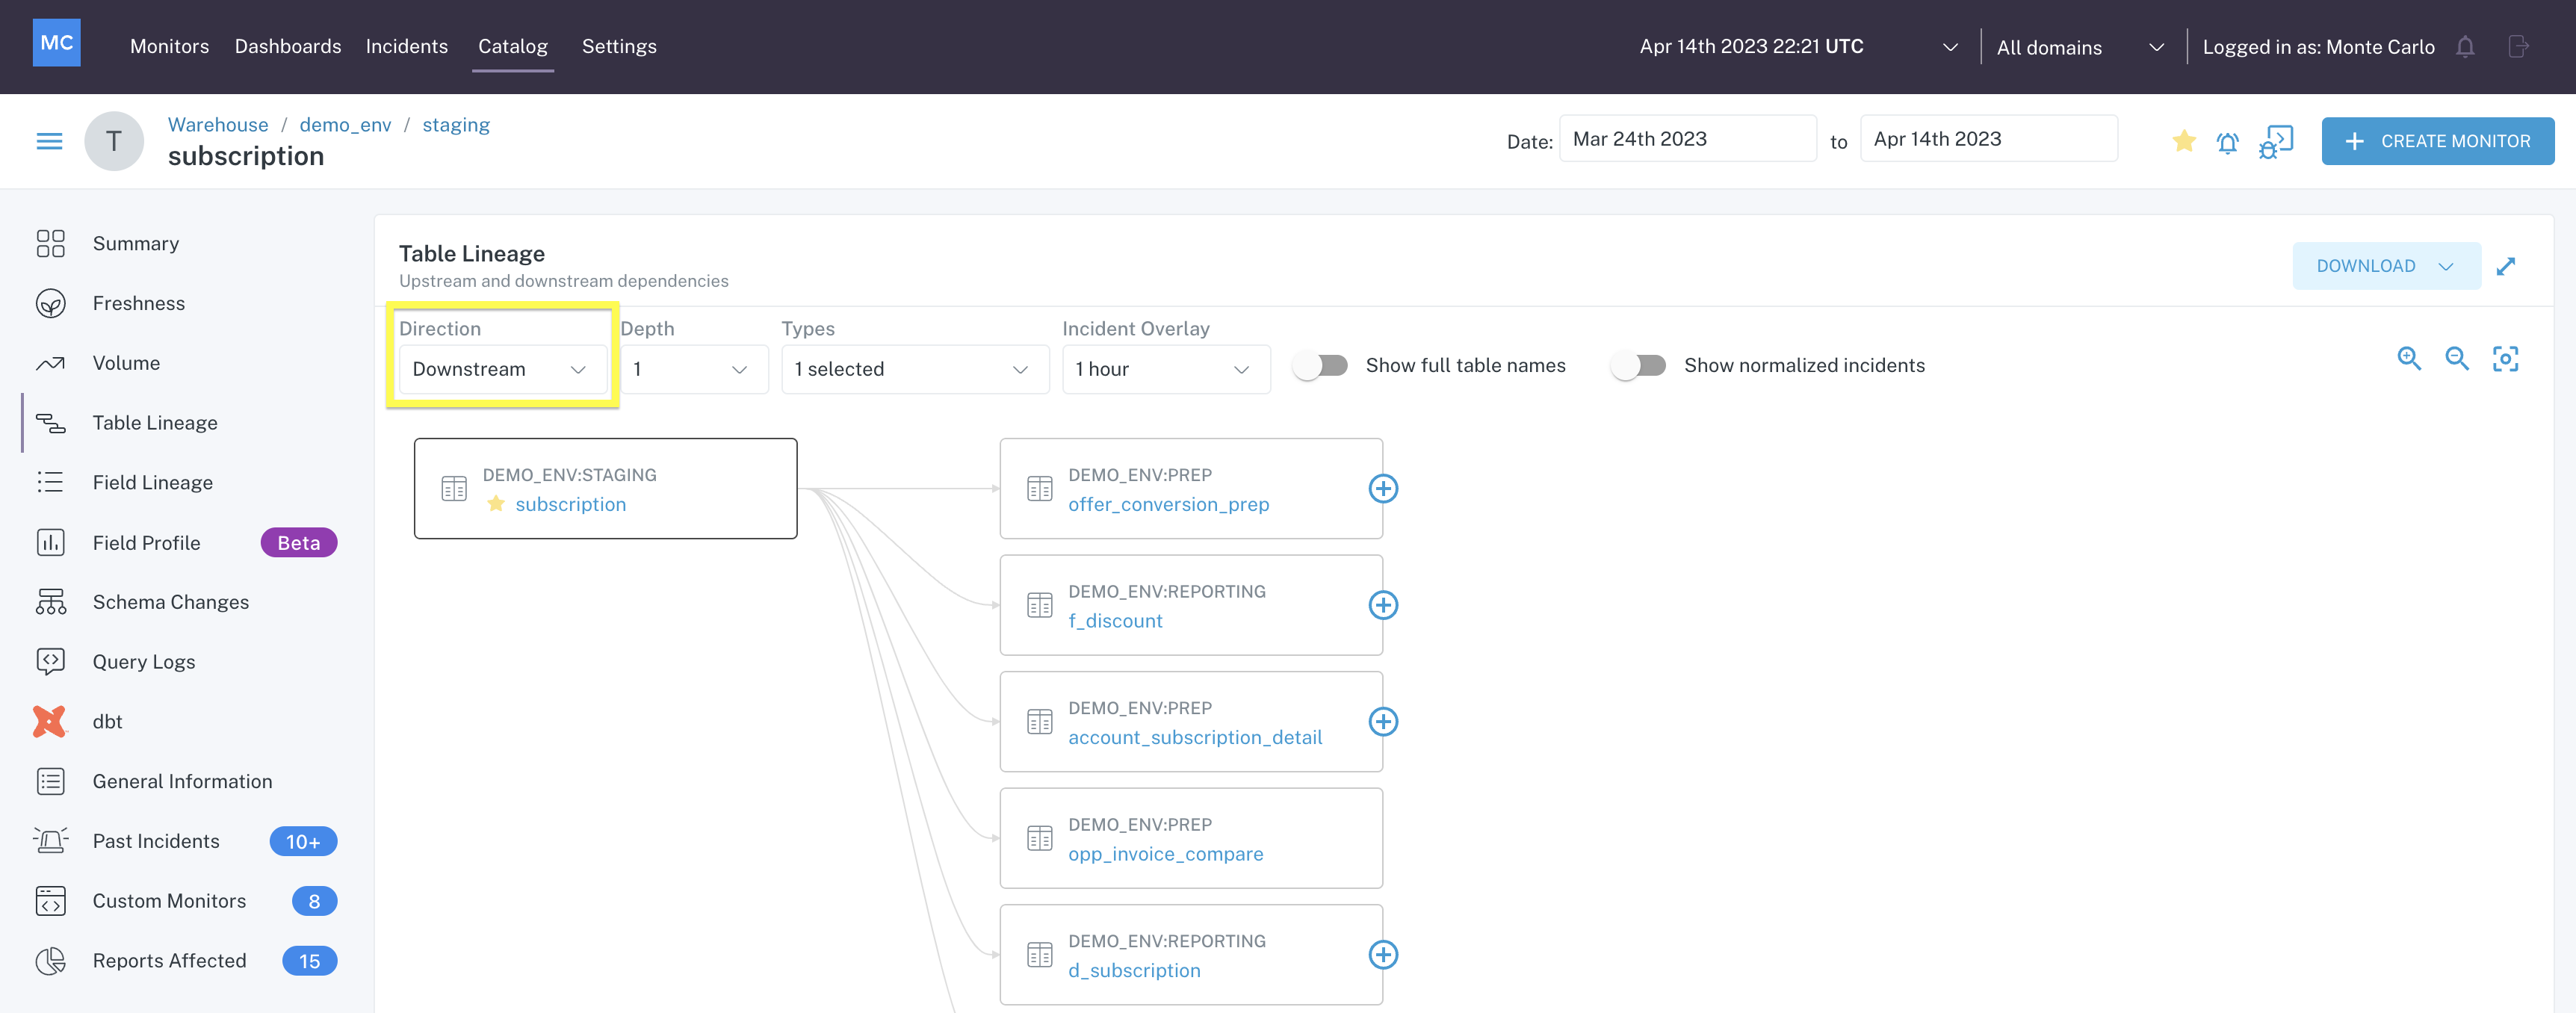
Downstream nodes in Table Lineage
Hover over any node in the lineage to get a quick insight into that node.
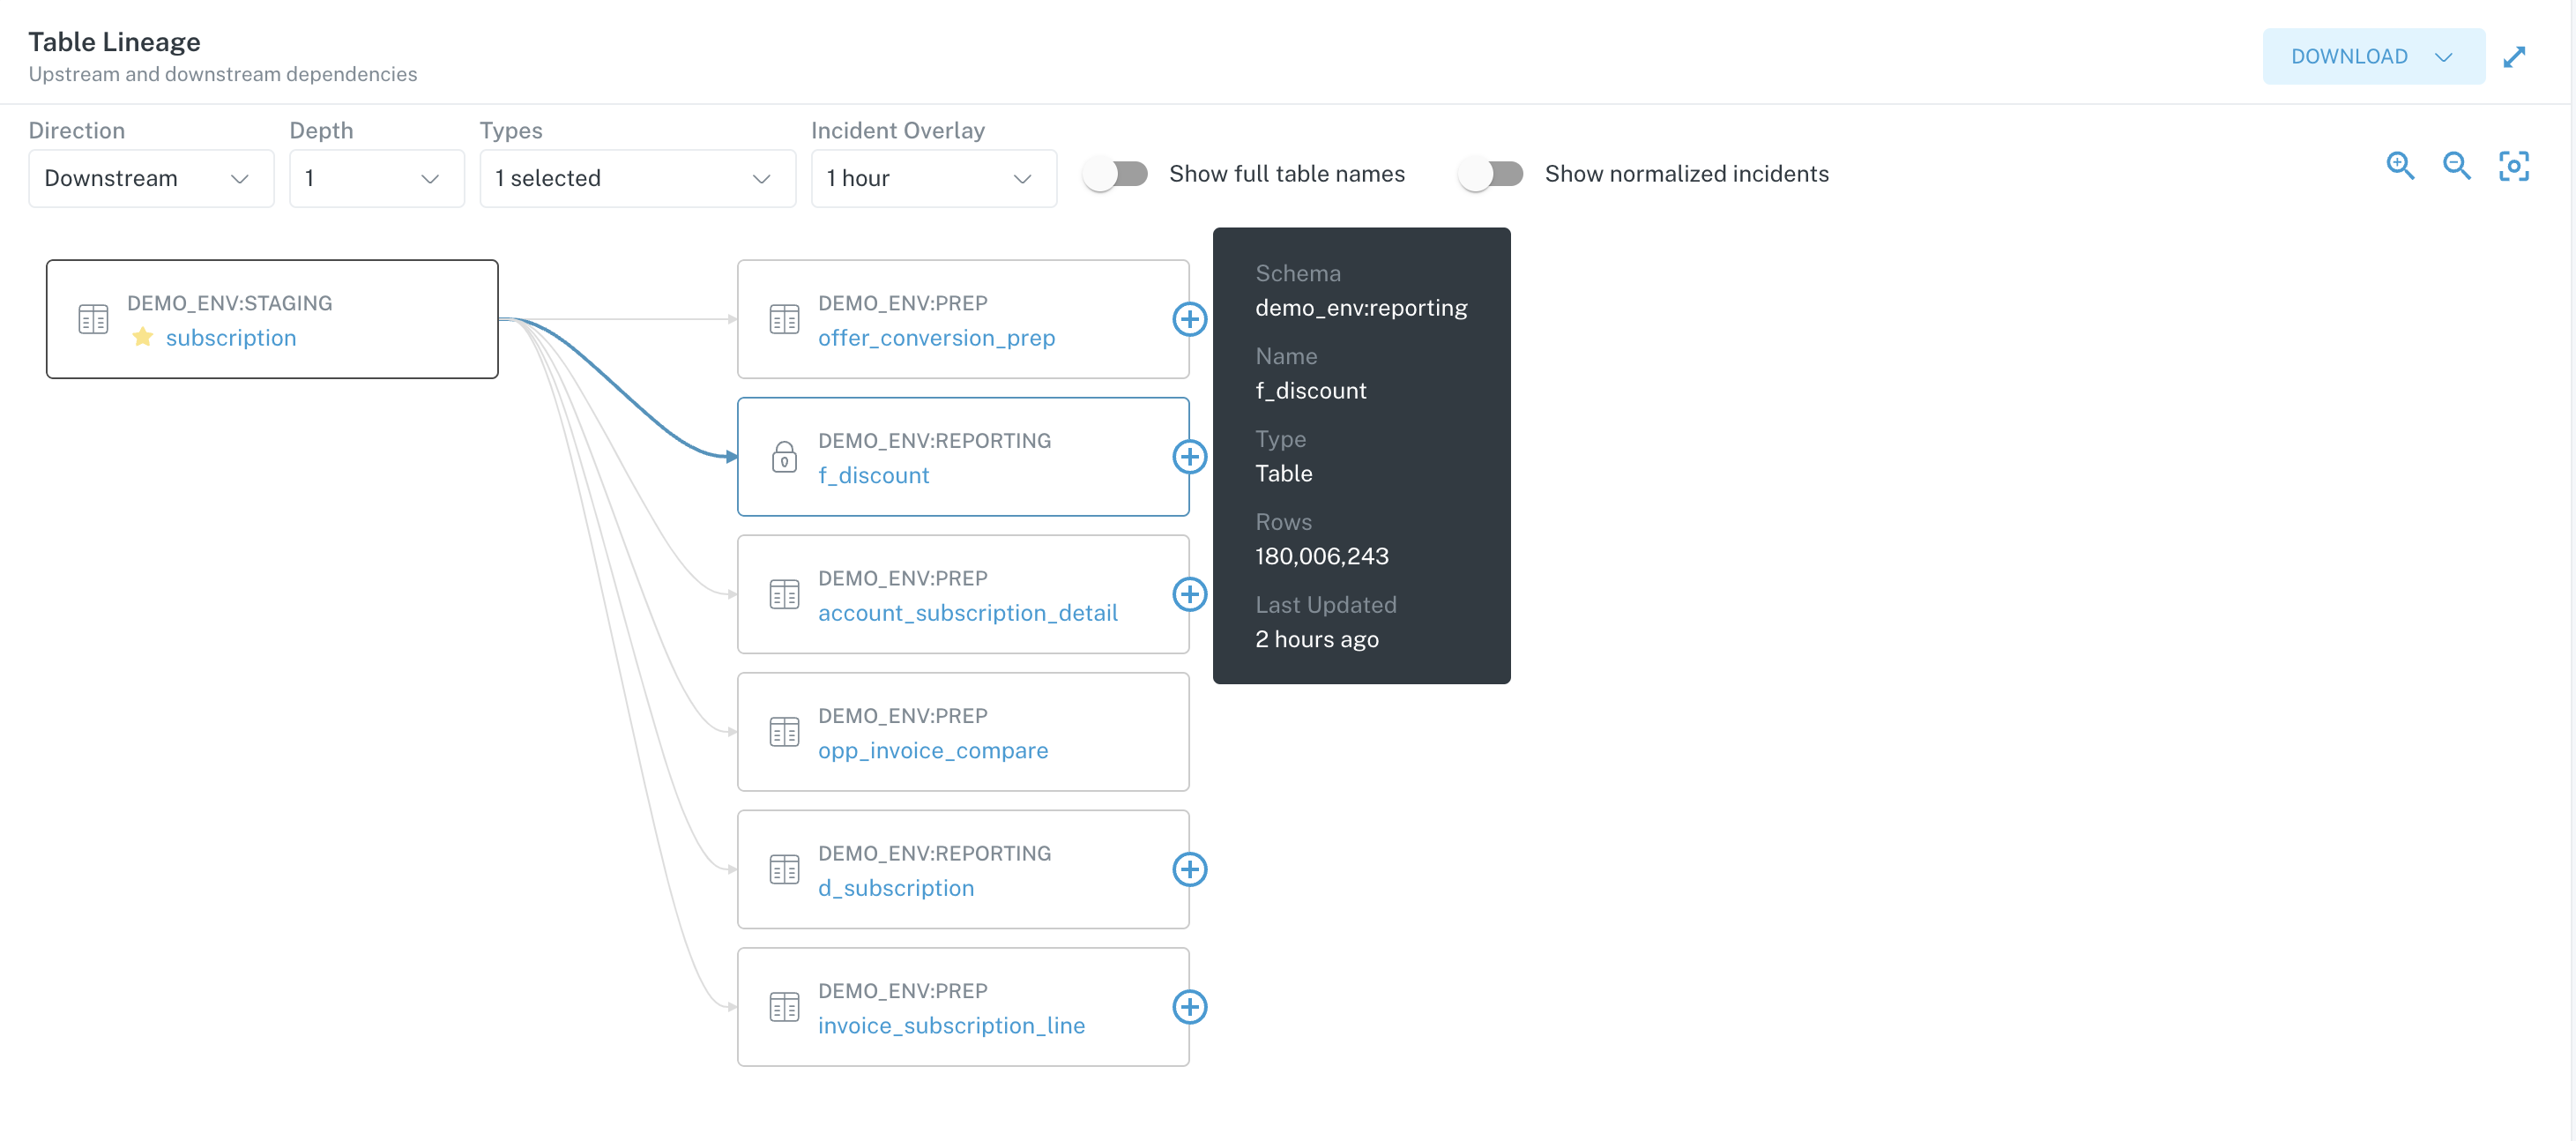
Downstream node details on hover
Click on any node to be taken directly to the Assets page for that node.
Field Lineage
Inspect the field lineage of a data asset from the Field Lineage tab within an Assets page.
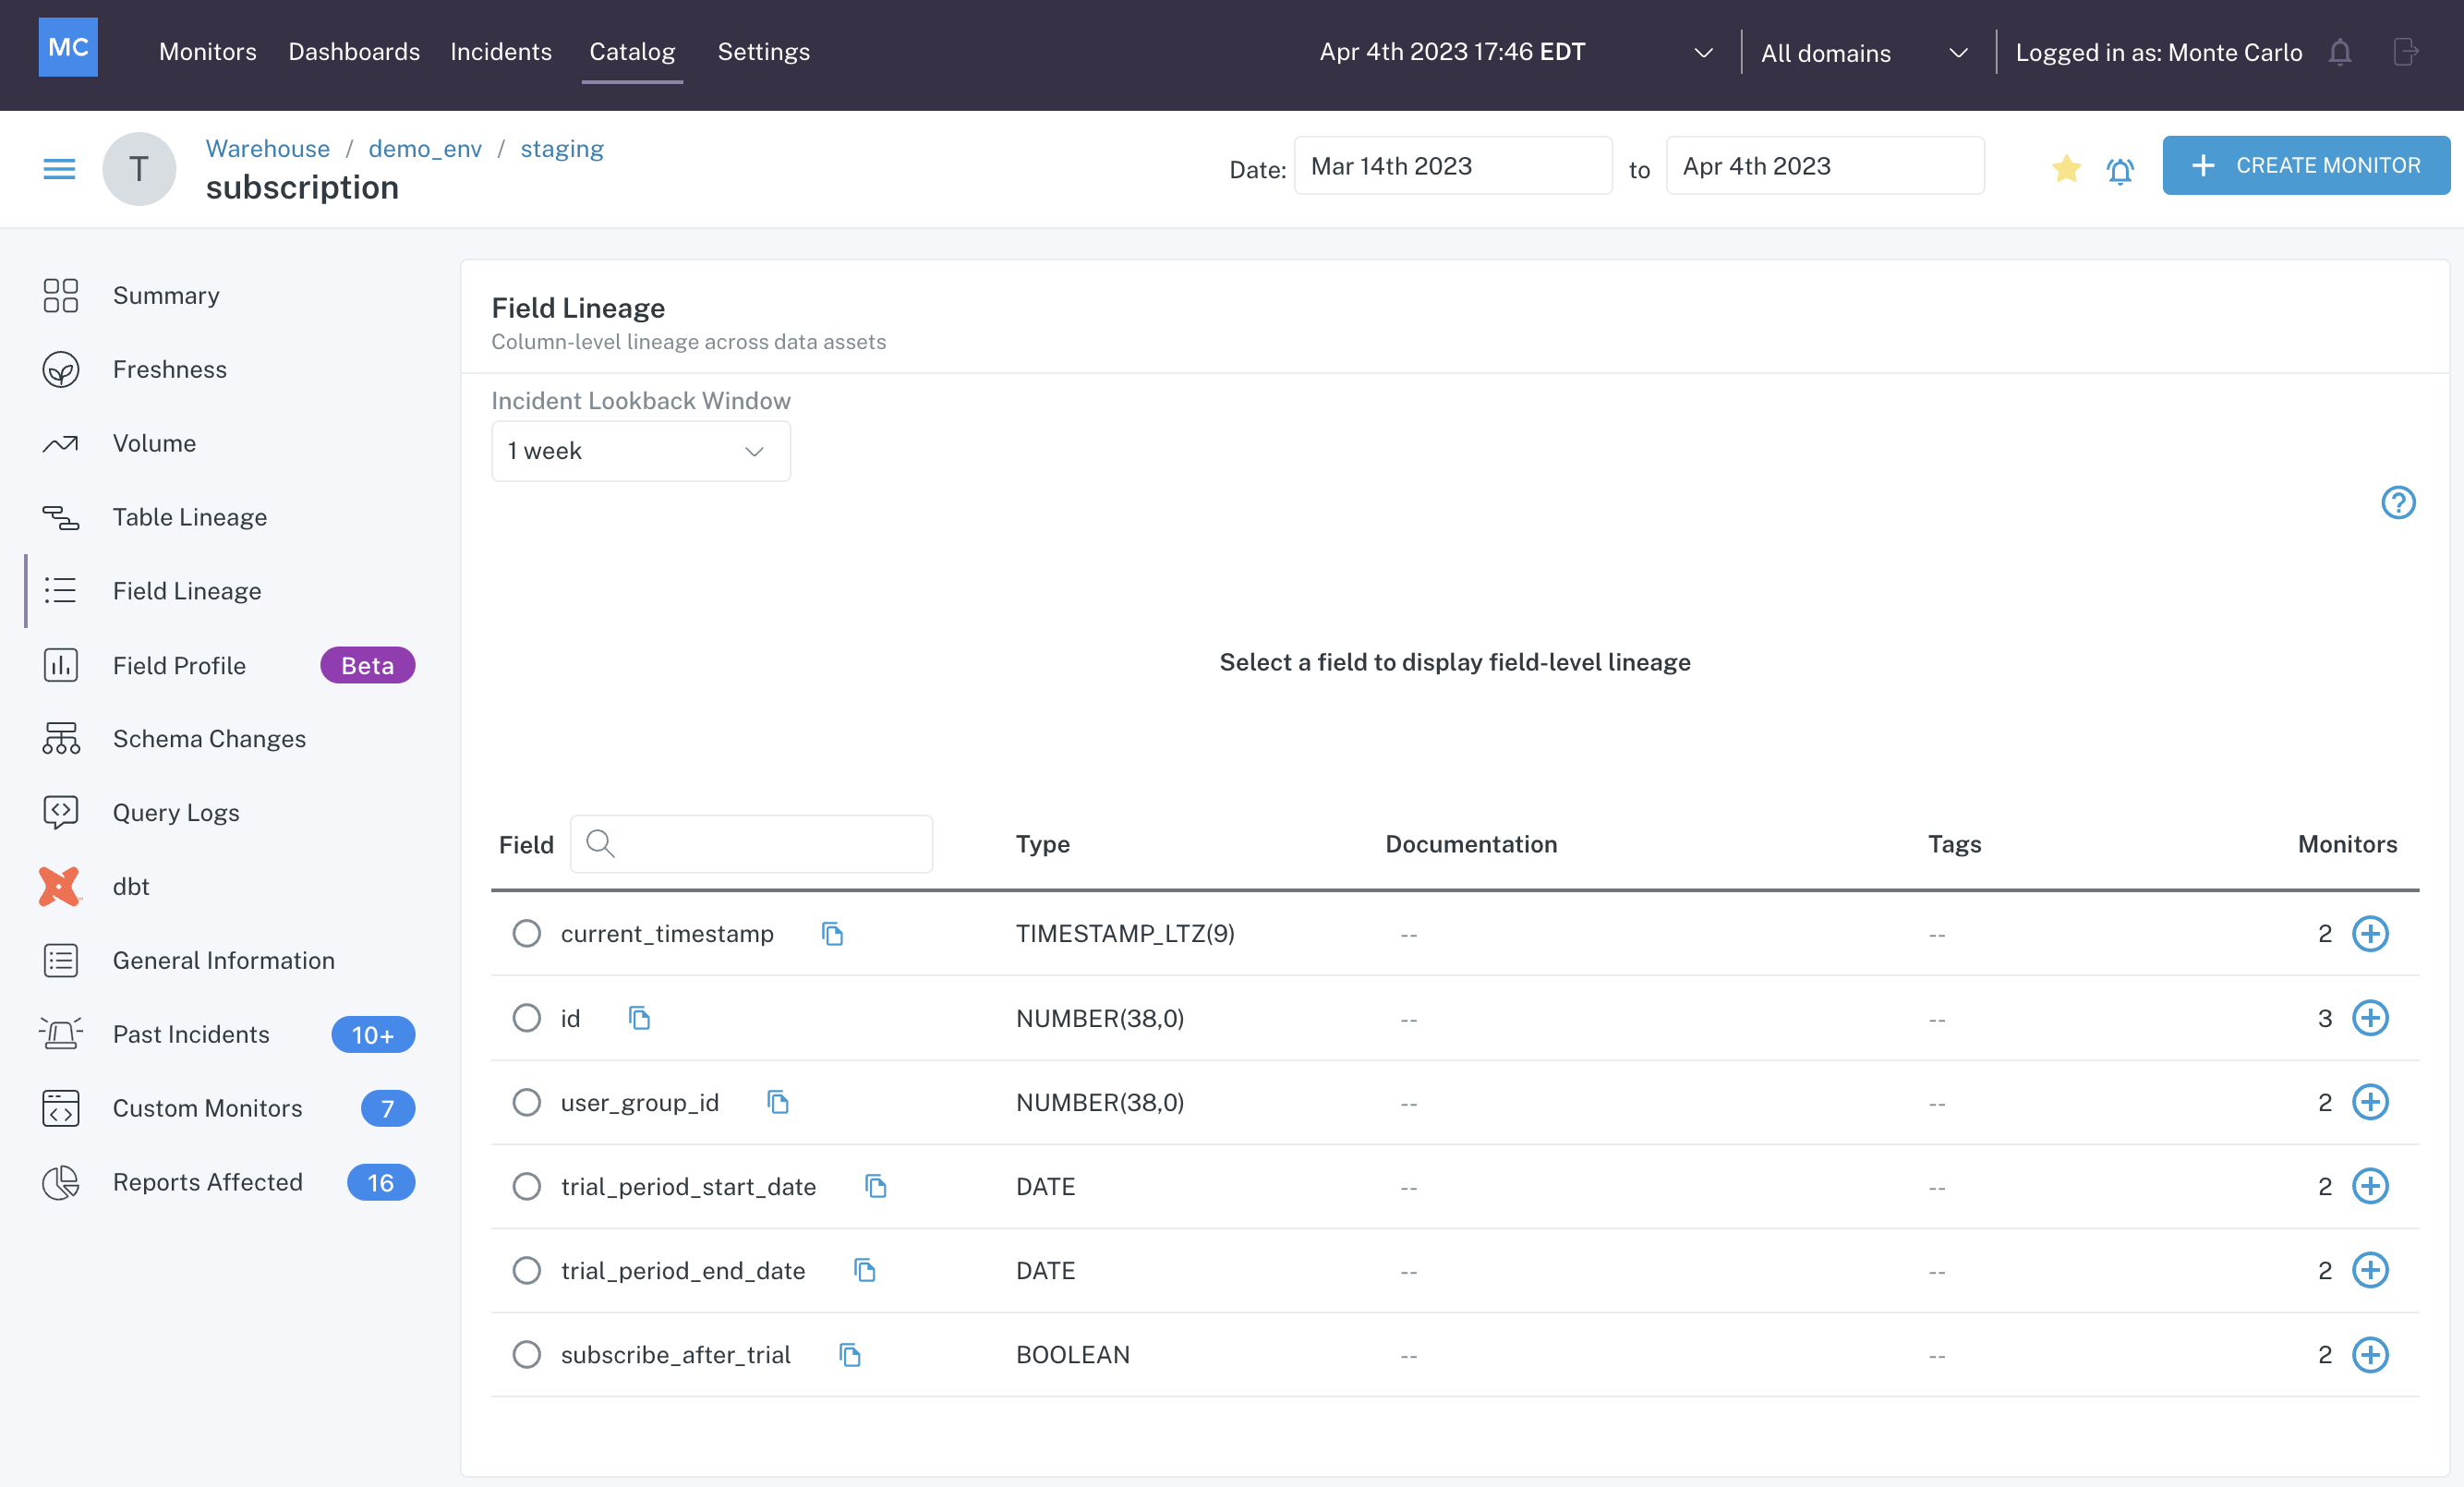
Field Lineage
Click on a field to see how it is used upstream and downstream of this table.
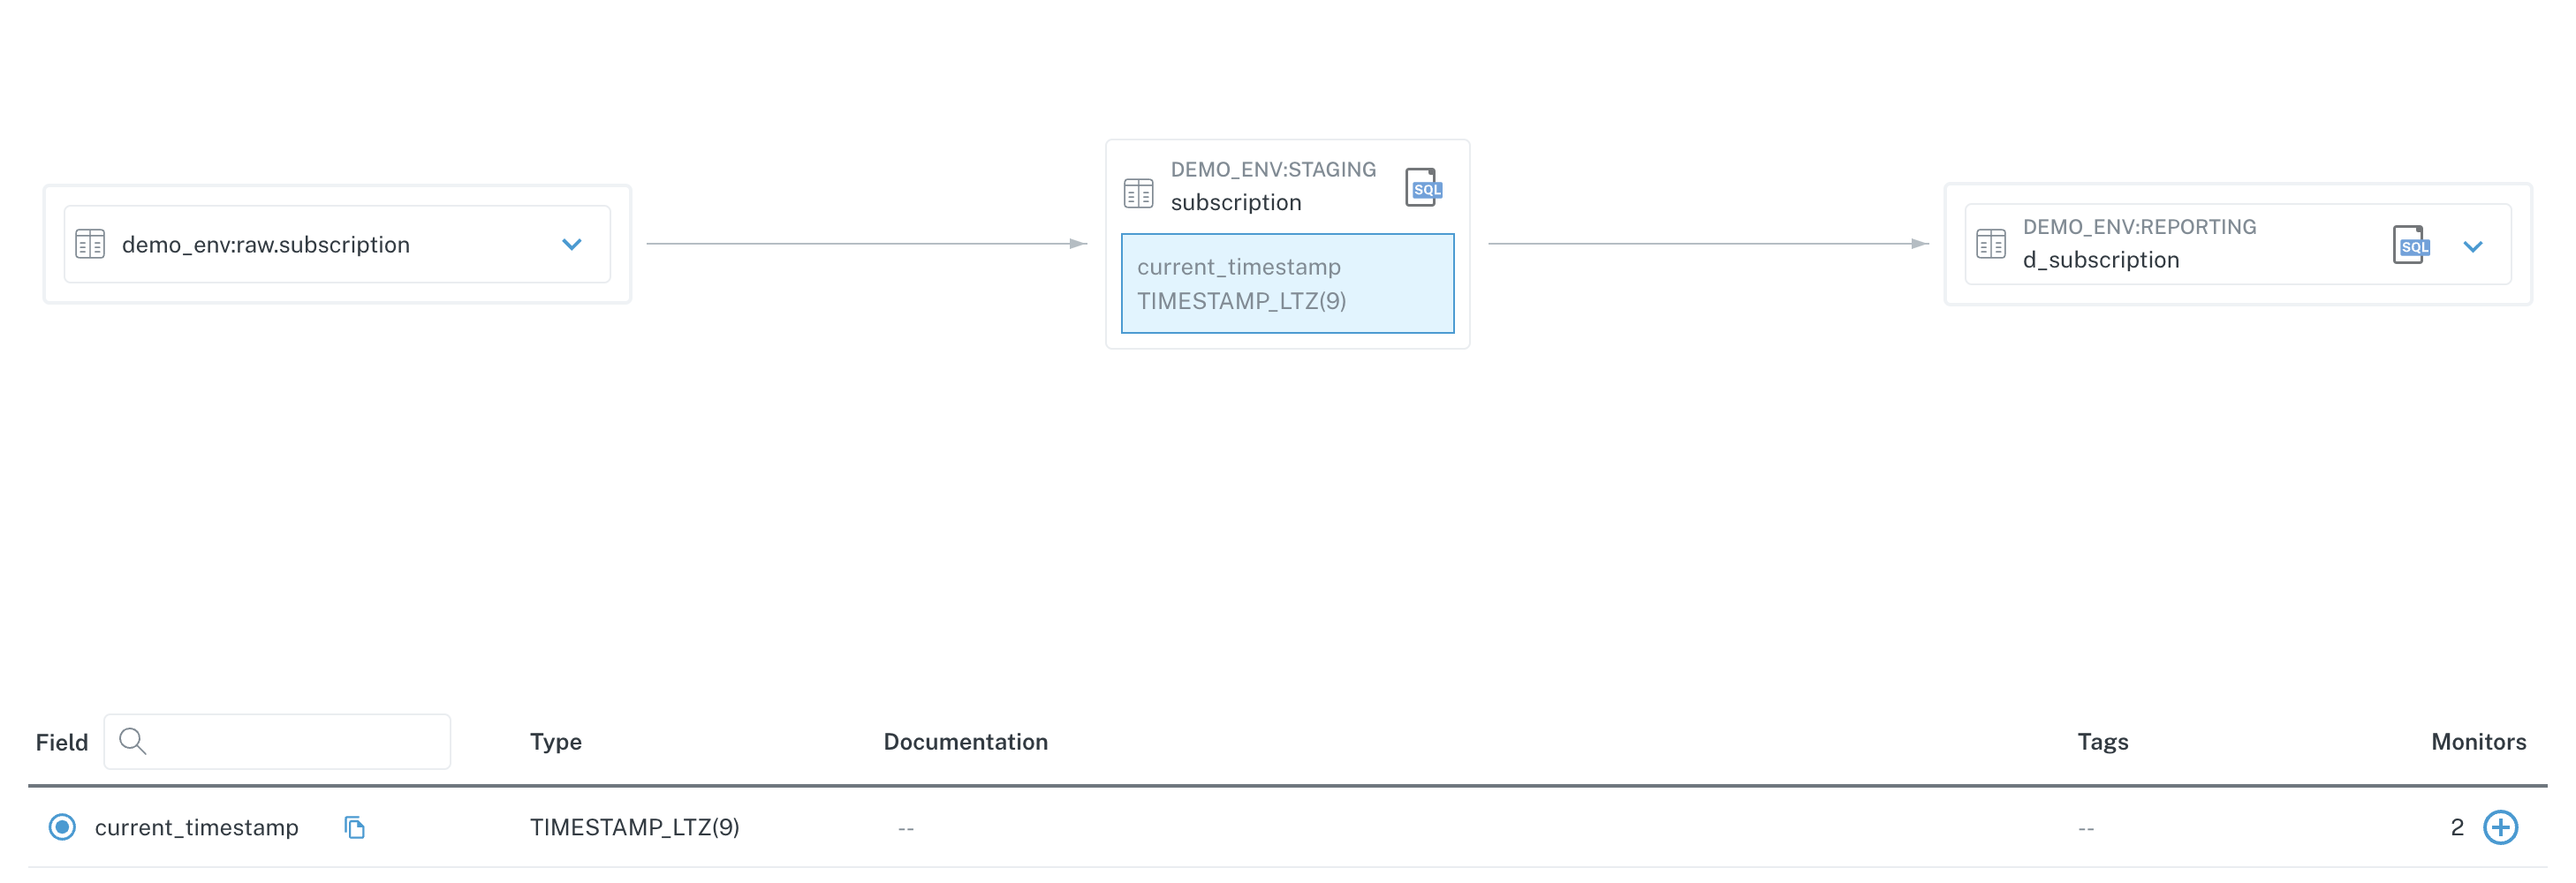
Field Lineage
You can also see if any Field Health monitors are set up on any fields on this data asset. Hovering over the number of monitors, if any, will reveal information about the monitors configured.
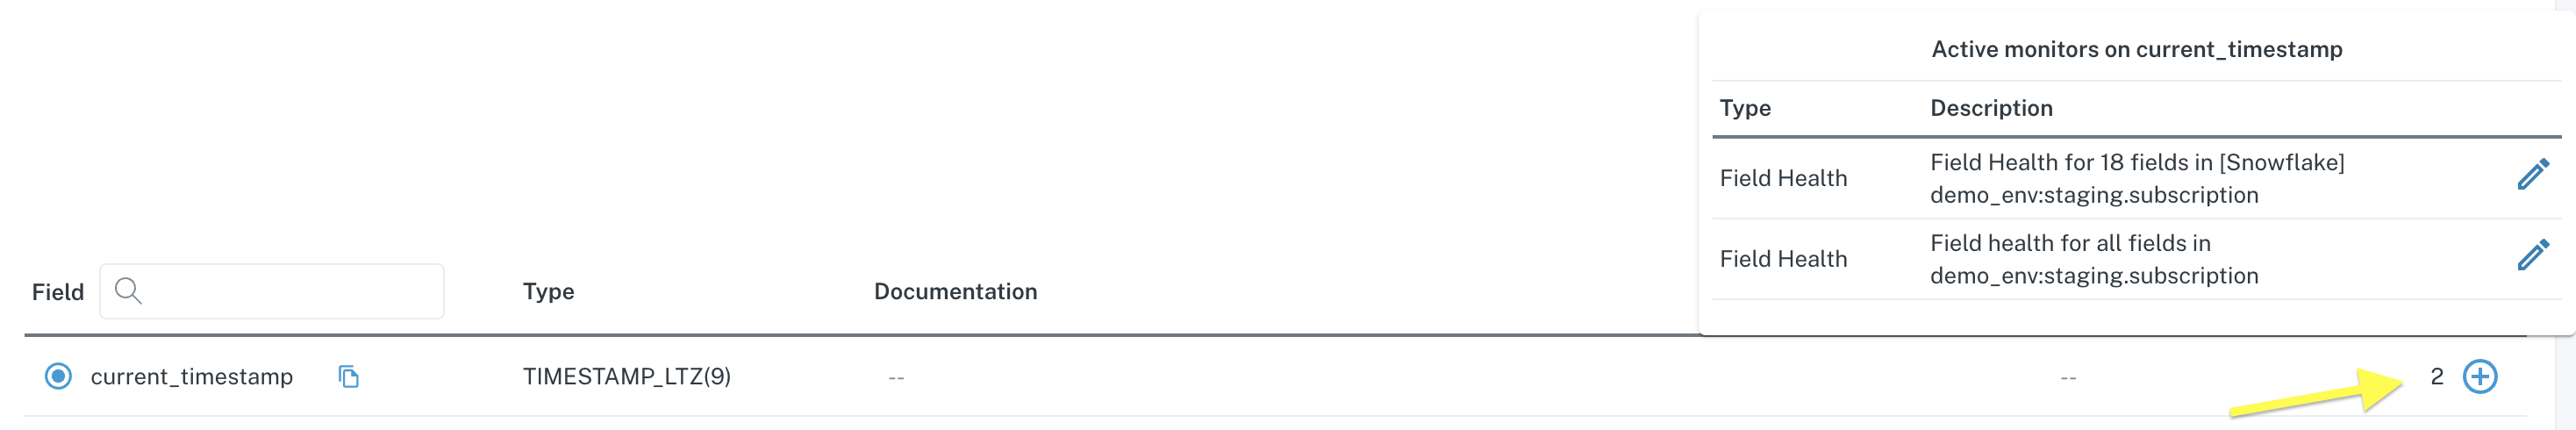
View Field Health Monitors from Field Lineage
Clicking the plus icon allows you to easily create a Field Quality Rule on the corresponding field.
Query Logs
The Query Logs menu is where you will find queries on the data asset, including updates (writes), queries (reads), and DB users who have executed queries.
Each of these can be found within their respective tab at the top of the Query Logs window.
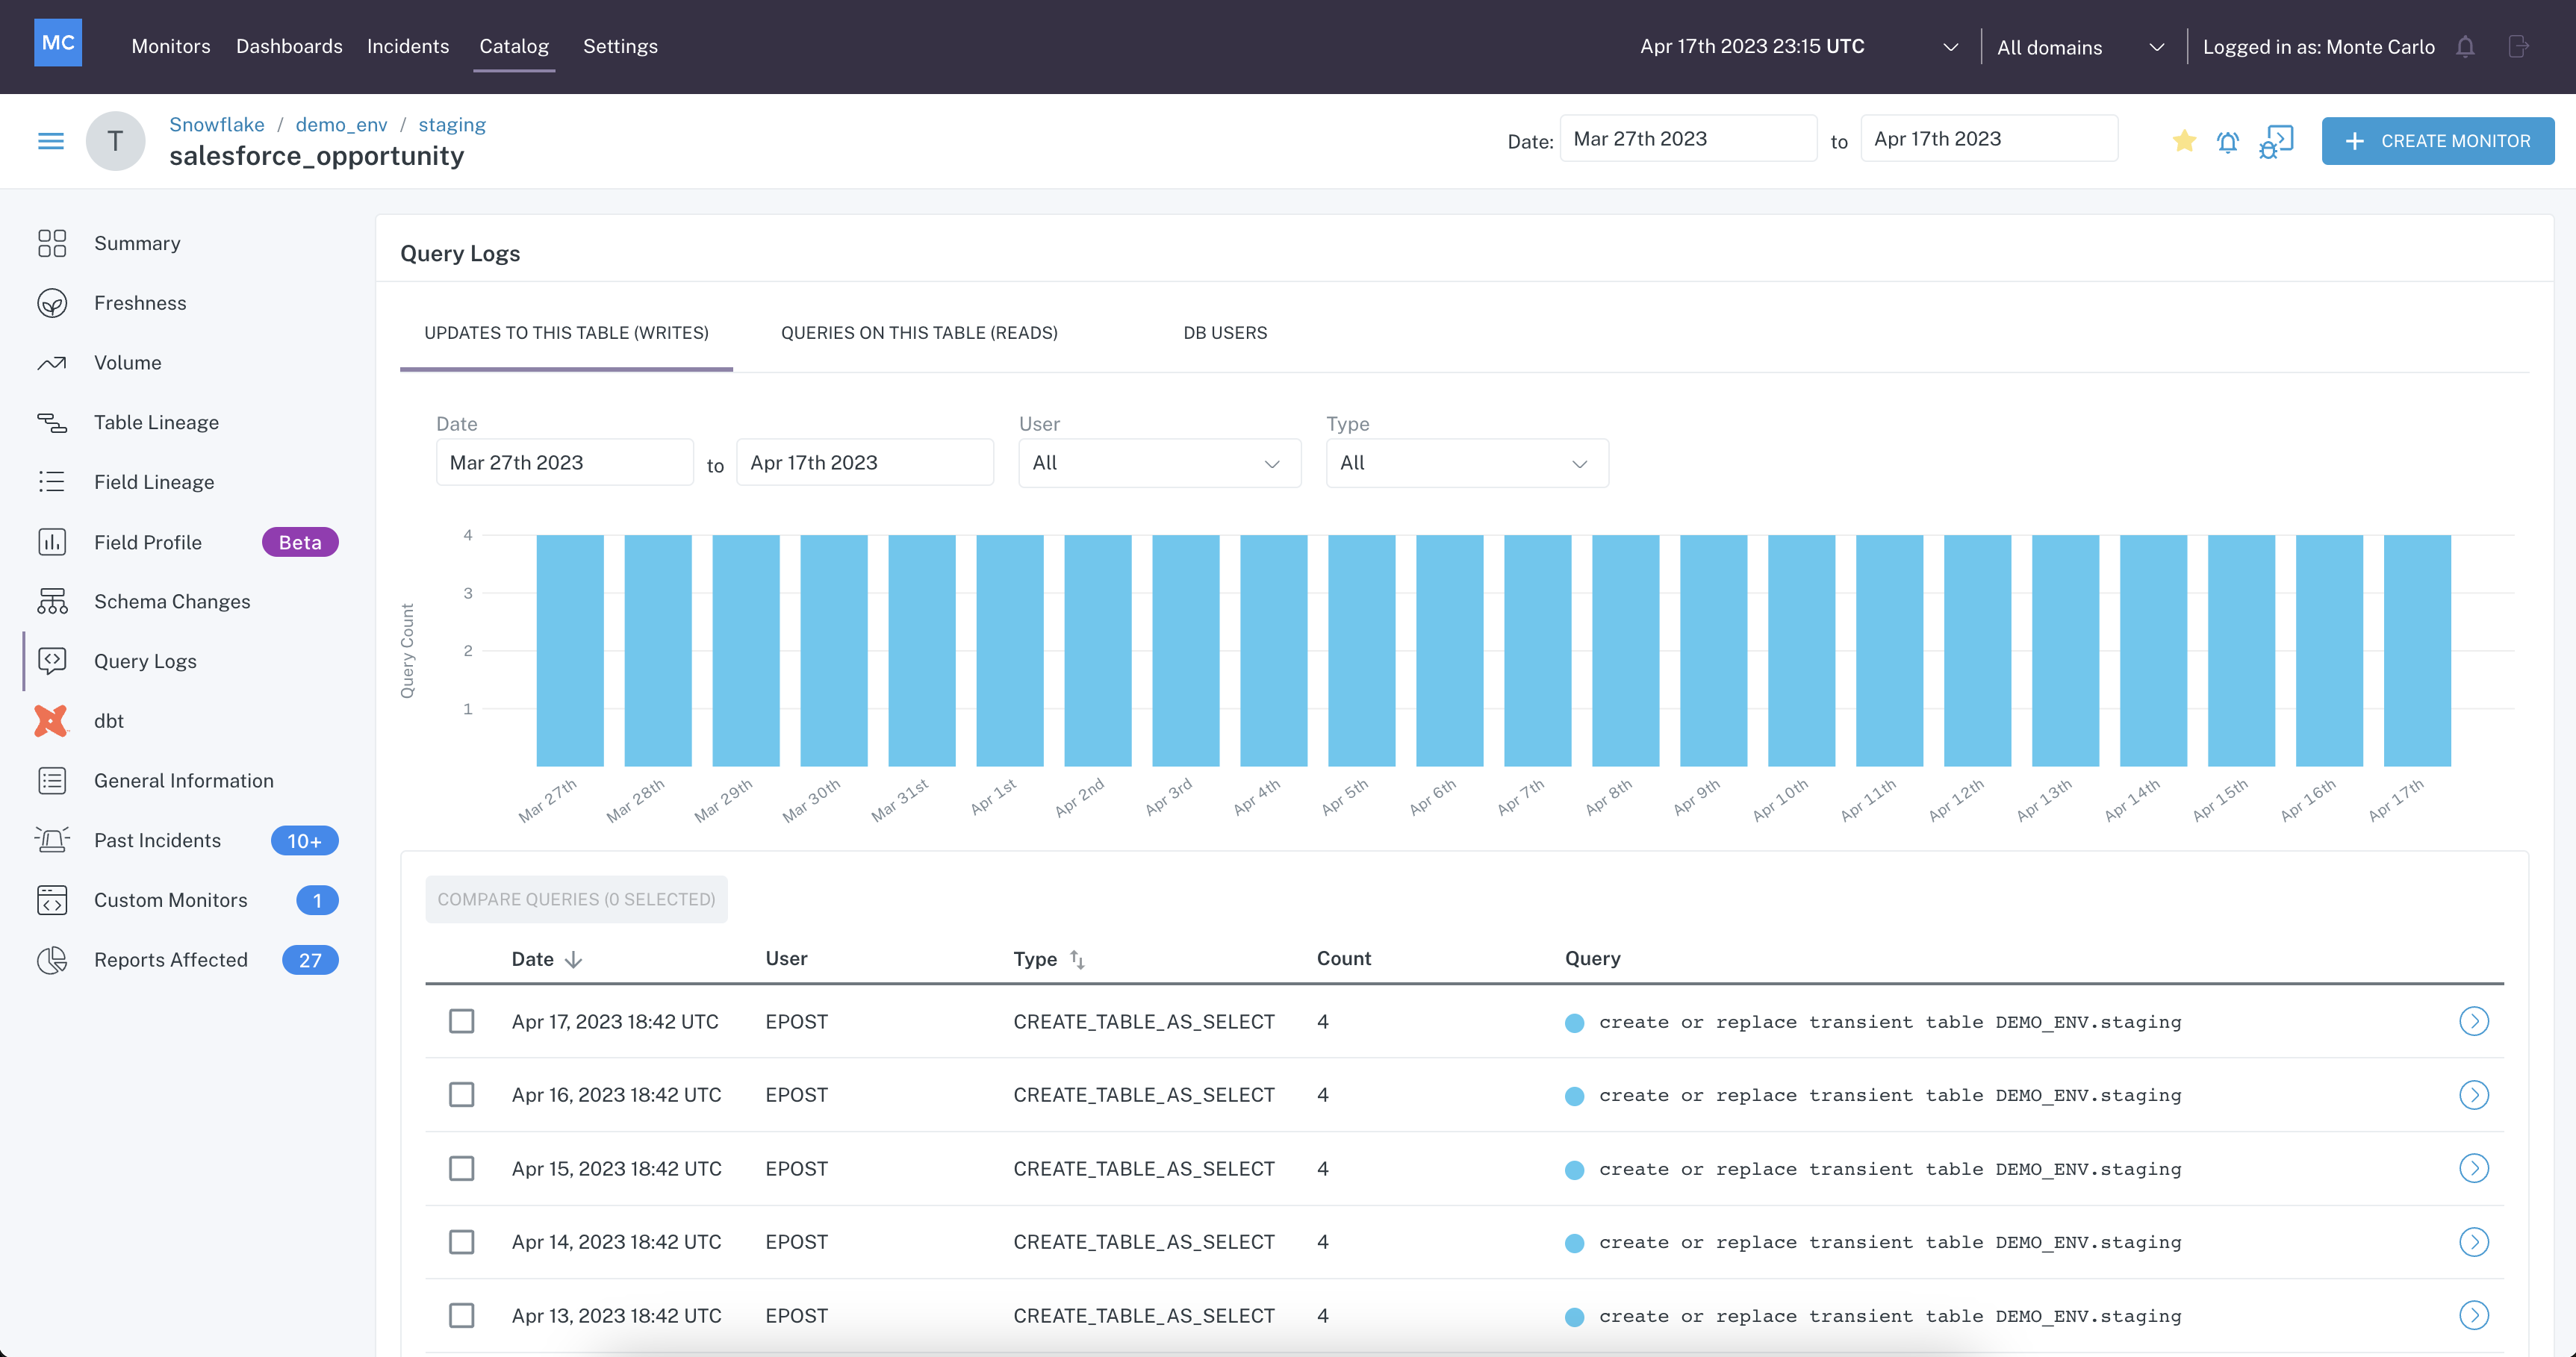
Query Logs
Updates to this table (Writes)
On the first tab, Updates to this table, a graph is shown which represents the number of queries per day that resulted in Writes.
Below the graph is a list of queries executed on the table that resulted in a Write operation. Clicking on an item in the list opens a modal containing Query Details.
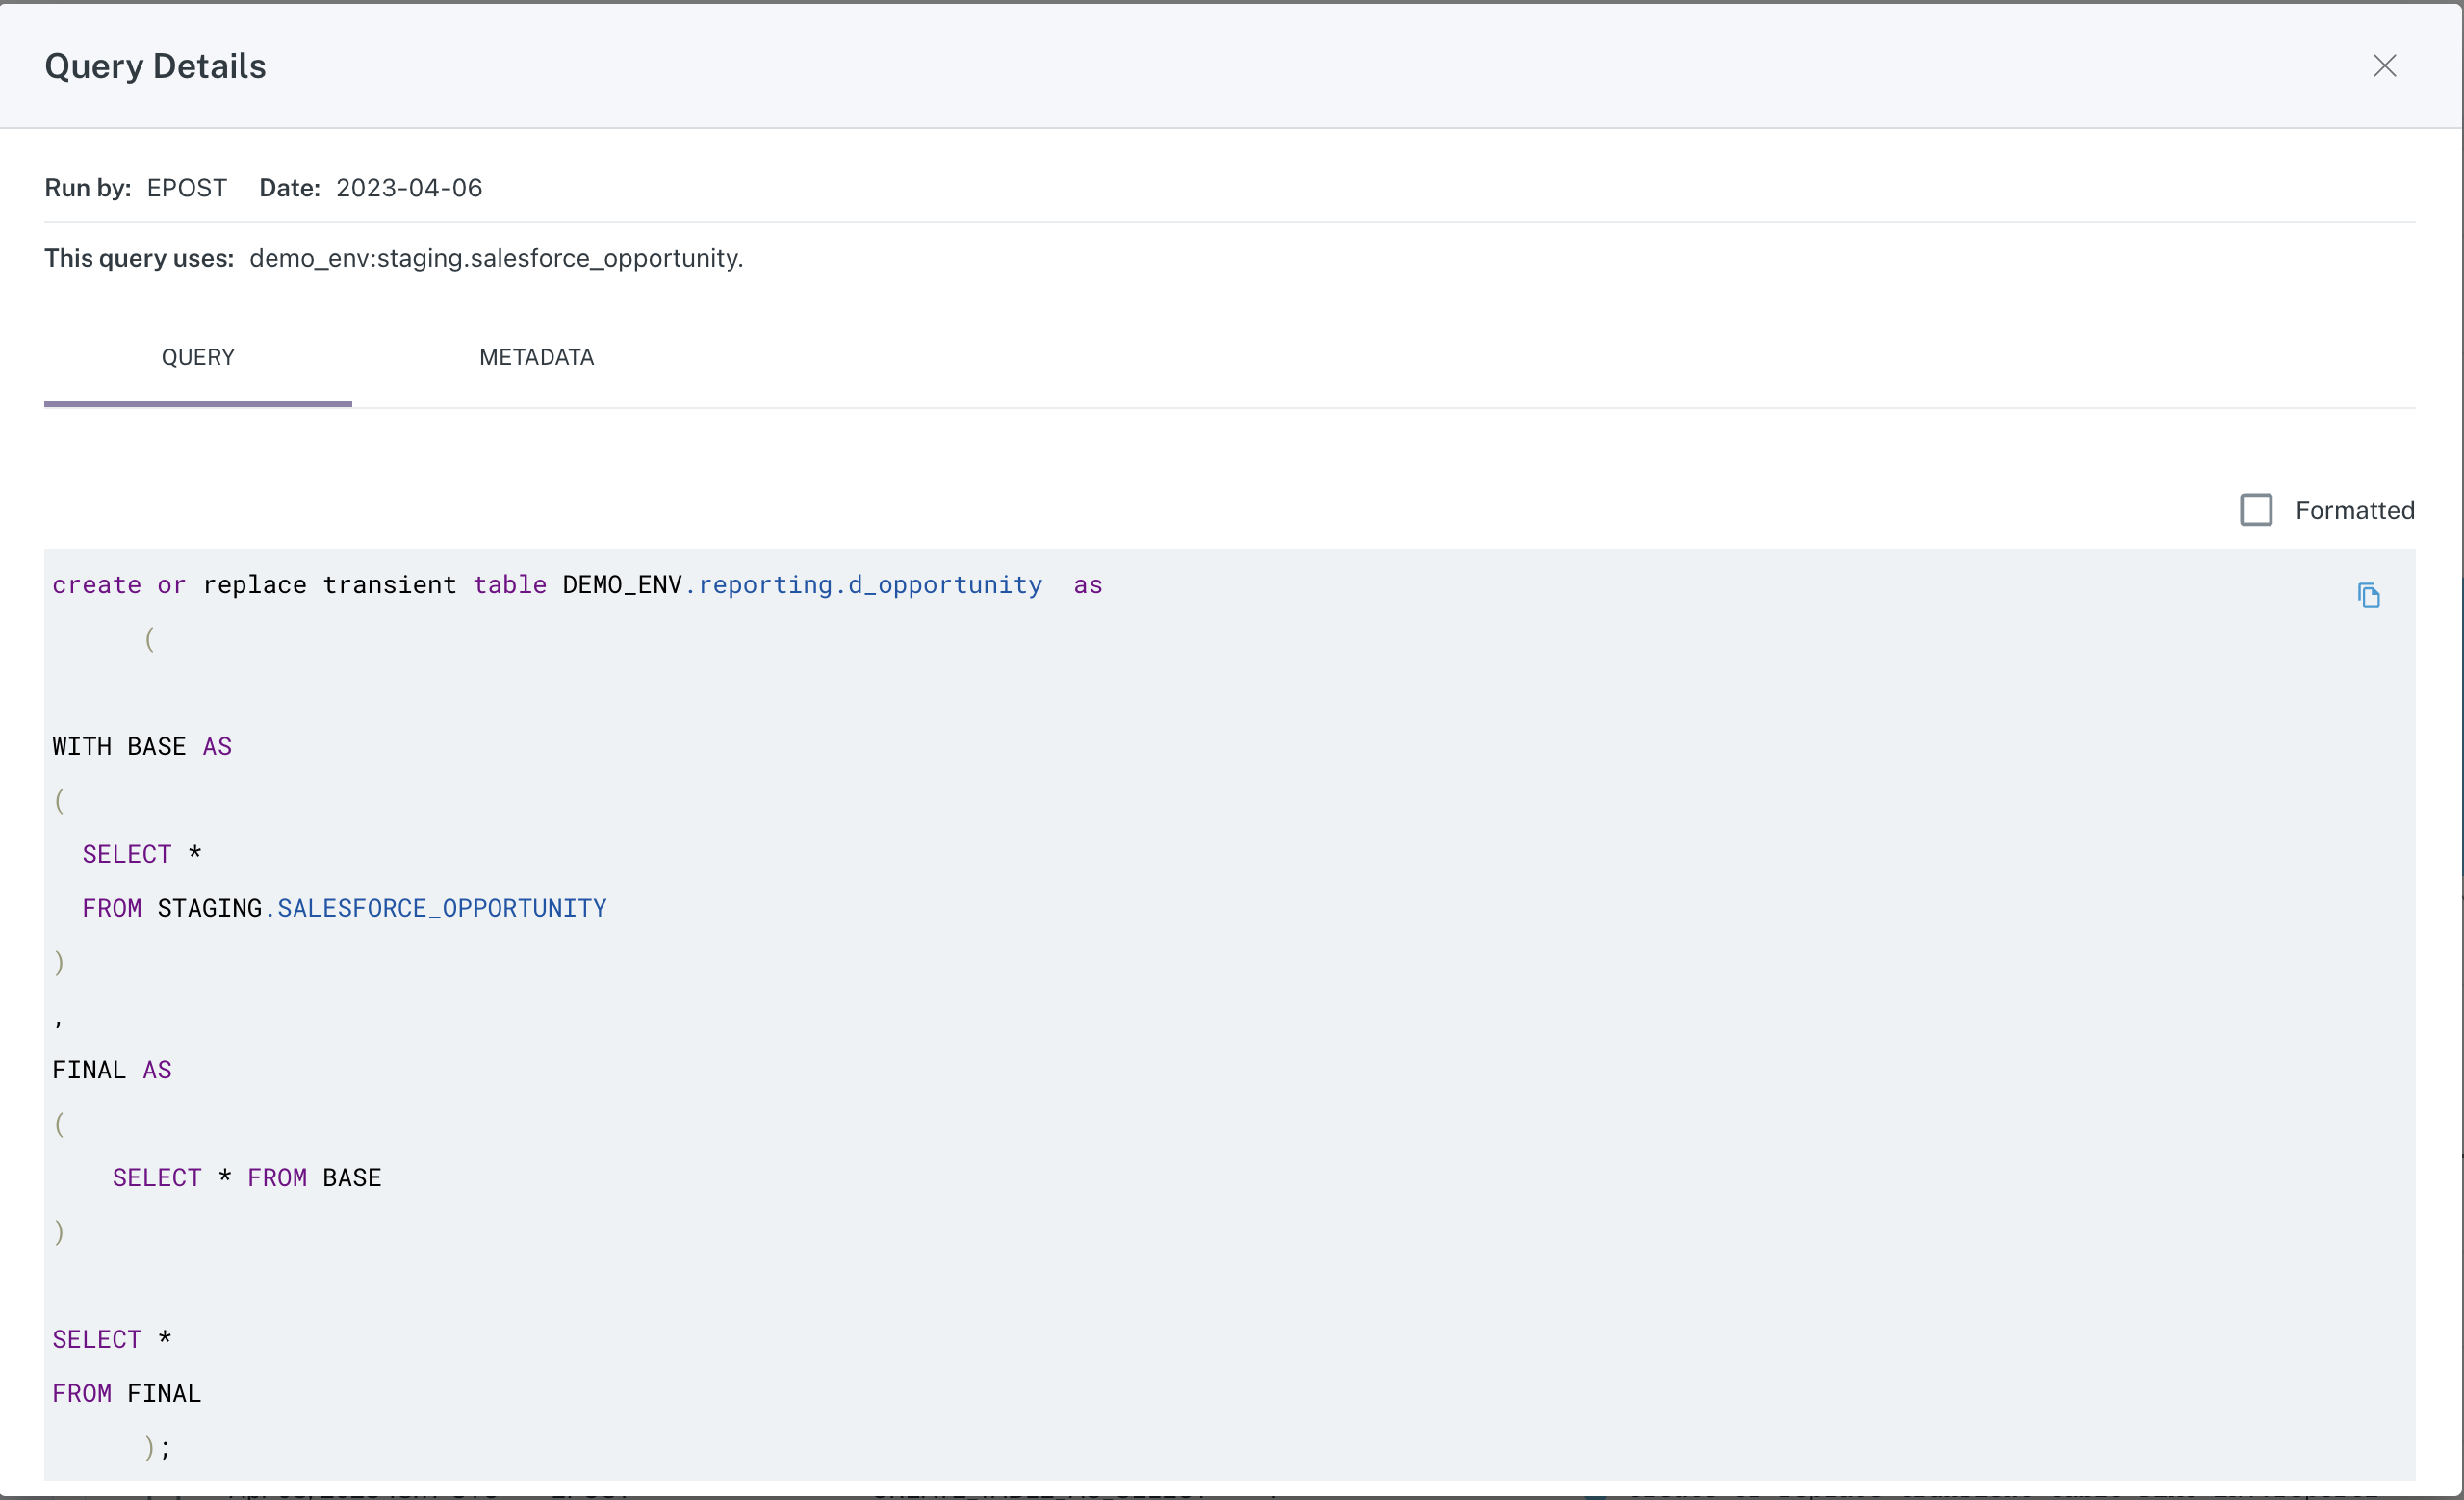
Query tab of Query Details modal
The second tab contains metadata for the query, including any error messages and information about what (if anything) was changed.
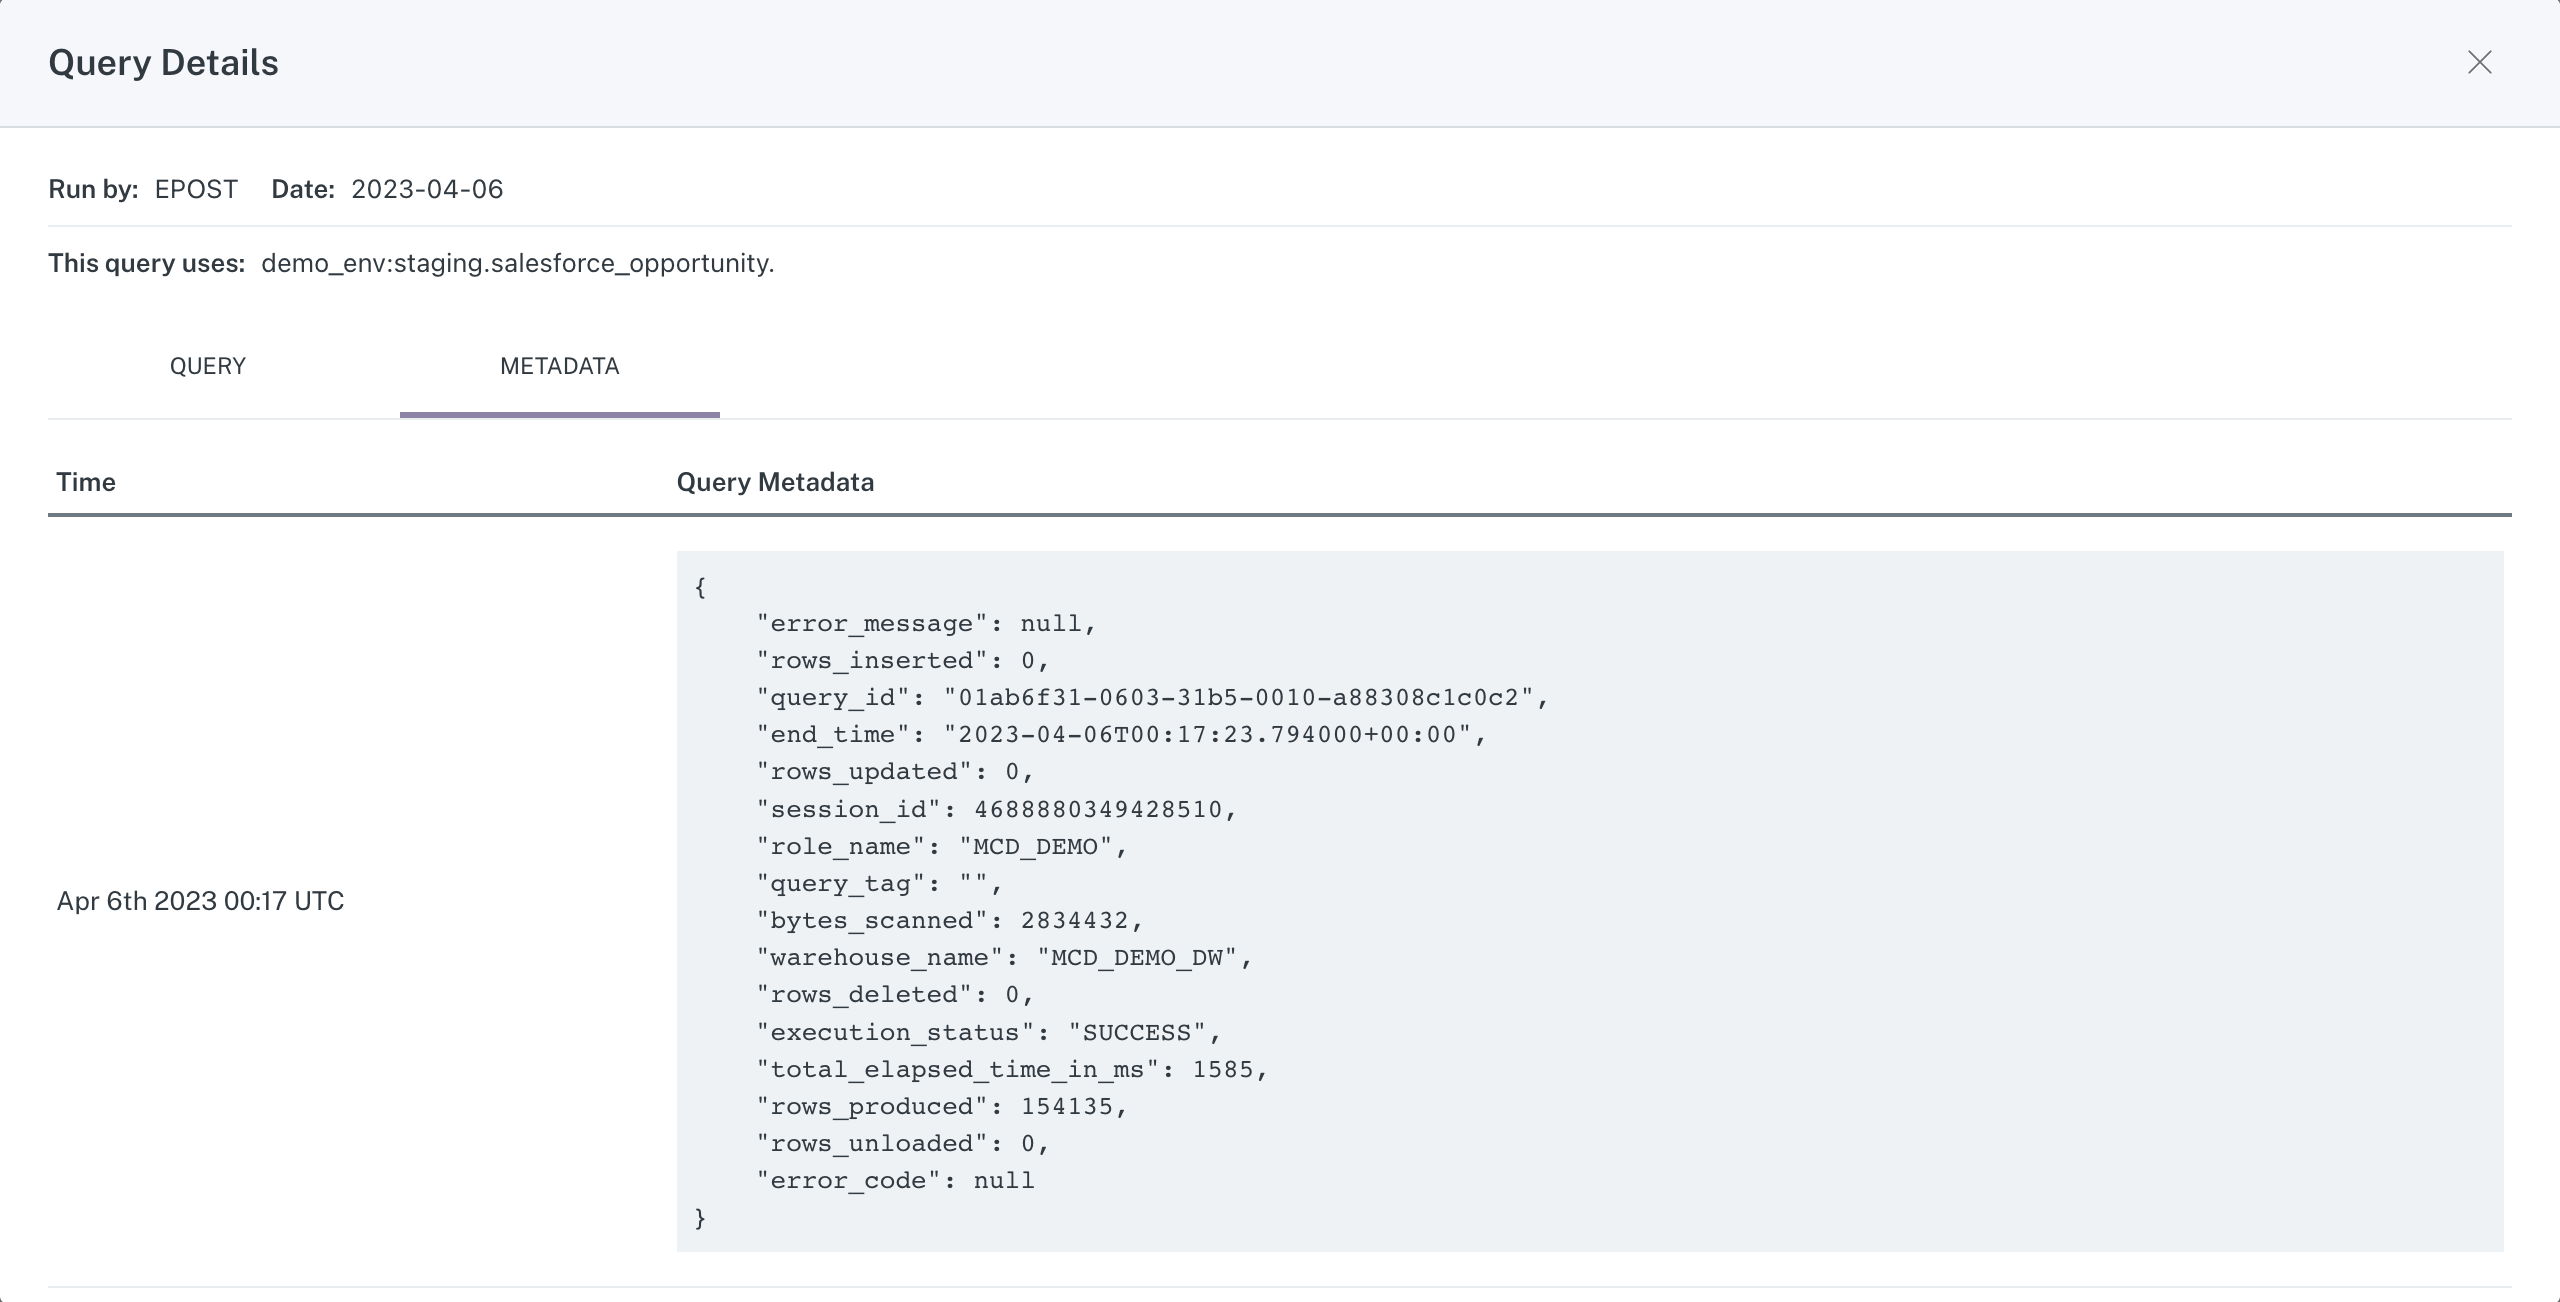
Metadata tab of Query Details modal
Queries on this table (Reads)
On the second tab, Queries to this table, is a list of queries executed on the table that resulted in a Read operation.
Similar to above, clicking on an item in the list opens a modal containing the Query Details, including the full query and the associated metadata.
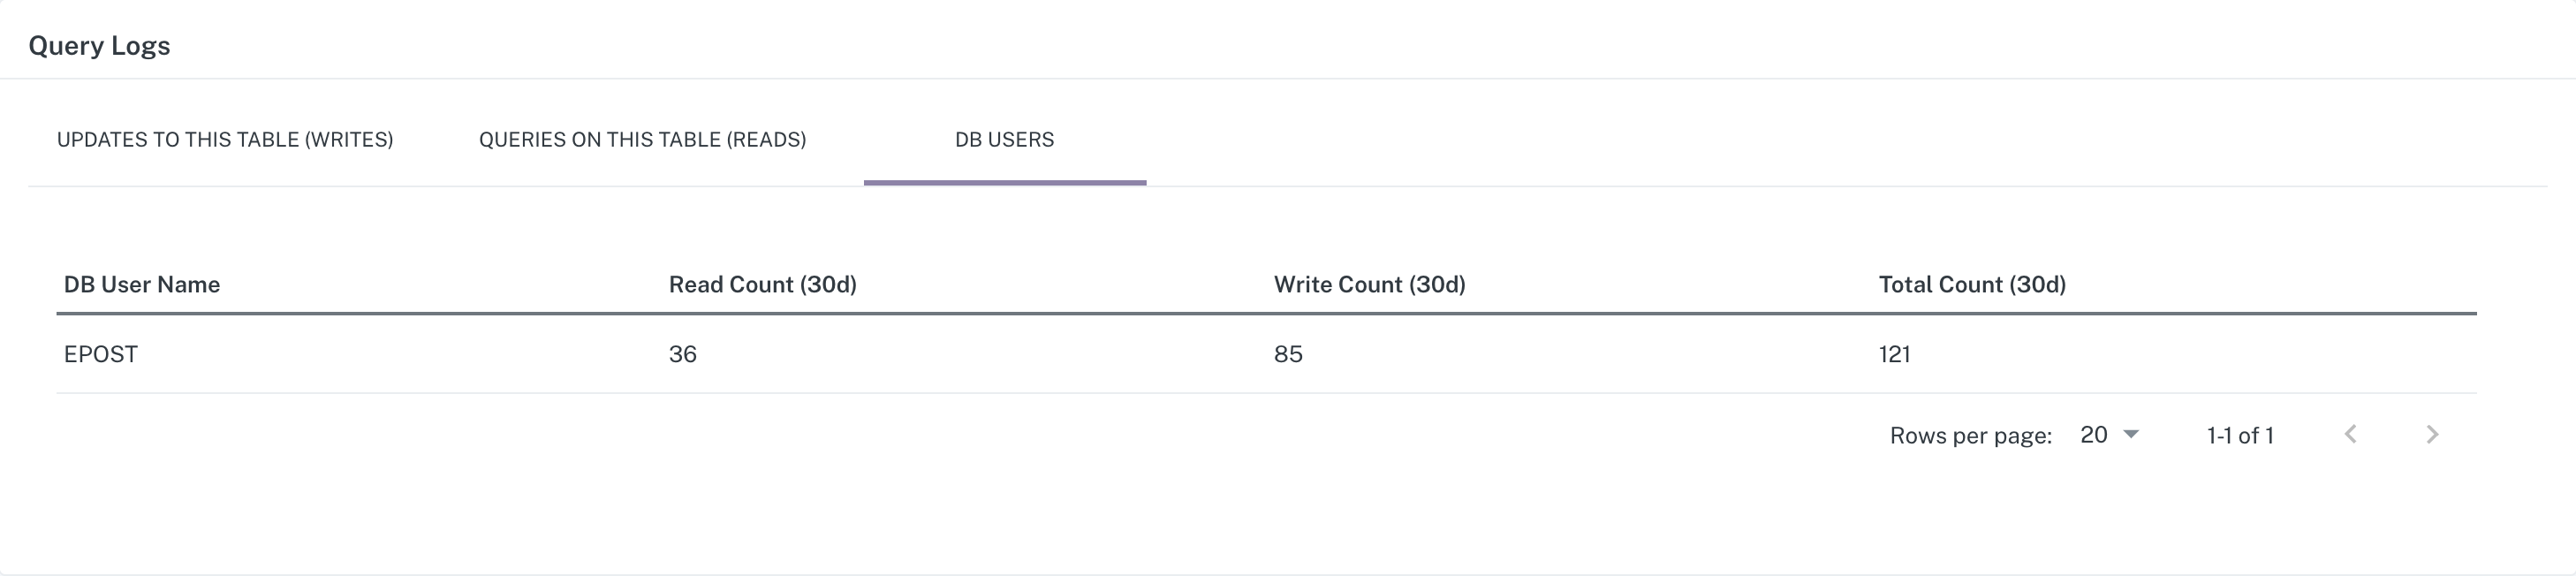
DB Users
On the third tab, DB Users, is a list of users who have executed queries against the table as well as the Read/Write/Total counts of queries over the last 30 days.
Comparing queries
It is easy to compare two queries from both query tabs within the Query Logs menu. From either tab, simply select the two queries you wish to compare and click the Compare Queries button.
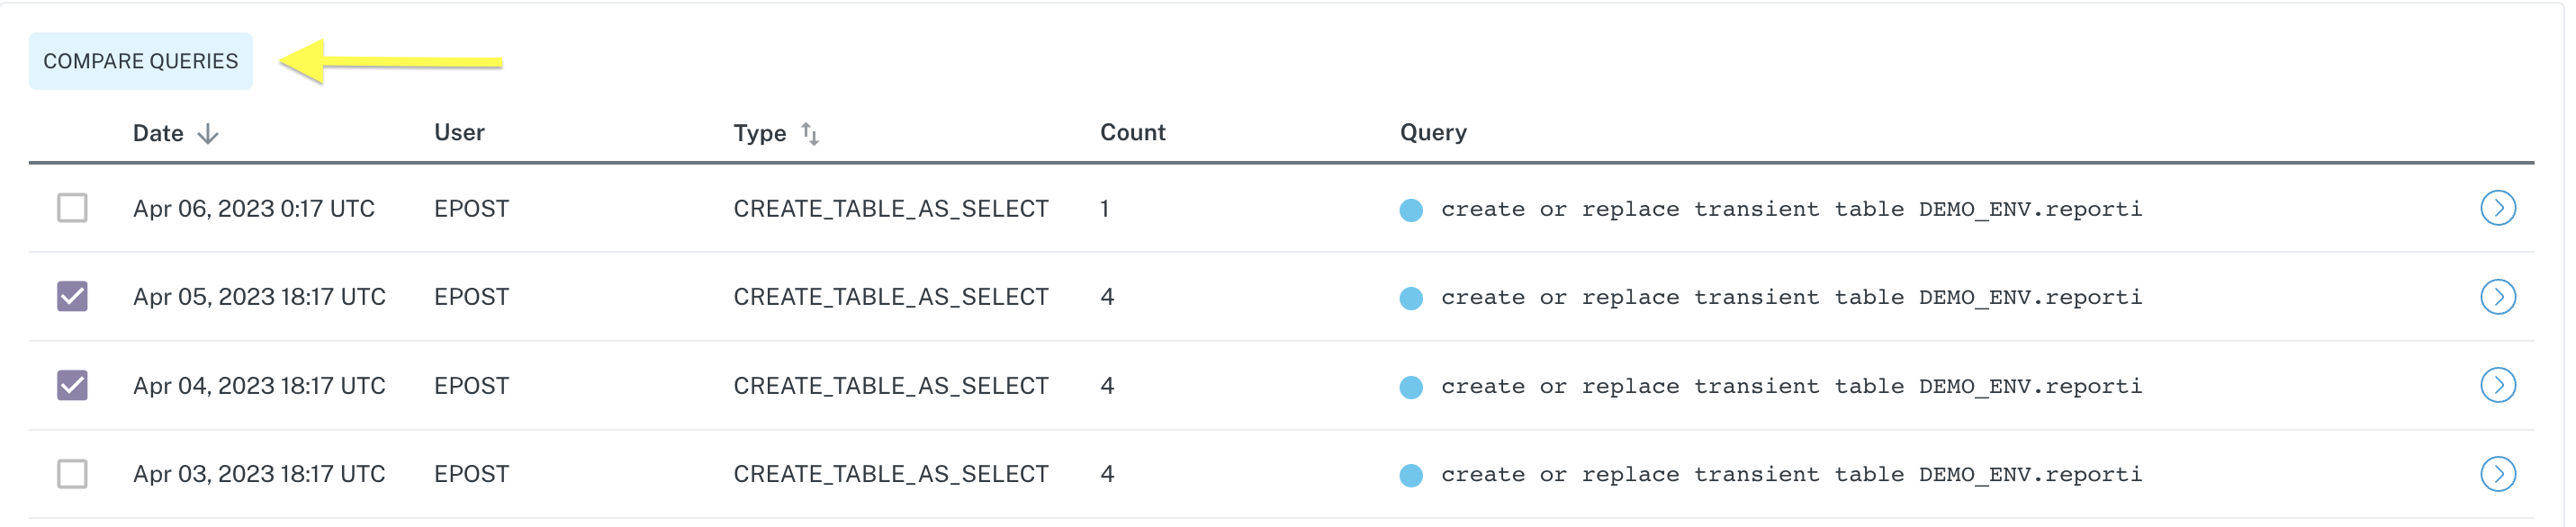
Select queries to compare
Upon clicking, a modal opens containing a diff of the two queries.
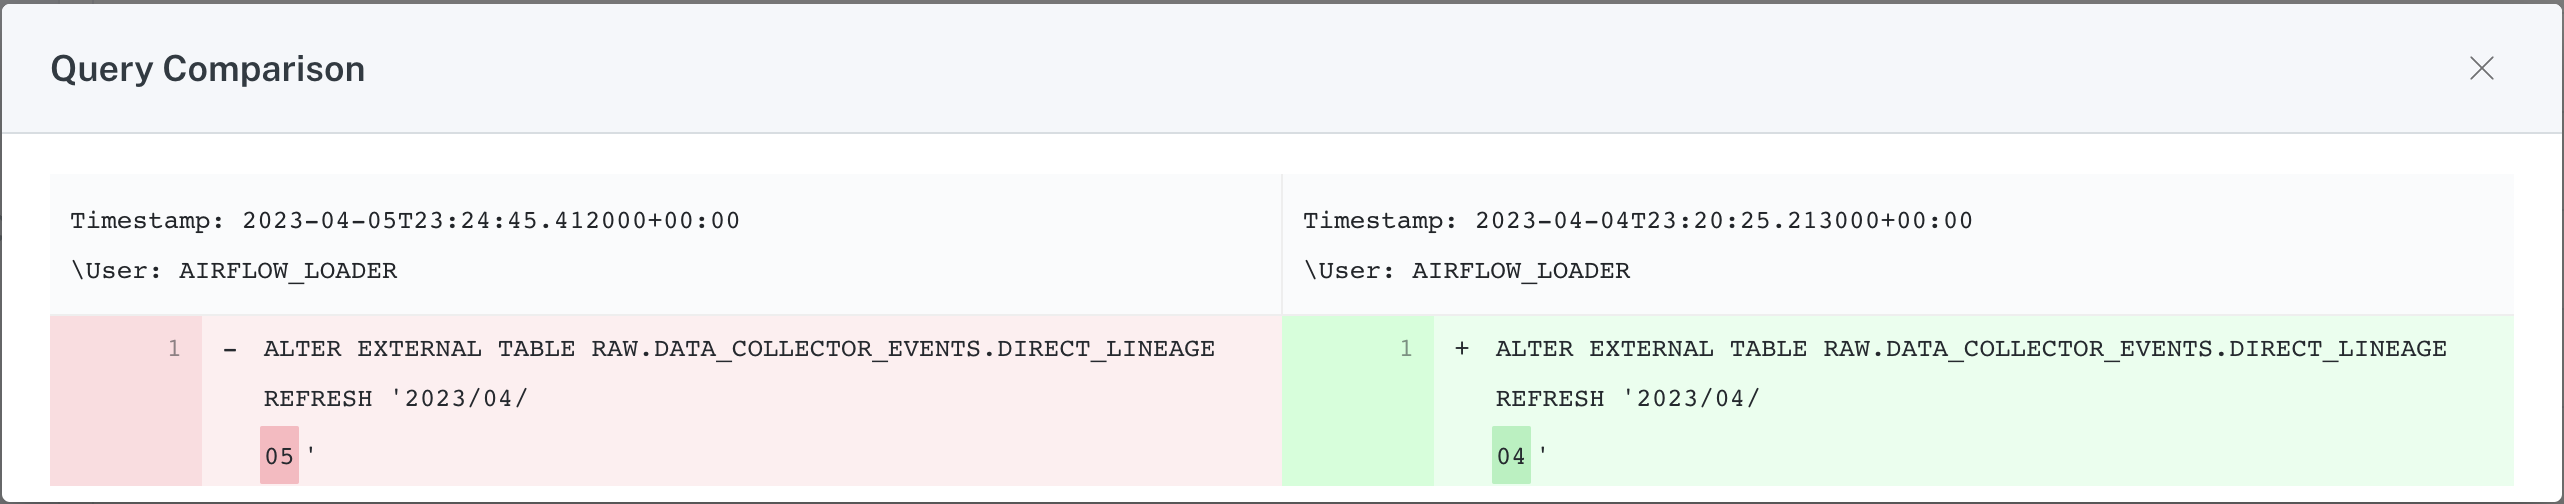
Query diff
Alerts
You may use Assets to review current or past alerts, and to see what reports may be affected by alerts on the data asset you are reviewing.
Past Alerts
Within the Past Alerts tab of an Assets page, you can quickly see what alerts have been raised for a data asset.
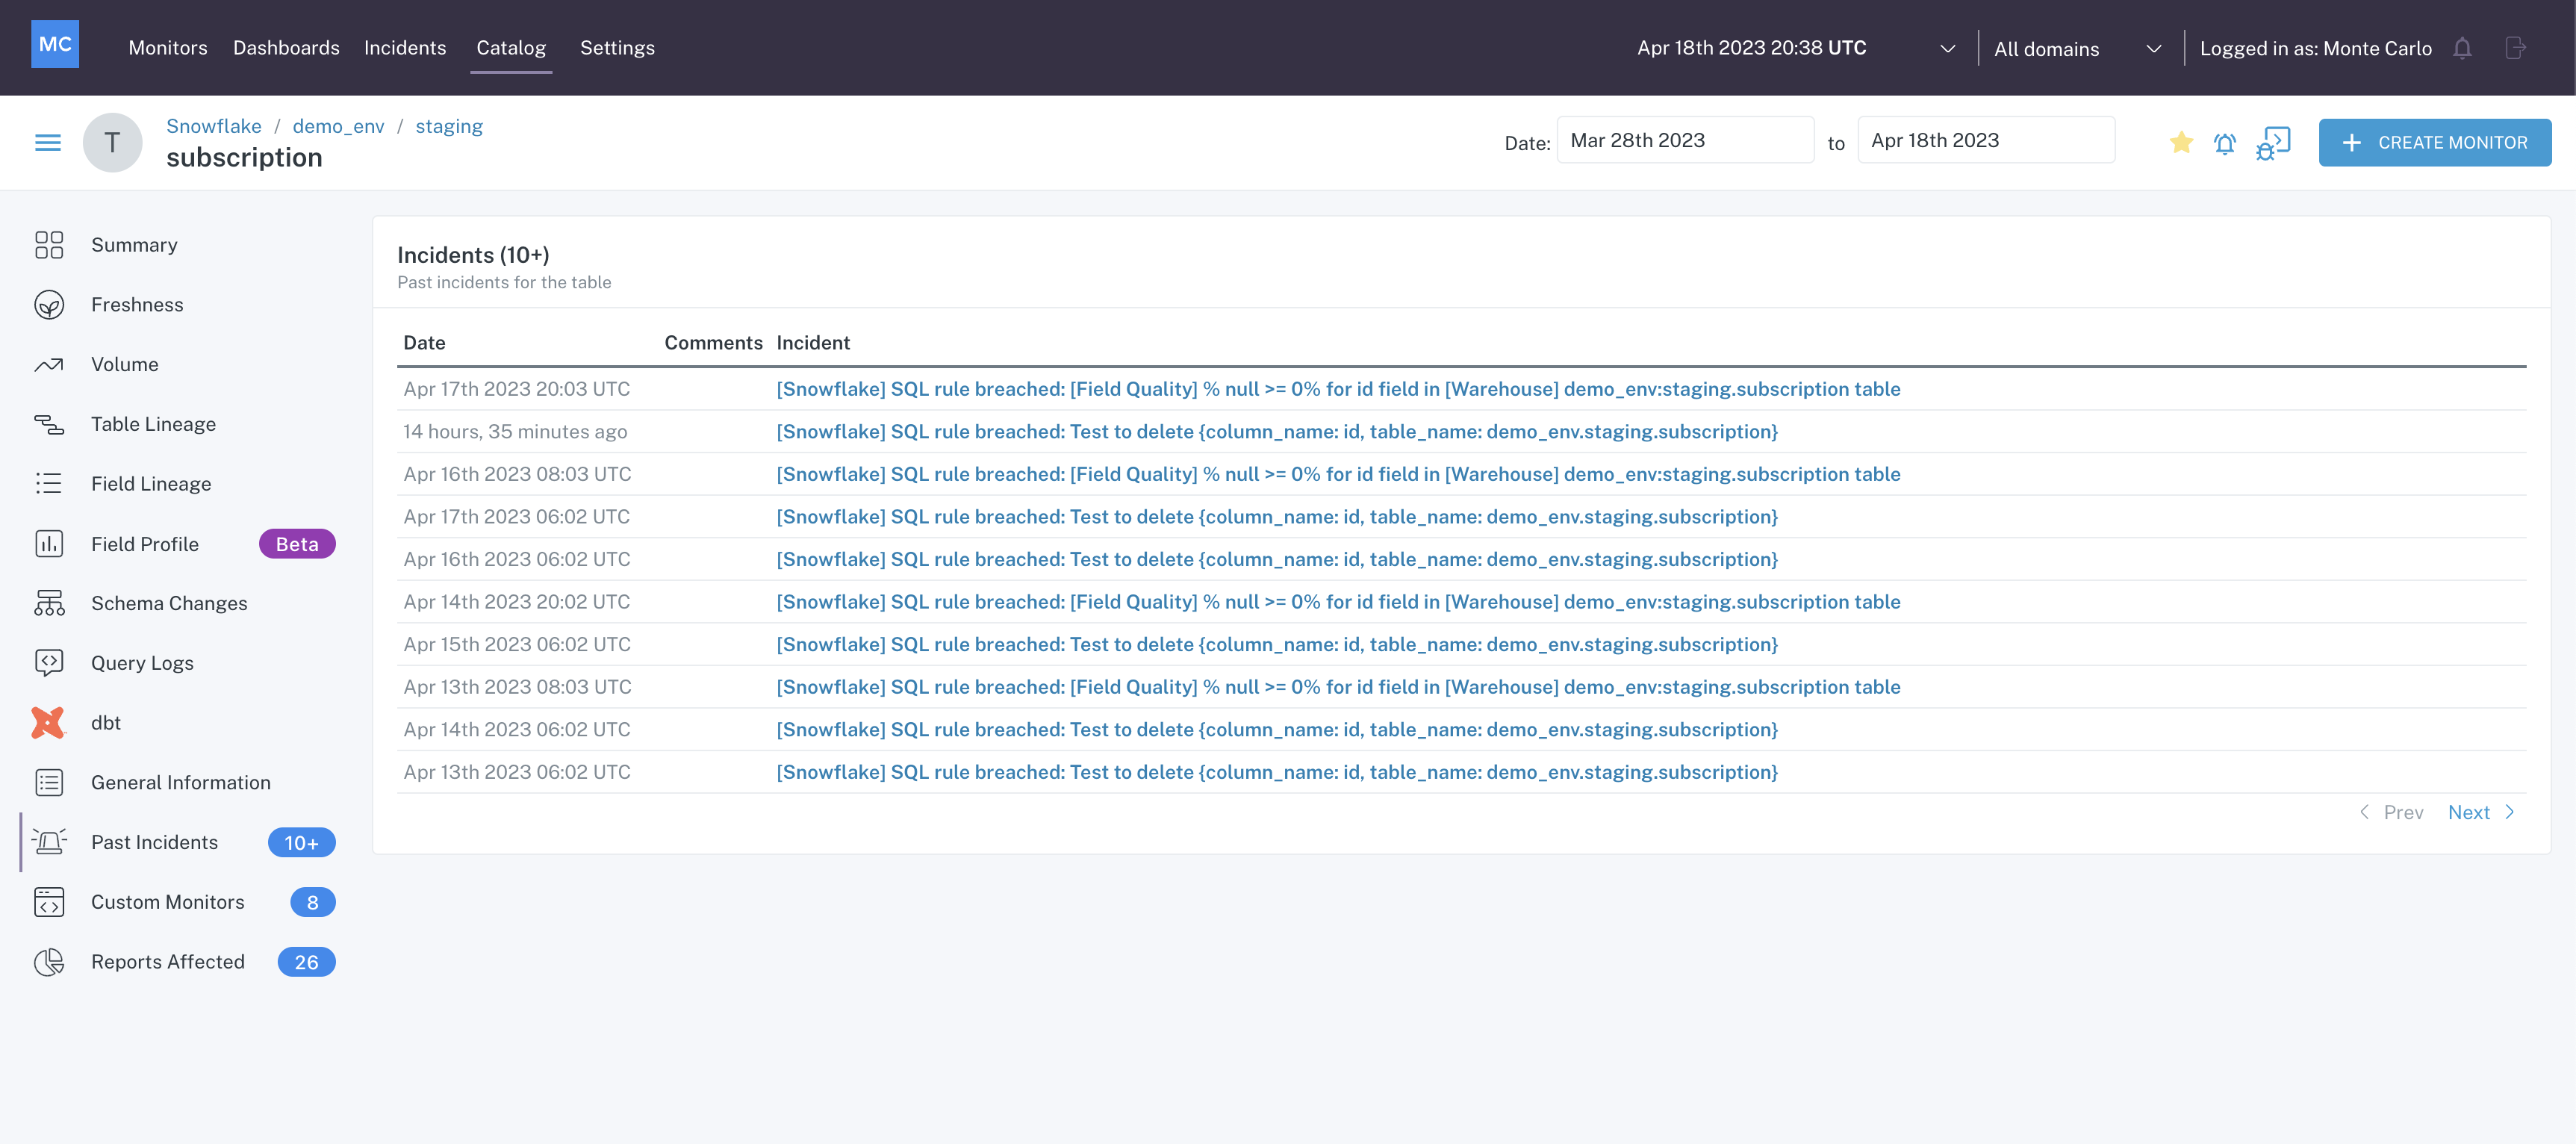
Past Alerts
Click on any of the alerts in the table to be taken to the Alert IQ page for that alert.
Reports Affected
Within the Reports Affected tab of an Assets page, you can see any BI reports that use this data asset.
This view provides a list of Reports that are downstream of the data asset you are reviewing.. Each item in the list contains details about a report that may be impacted negatively by an alert related to the asset.
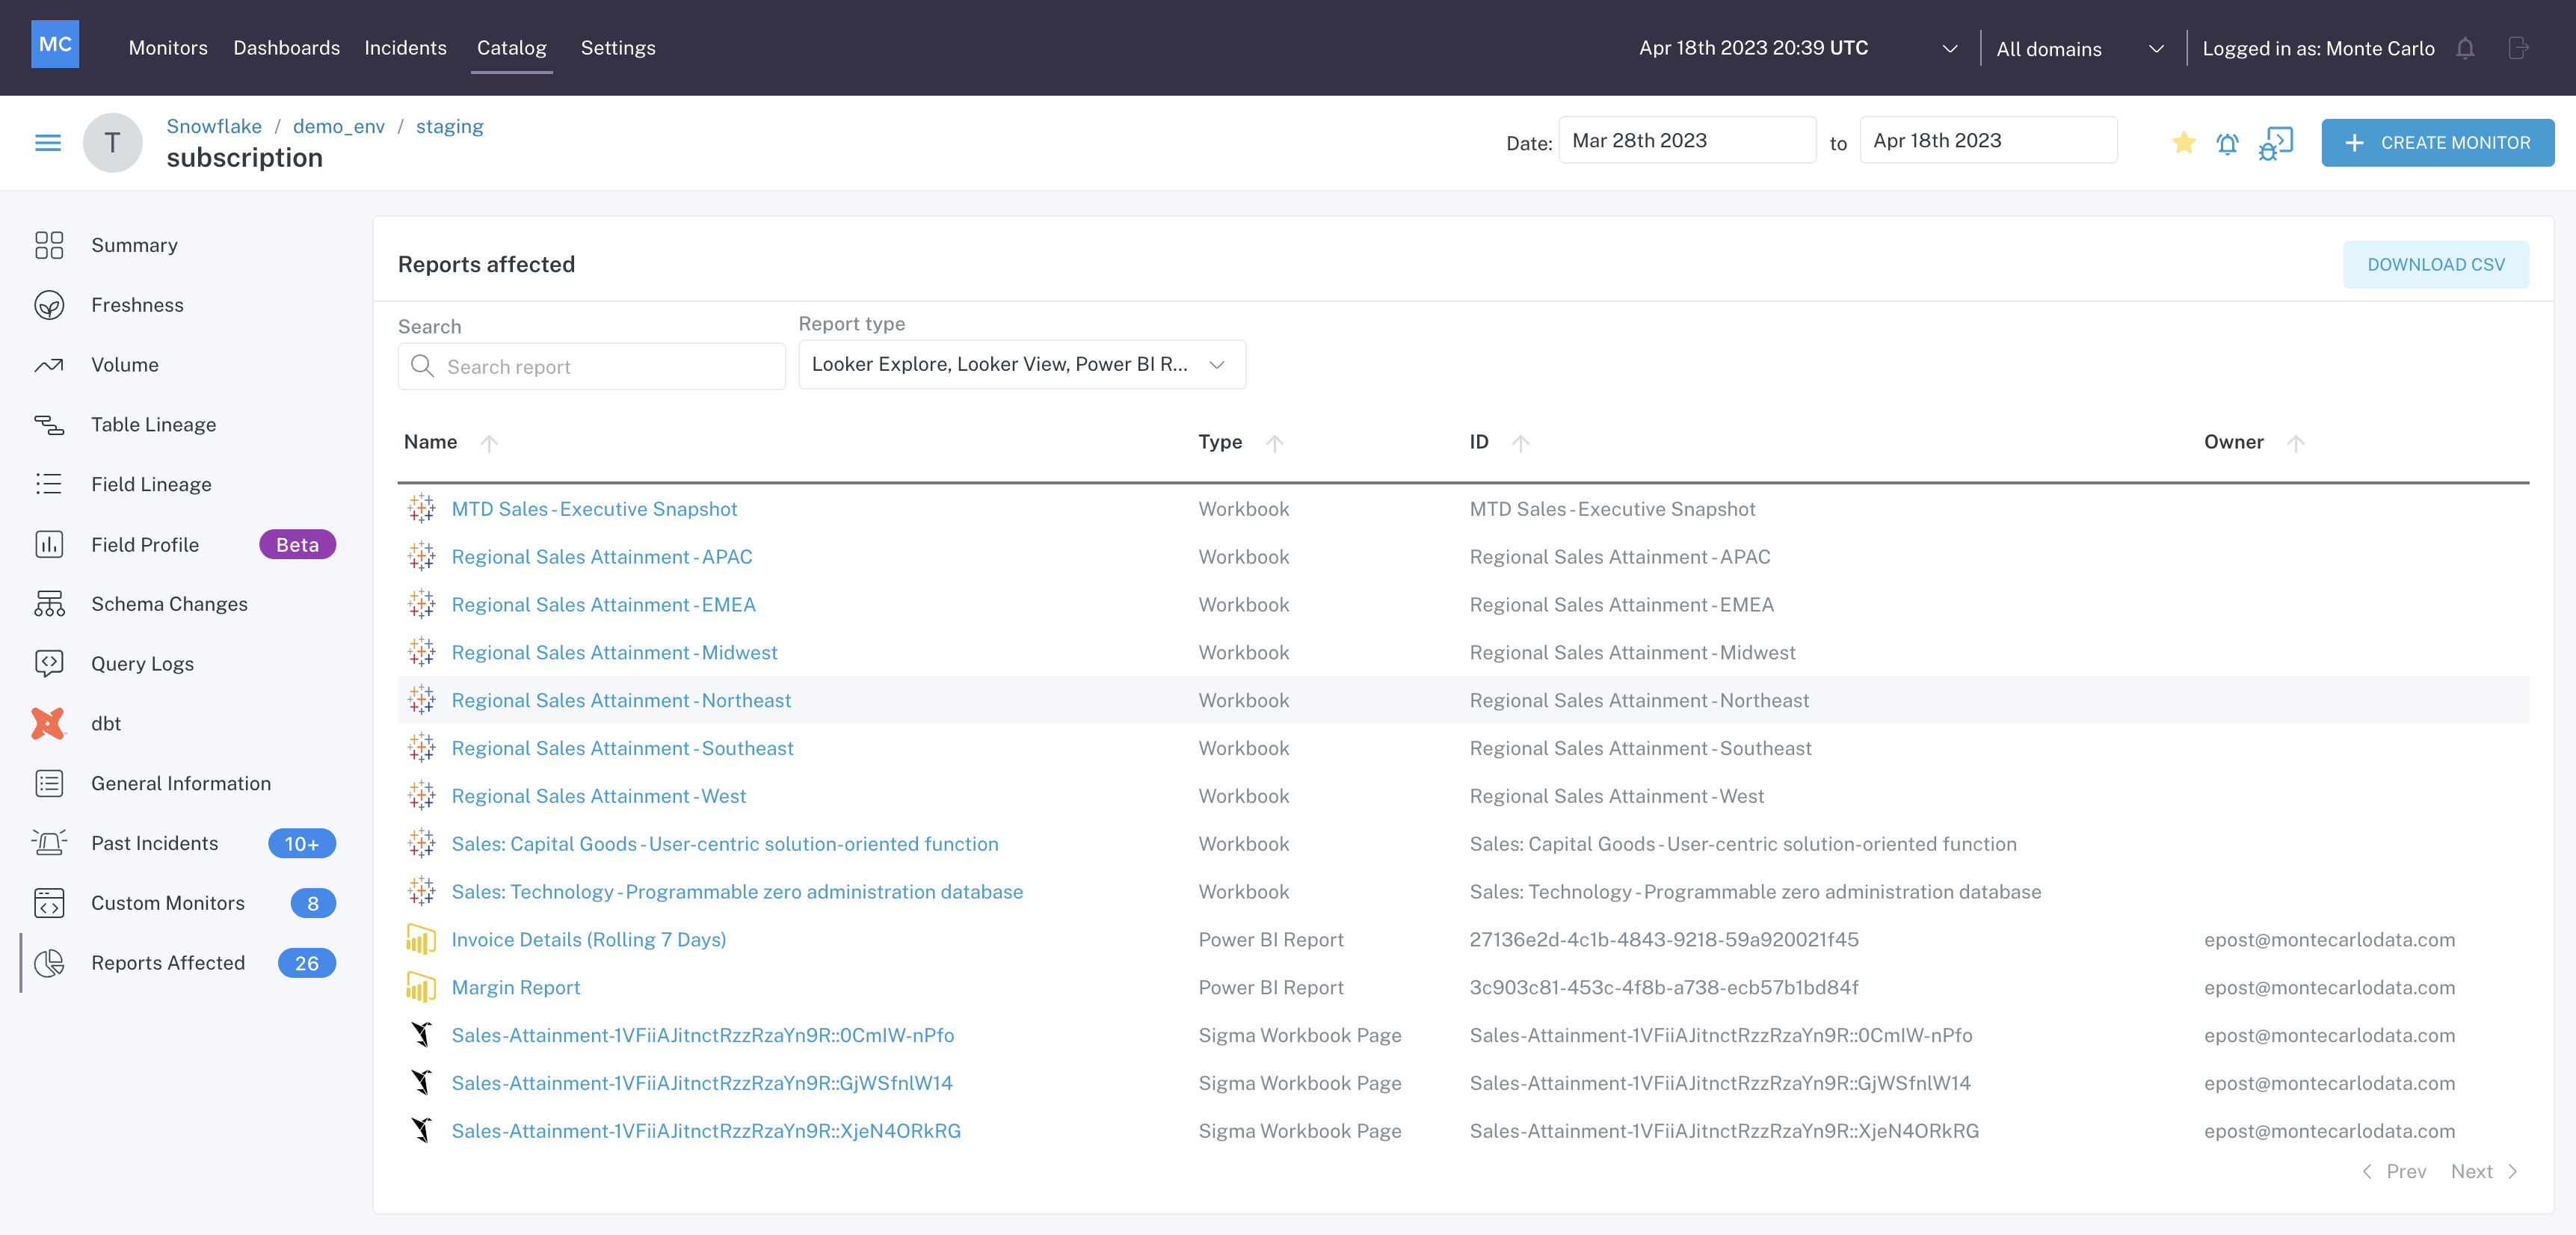
Reports Affected
Use the filters to search for a specific report, or to limit the report types displayed.
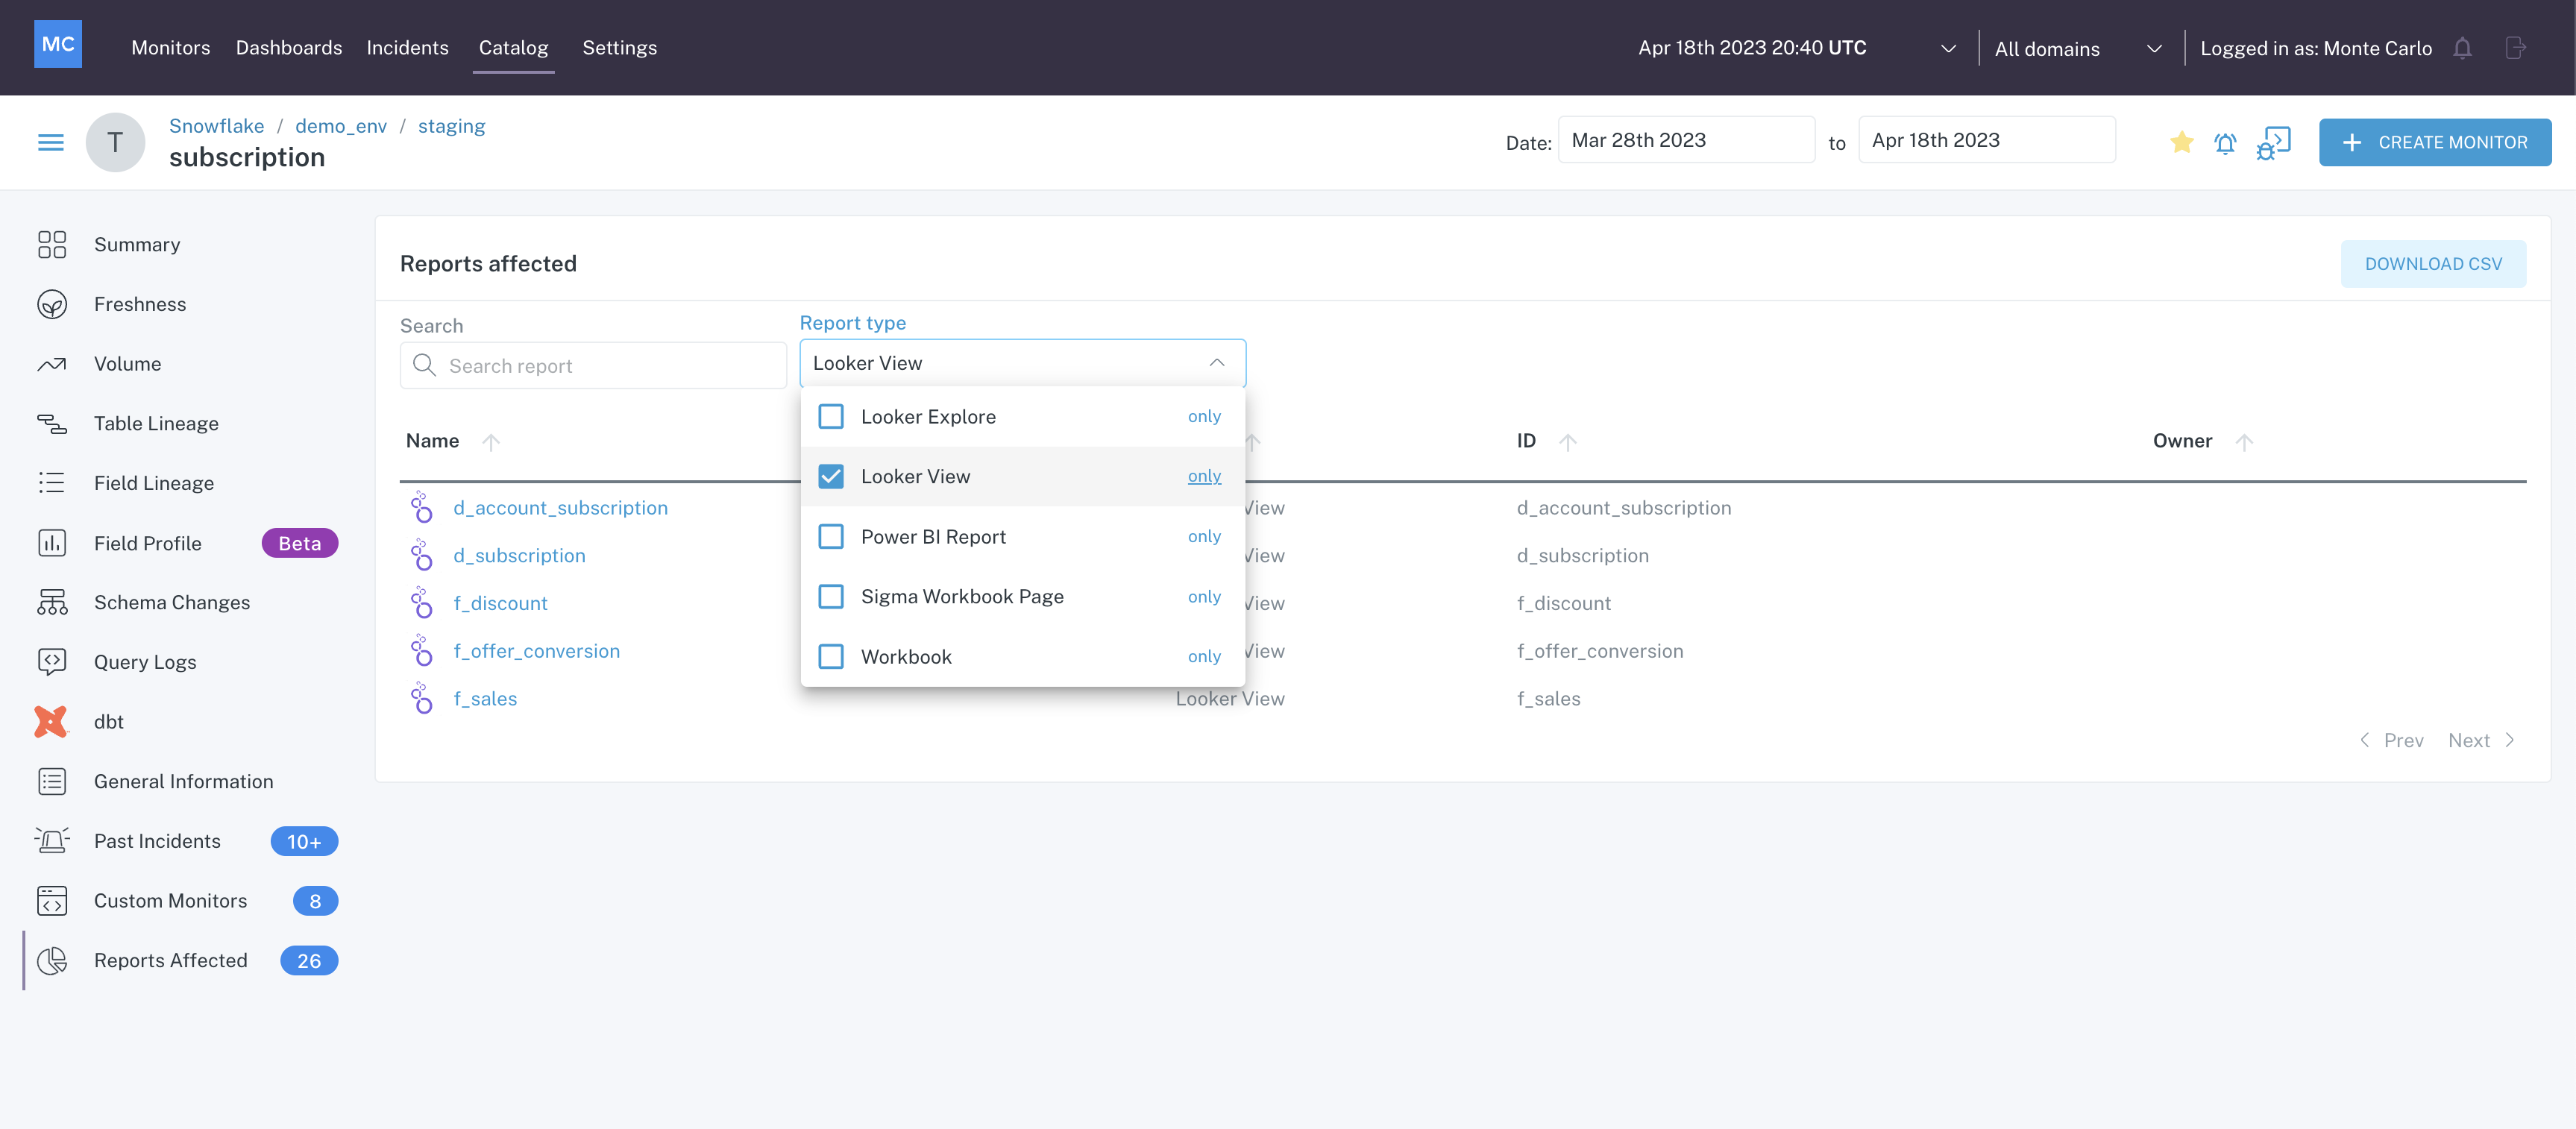
Reports Affected Filters
Clicking on any of the report names in the list will take you to the Assets page for that report.
Frequently Asked Questions
Does Monte Carlo import descriptions and tags from the warehouse to display in Monte Carlo?
Descriptions and tags can be imported from the warehouse to display in Monte Carlo. If a description has been manually entered into Monte Carlo, any description or comments that exist in the warehouse will be ignored. If you would like to enable this functionality, let us know!
We see that a detector is Inactive for one of our tables, why?
Detectors may become inactive if there is insufficient data flowing into the table in order for our machine learning models to train. Read more about it here.
How long does it take for nodes and edges in lineage to expire?
Query logs and metadata tables are used to build table and field lineage in Monte Carlo. Once nodes and edges are removed from metadata tables and query logs in your warehouse, they will expire in your Monte Carlo instance.
Updated 19 days ago