Agent Monitors Overview
Agent Observability capabilities, instrumentation setup, and monitor types for tracking agent behavior.
Overview
Agent Observability gives you full visibility into your AI agents, from the data that powers them to the prompts they receive and the outputs they generate. Instead of treating agents as black box systems, Monte Carlo provides a unified, end-to-end view across your data pipelines, models, tools, and agent workflows, so you can see exactly what happened, why it happened, and how to fix it.
Every agent run becomes a trace containing prompts, context, completions, token usage, latency, model metadata, errors, and workflow attributes. This level of detail enables teams to systematically evaluate output quality, detect silent failures, identify regressions, monitor cost and performance, and trace issues back to the upstream data or logic that shaped agent behavior.
With a warehouse-native architecture, all telemetry — including prompts and outputs — remains in your environment. Monte Carlo reads directly from your warehouse to provide the governance, security, and auditability enterprises expect, while giving you full visibility across diverse models, architectures, and workflows.
What Agent Observability unlocks
Agent Observability brings together data and AI in one connected view so you can deliver reliable, production-grade AI and detect issues fast.
- Trusted, production-grade AI with measurable quality
- Detection of subtle regressions, incomplete context, and behavioral drift before users are affected
- Quality evaluation at scale using customizable LLM-as-judge templates or deterministic checks
- Unified root-cause analysis across both data and AI layers
- Faster debugging with trace-level visibility
- Support for any model and any agent framework
- Monitor agents alongside the pipelines and data that feed them
- AI agent (Claude/Cursor/others)-powered monitoring and troubleshooting through MCP and our Agent Toolkit
Supported Warehouses
- Snowflake
- Databricks
- BigQuery
- Athena
Agent Telemetry Ingestion pattern
- Agents emit OpenTelemetry (OTLP) traces via the Monte Carlo SDK.
- An OTLP collector receives and processes the traces.
- The collector writes telemetry to object storage and/or directly into your warehouse.
- Monte Carlo reads the warehouse telemetry table for monitoring, evaluation, and alerting.
Using the same warehouse that stores your operational data makes it easy to correlate agent behavior with lineage, data health, and pipeline integrity.
Instrumenting your agent
To begin collecting agent telemetry, configure the following components:
- Install, set up tracing, and enhance tracing data with identifying attributes with the Monte Carlo OpenTelemetry SDK.
- Deploy an OpenTelemetry (OTLP) Collector, which receives and processes the spans emitted by your agent.
- Or, use Monte Carlo's hosted OpenTelemetry (OTLP) Collector to receive, process, and write the spans emitted by your agent into your data store to simplify infrastructure requirements. Note: Only AWS data stores are supported at this time.
- Configure your warehouse to ingest AI agent traces:
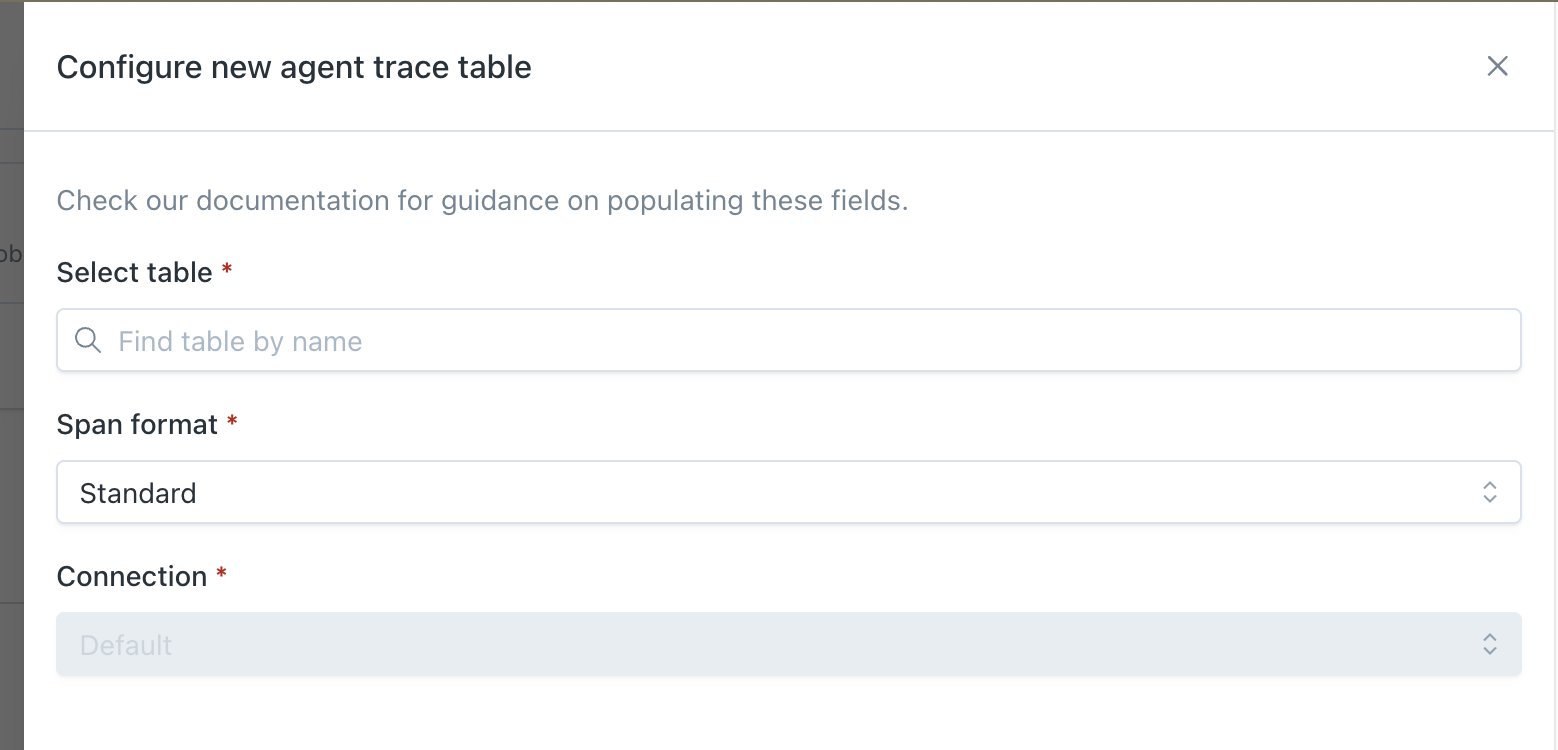
- Configure your trace table in Monte Carlo by visiting the Agent Observability settings page and selecting which table contains your AI Agent traces along with the format of the traces and which connection should be used to query this table.
Adding another agent? Once your pipeline is set up (the steps above), use the instrument-agent skill in the Monte Carlo Agent Toolkit to automate setup for every new agent. One prompt in your editor (Claude Code, Cursor, etc.) installs the SDK, places decorators, and verifies traces are flowing.
Configuring Agent Monitors
Monte Carlo offers specialized types of agent monitors to give you granular control over agent monitoring:
-
Agent Evaluation Monitors: Monitor agent output quality by alerting when agent responses contain hallucinations, fail accuracy checks, or don't meet quality standards.
Creating an Evaluation Monitor -
Agent Metric Monitors: Alert on unexpected changes in agent performance metrics like latency spikes, token usage exceeding budgets, or error rate thresholds.
Creating an Agent Metric Monitor -
Agent Trajectory Monitors: Verify execution order and workflow patterns by alerting when tools are called in unexpected sequences or frequencies.
Creating an Agent Trajectory Monitor -
Agent Validation Monitors: Enforce per-trace and per-span constraints by alerting when individual agent trace fields violate rules like model allow-lists, token limits, or latency thresholds
Creating an Agent Validation Monitor
Auto-generated and draft monitors
When a new agent is registered, Monte Carlo automatically generates a starter set of monitors from its first traces — so you're protected from the moment it goes live:
- Three metric monitors — latency, token consumption, and error rate — enabled immediately with ML-based thresholds.
- A prompt-adherence evaluation monitor, drafted when traces contain an LLM completion span.
- A trajectory monitor, drafted and pre-filled with the detected tool sequence when tool spans are present.
All four agent monitor types also support Save as draft. A viewer can stage a draft for an admin to promote before it goes live — useful for reviewing expensive-model and high-span combinations before they start incurring cost.
Use cases and examples
For comprehensive agent monitoring, use all Agent monitor types together: Evaluation Monitors ensure output quality, Metric Monitors ensure operational reliability, and Trajectory Monitors ensure proper execution flow.
| Agent Evaluation Monitors | Agent Metric Monitors | Agent Trajectory Monitors | Agent Validation Monitors | |
|---|---|---|---|---|
| Purpose | Measure output quality and correctness | Track operational health and performance | Validate tool call sequences | Enforce per-trace and per-span field constraints |
| Primary use cases | Hallucination detection, accuracy checks, quality standards | Latency monitoring, cost control, error tracking | Detect dependency issues, recursive calls, unexpected execution sequences | Model allow-list enforcement, token budget guardrails, per-request latency caps |
| What you're monitoring | Agent response quality, accuracy, completeness | Duration, token count, error rate, request volume | Tool call order, execution frequency, workflow steps | Model name, token count, duration, and other trace-level fields |
| Best for | Validating "what" the agent produces | Monitoring "how" the agent performs | Ensuring agents follow expected execution paths | Catching "which" individual traces break the rules |
| Alert examples | "Answer relevance is < 4", "Clarity score is anomalous" | "Max of total tokens is > 1,200", "Mean of duration is > 5s" | "delete_data occurs before check_permissions", "web_search occurs > 5 times" | "Model is not in set 'gpt-5, claude-3, llama-4'", "total_tokens is > 200" |
Updated 25 days ago