Agent Trajectory Monitors
As LLM applications grow more complex, it becomes difficult to track which tools are called, in what order, and how often. Agent Trajectory Monitors ensure your agents follow expected execution patterns by alerting when tools are called in the wrong order, too frequently, or are missing entirely. Use them to catch critical issues like database writes happening before permission checks, or recursive tool calls that could impact performance. They function similarly to Validation Monitors but operate on spans within agent traces.
Creating Agent Trajectory Monitors
Agent Trajectory monitors can be created by navigating to Add monitor → Agent trajectory.
Choose data
If your agent does not appear for selection in the Choose data → Agent list, Monte Carlo has not yet detected telemetry flowing into your warehouse. Verify that your agent is properly instrumented and that you've configured the agent trace table from the Agent Observability settings page.
- Agent: Select an agent to monitor. The agent appears here once telemetry is flowing into your warehouse.
- Time Filter: Select a time window of last
hour,day, orweek. This monitor validates new traces that appear within this time window each time it runs.- Note: The time window cannot be greater than the schedule interval.
Define alert conditions
Alert conditions determine when Monte Carlo should generate a new Alert based on the trajectory patterns you've configured.
Users can set alert conditions on workflow, task, and span_name. These can be selected from the span groups tree which appears when users clicks on Select span input field.
The following alert conditions are currently supported
- (workflow/task/span) occurs more than x times
- (workflow/task/span) occurs with (workflow/task/span)
- (workflow/task/span) occurs without (workflow/task/span)
- (workflow/task/span) occurs before (workflow/task/span)
- (workflow/task/span) occurs after (workflow/task/span)
- (workflow/task/span) does not occur before (workflow/task/span)
- (workflow/task/span) does not occur after (workflow/task/span)
- Note: Workflows can only be compared with other workflows, tasks with other tasks, and spans with other spans
Define schedule
Select when the monitor should run. Agent Trajectory monitors run according to the schedule defined below.
- On a schedule: Input a regular, periodic schedule. Options for handling daylight savings are available in the advanced dropdown.
Send notifications
Select which audiences should receive notifications when an anomaly is detected.
Additional settings exist for setting the description of the monitor which will be set as the header for notifications sent to notification channels, also pre-setting a priority on any incidents generated by the monitor.
See here for more information on Audiences and Notifications. Learn more about setting Monitor tags.
Notes
Text in the Notes section will be included directly in notifications. The "Show notes tips" dropdown includes details on how to @mention an individual or team if you are sending notifications to Slack.
Notes support rich-text formatting, including bold, italic, underline, strike-through, lists, links, and code blocks. Rich-text channels display these styles, while text-only channels show a plain-text equivalent.
Monitor properties can be dynamically inserted into Notes through variables. Supported variables include Created by, Last updated at, Last updated by, Priority, Tags and—for Validation and Custom SQL monitors—Query Result.
Alerts and Notifications
Alerts
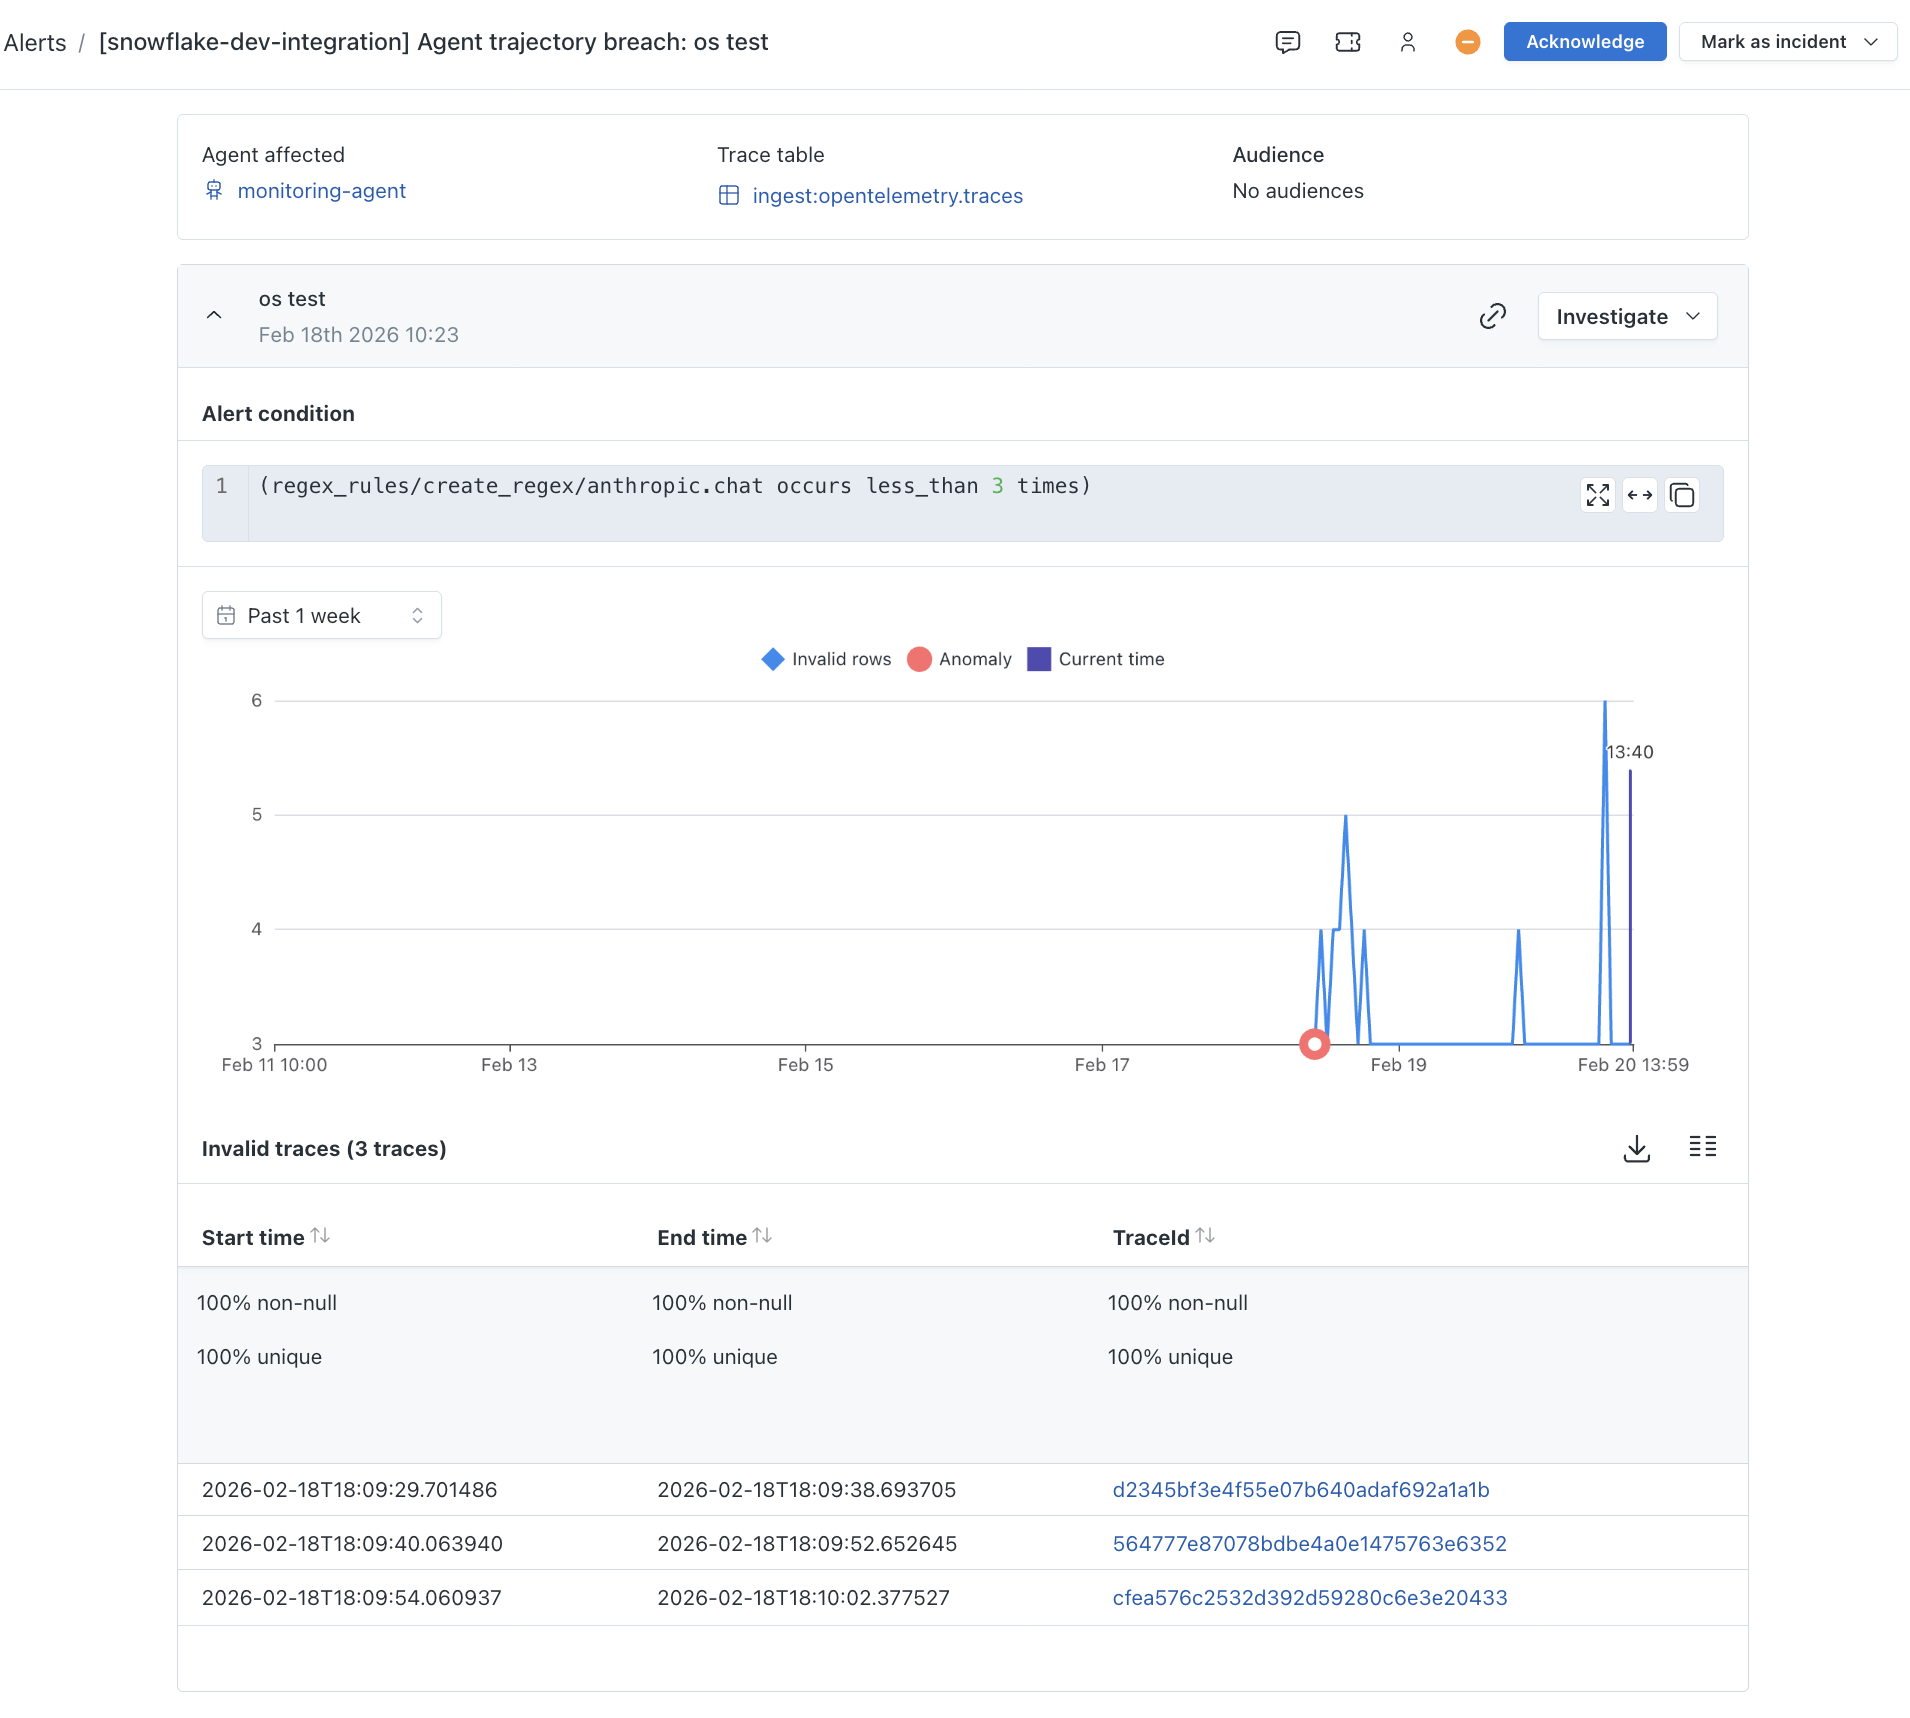
Agent Trajectory Monitors generate an Alert whenever traces breach the defined alert conditions.
Alerts from Trajectory Monitors include the following details:
- Number of traces that violated the conditions
- List of the invalid traces
- Historical graph of previous breaches
Notifications
Alert notifications are sent to your configured audiences and include:
- Description of the condition that was violated
- Number of traces that breached the alert condition
- Details about the most recent breach
Updated about 1 month ago