Validating with Monitors
The custom connector test suite validates your SQL templates against your database during development. However, once the connector is deployed and onboarded in Monte Carlo, it's a good idea to create monitors through the UI to validate the end-to-end flow — confirming that Monte Carlo's backend can correctly compile, execute, and collect results from the SQL it generates for your connector.
When to validate
After you add the connection, Monte Carlo runs an initial metadata collection job. Within a couple of minutes, tables from your custom connector should appear in the catalog. Once tables are visible, you're ready to create monitors.
Set up a domain
Custom connector tables are not automatically assigned to a domain. Before creating monitors, create or select a domain and add your custom connector tables to it. Monitors require a domain — you won't be able to create one until the tables are assigned.
Create test monitors
Create at least one monitor for each type your connector supports. The goal is not long-term monitoring — it's to exercise each code path in Monte Carlo's backend and confirm that queries compile and execute successfully against your database.
Use the Create Monitor page to set up each monitor. For every monitor, use the Test button (where available) to validate the generated query before saving.
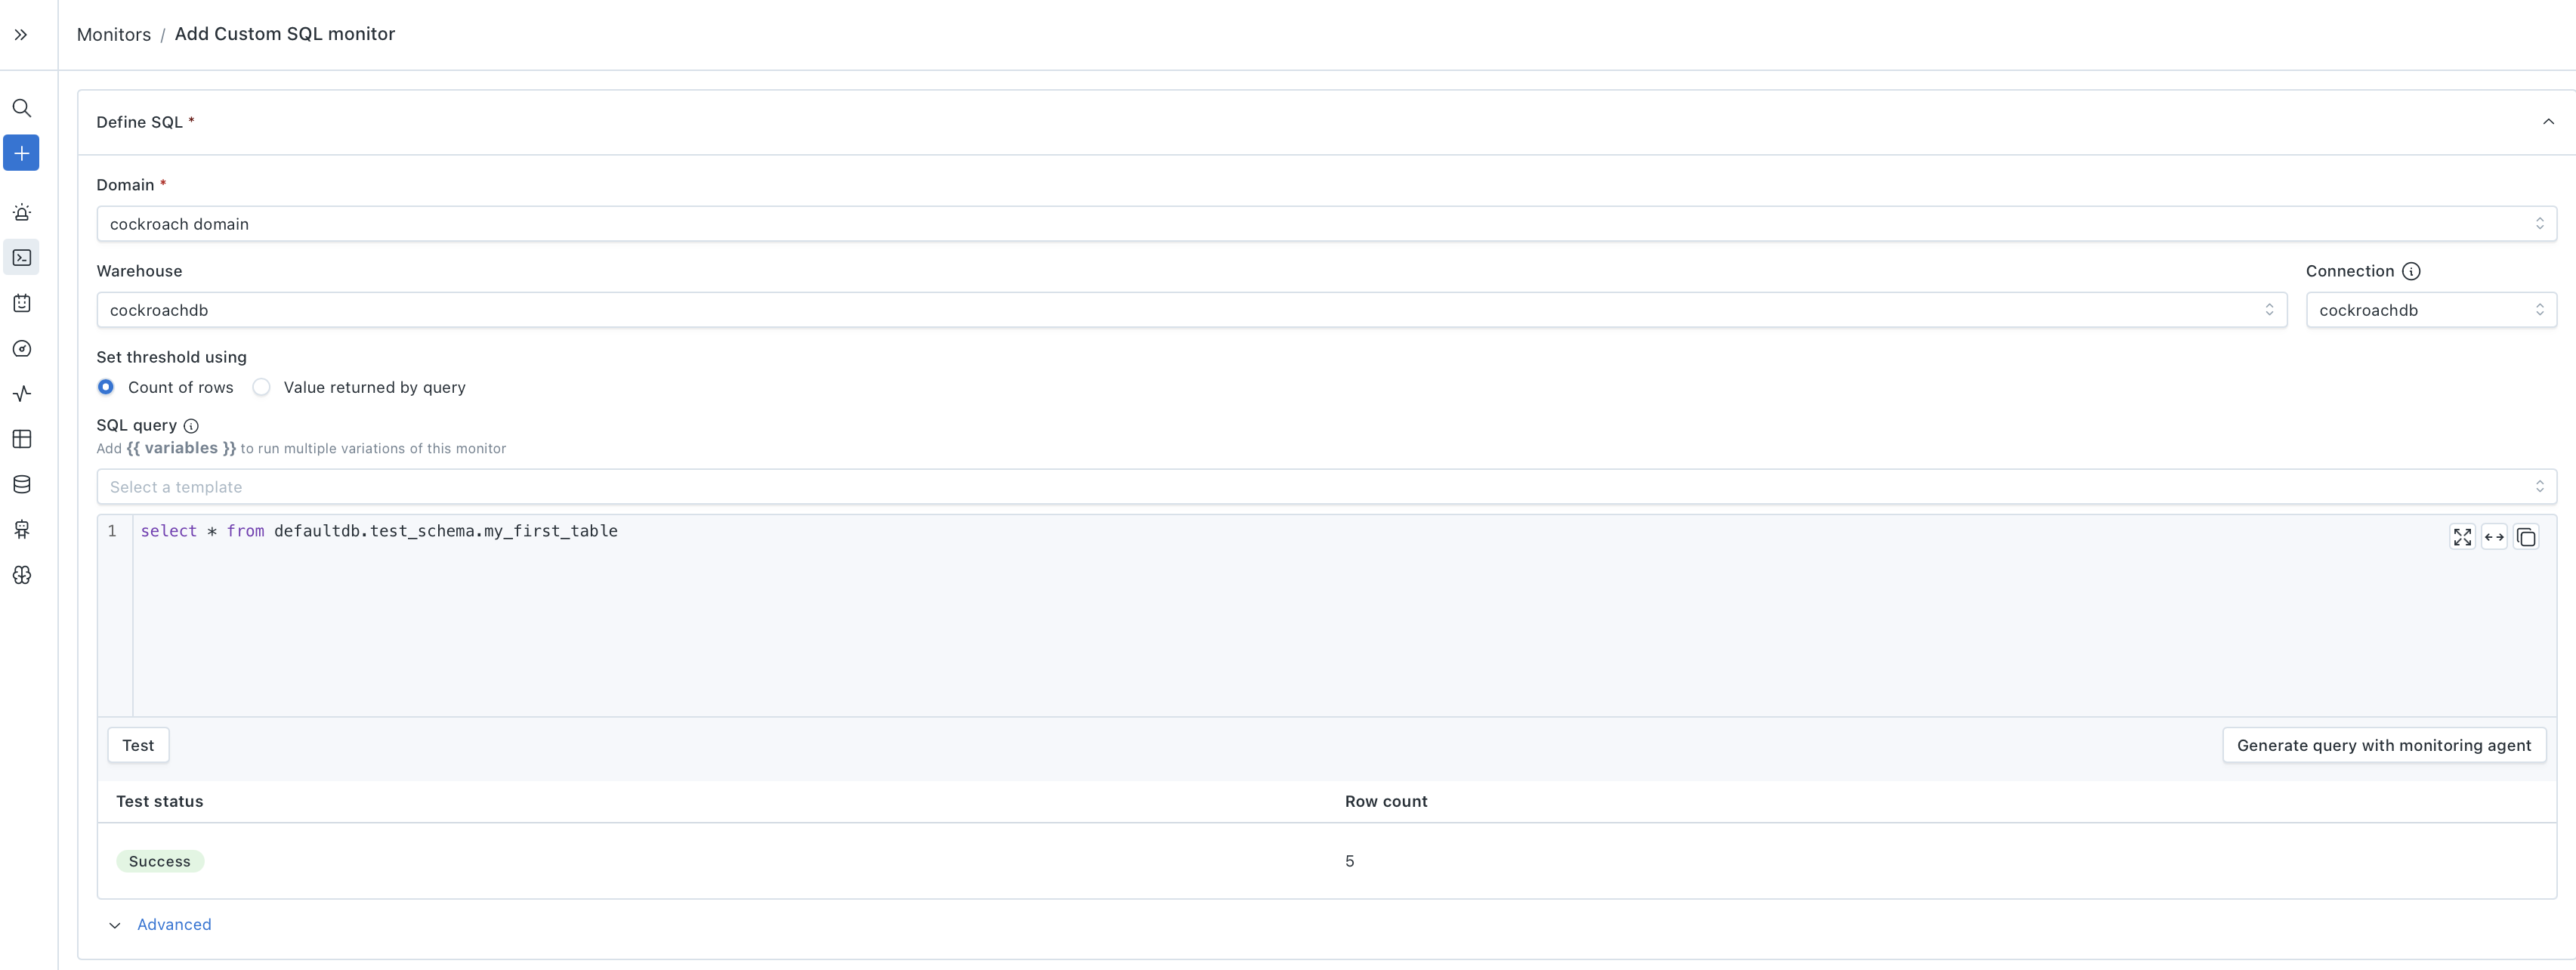
Custom SQL monitors
Supported if you implemented CustomSQLMonitorTemplates.
- Create a Custom SQL monitor.
- Select your custom connector warehouse.
- Write a simple query against one of your tables — for example,
SELECT COUNT(*) FROM schema.table. - Click Test to confirm the query executes and returns a result.
The Test button is sufficient to validate this path — you don't need to save the monitor. This confirms that Monte Carlo can route a user-defined SQL query through your connector and get results back.
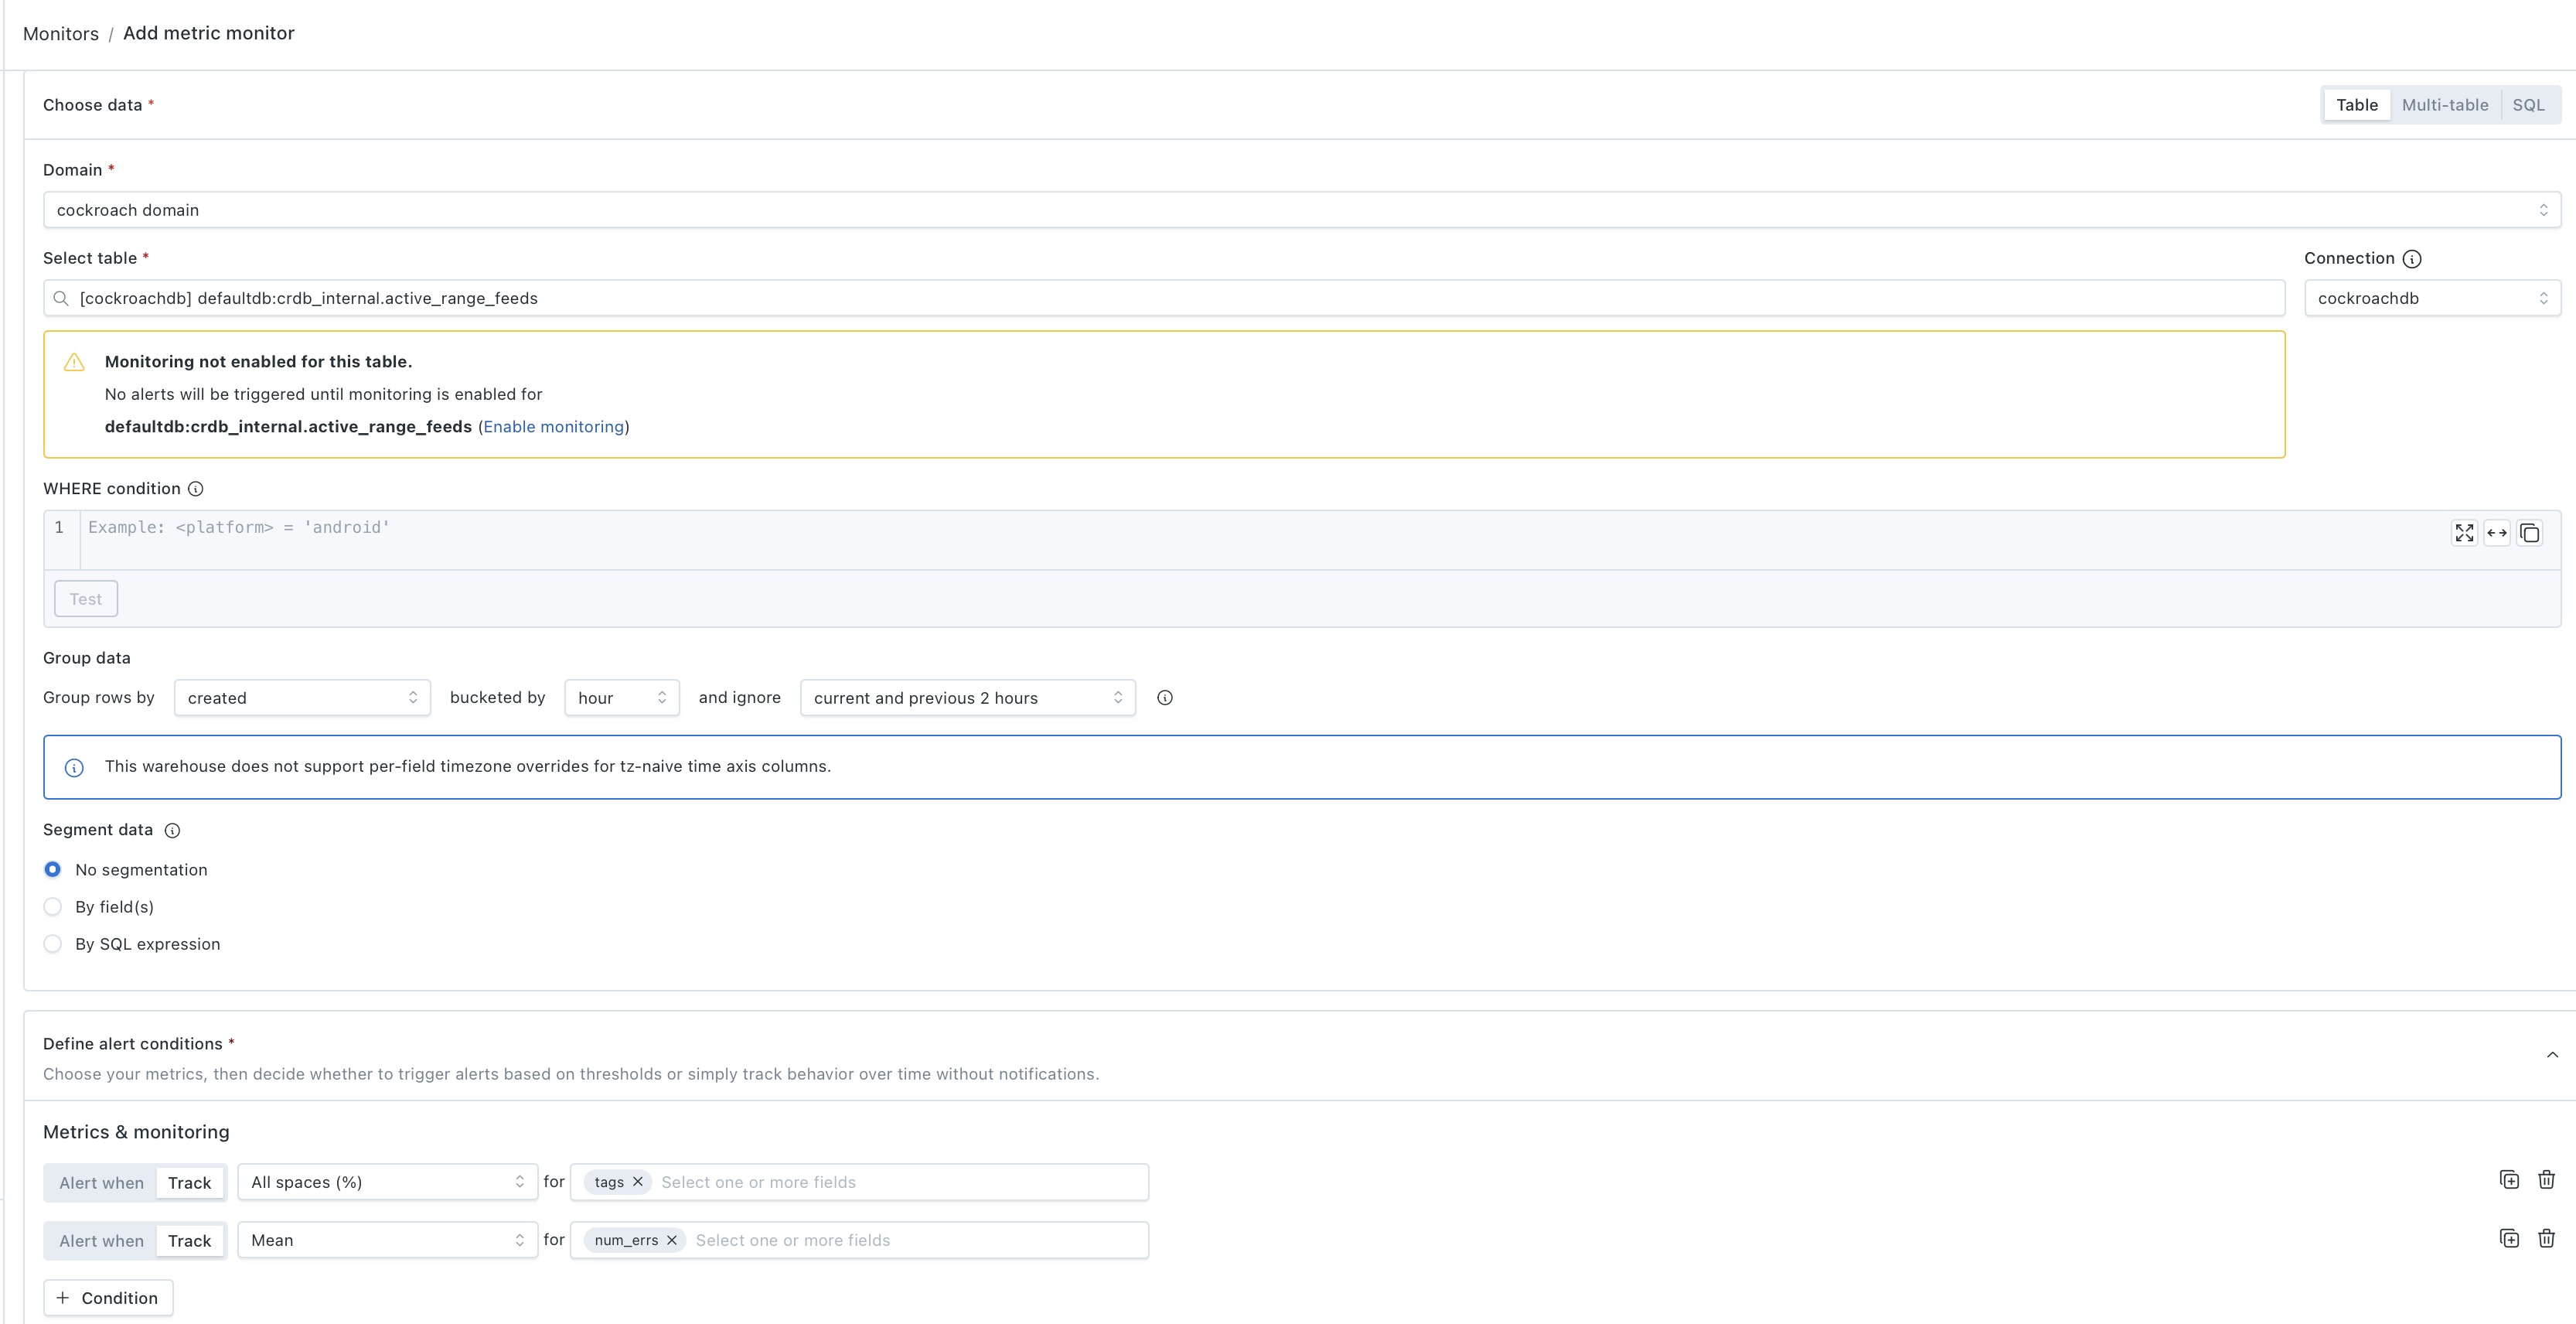
Metric monitors
Supported if you implemented QueryLanguageTemplates.
- Create a Metric monitor.
- Select a table from your custom connector.
- Add a few metrics — the metric dropdown will show only the metric types that your custom connector supports, based on which
QueryLanguageTemplatesmethods you implemented. Try metrics across different data types where available (e.g., null rate on a string column, mean on a numeric column). - Use Track mode (no threshold) for initial validation — you can promote to alerting later.
- Save and run the monitor.
This exercises Monte Carlo's query language compilation for your connector — the backend assembles SQL from your QueryLanguageTemplates methods (casting, aggregations, date functions, etc.) and executes it. If any metric fails, the error will point to which template method needs attention.
Validation monitors
Supported if you implemented QueryLanguageTemplates.
- Create a Validation monitor.
- Select a table from your custom connector.
- Add a condition — for example, a field is not null or a numeric field is greater than 0.
- Save and run the monitor.
This validates that Monte Carlo can generate row-level condition checks using your connector's SQL dialect.
Comparison monitors
Supported if you implemented QueryLanguageTemplates and you have a second data source to compare against.
- Create a Comparison monitor.
- Select a table from your custom connector as the source.
- Select a corresponding table from another warehouse as the target.
- Add a metric to compare — for example, row count or mean of a shared column.
- Save and run the monitor.
This validates cross-warehouse query compilation for your connector.
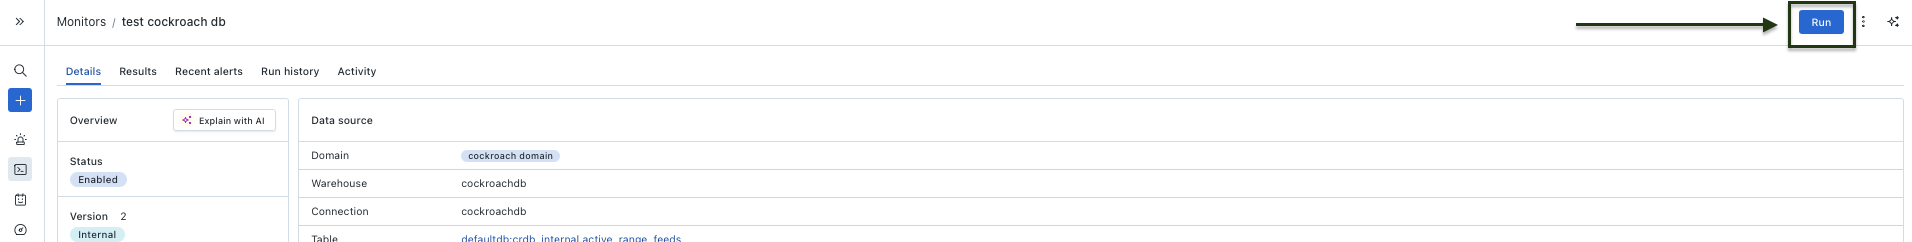
What to look for
When a monitor run succeeds, you'll see results on the monitor's detail page — metric values, row counts, or validation pass/fail summaries. This confirms the full pipeline is working: Monte Carlo compiled the SQL, your connector executed it, and results came back correctly.
If a monitor run fails, check the error message on the monitor's detail page. Common issues include:
- SQL compilation errors — a template method returns syntax your database doesn't accept. Fix the template in your connector, re-run the test suite, rebuild, and redeploy.
- Permission errors — the production credentials lack access to a schema or table. Update the credentials used by your connection.
- Timeout errors — the generated query is too slow. Consider adding indexes or adjusting the template to produce more efficient SQL.
After each monitor type runs successfully, you can delete the test monitors or keep them as ongoing checks — they'll work like any other Monte Carlo monitor going forward.
Updated about 1 month ago